HAL Id: hal-00327894
https://hal.archives-ouvertes.fr/hal-00327894
Submitted on 22 May 2006HAL is a multi-disciplinary open access
archive for the deposit and dissemination of sci-entific research documents, whether they are pub-lished or not. The documents may come from teaching and research institutions in France or abroad, or from public or private research centers.
L’archive ouverte pluridisciplinaire HAL, est destinée au dépôt et à la diffusion de documents scientifiques de niveau recherche, publiés ou non, émanant des établissements d’enseignement et de recherche français ou étrangers, des laboratoires publics ou privés.
First spectral measurement of the Earth’s upwelling
emission using an uncooled wideband Fourier transform
spectrometer
L. Palchetti, C. Belotti, G. Bianchini, F. Castagnoli, B. Carli, U. Cortesi, M.
Pellegrini, C. Camy-Peyret, P. Jeseck, Y. Té
To cite this version:
L. Palchetti, C. Belotti, G. Bianchini, F. Castagnoli, B. Carli, et al.. First spectral measurement of the Earth’s upwelling emission using an uncooled wideband Fourier transform spectrometer. Atmospheric Chemistry and Physics Discussions, European Geosciences Union, 2006, 6 (3), pp.4061-4080. �hal-00327894�
ACPD
6, 4061–4080, 2006 Wideband spectral measurement of the Earth’s emission L. Palchetti et al. Title Page Abstract Introduction Conclusions References Tables Figures J I J I Back Close Full Screen / EscPrinter-friendly Version Interactive Discussion
EGU
Atmos. Chem. Phys. Discuss., 6, 4061–4080, 2006 www.atmos-chem-phys-discuss.net/6/4061/2006/ © Author(s) 2006. This work is licensed
under a Creative Commons License.
Atmospheric Chemistry and Physics Discussions
First spectral measurement of the Earth’s
upwelling emission using an uncooled
wideband Fourier transform spectrometer
L. Palchetti1, C. Belotti1, G. Bianchini1, F. Castagnoli1, B. Carli1, U. Cortesi1, M. Pellegrini1, C. Camy-Peyret2, P. Jeseck2, and Y. T ´e2
1
Istituto di Fisica Applicata “Nello Carrara” – Consiglio Nazionale delle Ricerche, IFAC-CNR, Sesto Fiorentino, Firenze, 50019, Italy
2
Laboratoire de Physique Mol ´eculaire pour l’Atmosph `ere et l’Astrophysique, LPMAA, Universit ´e Pierre et Marie Curie – CNRS, Paris CEDEX 05, 75252, France
Received: 16 January 2006 – Accepted: 21 February 2006 – Published: 22 May 2006 Correspondence to: L.Palchetti ([email protected])
ACPD
6, 4061–4080, 2006 Wideband spectral measurement of the Earth’s emission L. Palchetti et al. Title Page Abstract Introduction Conclusions References Tables Figures J I J I Back Close Full Screen / EscPrinter-friendly Version Interactive Discussion
EGU
Abstract
The first spectral measurement of Earth’s emitted radiation to space in the wideband range from 100 to 1400 cm−1 with 0.5 cm−1 spectral resolution is presented. The mea-surement was performed from a stratospheric balloon in tropical region using a Fourier transform spectrometer, during a field campaign held in Brazil in June 2005. The
instru-5
ment, which has uncooled components including the detector module, is a prototype developed as part of the study for the REFIR (Radiation Explorer in the Far InfraRed) space mission. This paper shows the results of the field campaign with particular atten-tion to the measurement capabilities of the prototype. The results are compared with measurements taken by IASI-balloon (Infrared Atmospheric Sounding Interferometer –
10
Balloon version), aboard the same platform, and with forward model estimations. The infrared signature of clouds is observed in the measurements.
1 Introduction
The observation of the upwelling emission in the full relevant spectral range, from the mid infrared (MIR) to the far infrared (FIR) region is one important missing
measure-15
ment for the characterisation of the atmospheric Earth radiation budget.
Up to now instruments operating in the MIR region cover the range above 600 cm−1. The spectral observation of the FIR region, below 600 cm−1, was usually missing or covered only in narrow bands, because of technical limitations pertaining to space-borne spectrometers operating at long wavelengths. No space mission that exploits
20
the FIR for Earth’s observation has been made or selected for future operations. Despite that, the FIR region is very important because the most of the radiative cooling of the upper troposphere and lower stratosphere occurs here (Clough et al.,
1992;Clough and Iacono,1995). In clear sky conditions, from one third to one quarter of the total greenhouse forcing is calculated to occur in the FIR (Sinha and Harries,
25
ACPD
6, 4061–4080, 2006 Wideband spectral measurement of the Earth’s emission L. Palchetti et al. Title Page Abstract Introduction Conclusions References Tables Figures J I J I Back Close Full Screen / EscPrinter-friendly Version Interactive Discussion
EGU
cloudy conditions.
The identification and characterisation of the atmospheric properties which modu-late the Earth’s emission in this spectral region is a mandatory task for global climate change estimations. For instance, several aspects related to water vapour have been debated recently. The absorption continuum must be evaluated with particular attention
5
to its precise characterisation within the rotational band. The extent of direct or feed-back processes (Stocker et al.,2001;Philipona et al.,2005), and the radiative forcing due to ice clouds (Rizzi and Maestri, 2003) must be quantified. Wideband spectral measurements covering the FIR region are expected to address the above issues and water vapour profile measurements with more accuracy (Rizzi et al.,2002a).
10
Atmospheric emission measurements from space in the FIR require high efficiency spectrometers that could be obtained with cooled detectors (Mlynczak et al., 2003), however, cooling systems are difficult and expensive to maintain for long-duration space operations. Recently the development of high-efficiency uncooled pyroelectric detectors has allowed the design of high performance Fourier transform spectrometers
15
(FTS) (Carli et al.,1999;Formisano et al.,2005), which do not require cooling systems. The first project addressing these issues for the Earth’s atmosphere was the Radia-tion Explorer in the Far InfraRed (REFIR) project supported by the European Union in 1998–2000 (Rizzi et al.,2002b). The FTS turned out to be the most challenging unit of the mission since it required high technological effort to manufacture and test the new
20
components, most of which were not commercially available. A new FTS was designed with an optical layout that maximises the reliability of the spectrometer for long lifetime space applications and optimises its performances for uncooled operations (Carli et al.,
1999;Palchetti et al.,1999).
Some prototyping activity was required in order to study the trade-off among all
in-25
strument parameters, to test the optical layout, and to optimise the data acquisition strategy. In 2001, a first prototype named REFIR-BreadBoard (REFIR-BB) (Palchetti
ACPD
6, 4061–4080, 2006 Wideband spectral measurement of the Earth’s emission L. Palchetti et al. Title Page Abstract Introduction Conclusions References Tables Figures J I J I Back Close Full Screen / EscPrinter-friendly Version Interactive Discussion
EGU
tested in 2004 from the South of Italy (Esposito et al., 20061). A second prototype named REFIR-Prototype for Applications and Development (REFIR-PAD) was opti-mised for stratospheric measurements from balloon-borne platforms.
REFIR-PAD was recently flown for the first time on board the Laboratoire de Physique Mol ´eculaire pour l’Atmosph `ere et l’Astrophysique (LPMAA) gondola hosting the
In-5
frared Atmospheric Sounding Interferometer (IASI) – balloon (T ´e et al.,2002) during the Equatorial Large Balloons Campaign (ELBC) performed in Brazil in June 2005.
This paper describes the results obtained during the first launch of REFIR-PAD with particular attention to the measurement capability of this instrument. In Sect. 2 the main specifications of the instrument and the laboratory characterisation are
sum-10
marised. Section 3 is devoted to the results of the field campaign after the level 1 (from row data to calibrated spectra) analysis. Comparisons are presented with both the IASI-balloon instrument in the MIR region and forward model calculations over the full spectral range.
2 REFIR-PAD instrument
15
REFIR-PAD is a compact FTS with double-input/double-output port configuration, de-signed for being integrated on board different stratospheric platforms for field obser-vations. The instrument has simple mechanical and electrical interfaces for an easy integration on the hosting platforms and it is not temperature stabilised. No telemetry is required, the acquired data are stored on board using pressurised hard disks.
Fig-20
ure1shows a schematic of the instrument with the identification of the possible viewing directions: nadir, limb and deep space view at+30◦elevation angle.
1
Esposito, F., Grieco, G., Leone, L., Restieri, R., Serio, C., Bianchini, G., Palchetti, L., Pellegrini, M., Cuomo, V., Masiello, G., and Pavese, G.: REFIR/BB initial observations in the water vapour rotational band: results from a field campaign, J. Quant. Spectr. Rad. Trans., submitted, 2006.
ACPD
6, 4061–4080, 2006 Wideband spectral measurement of the Earth’s emission L. Palchetti et al. Title Page Abstract Introduction Conclusions References Tables Figures J I J I Back Close Full Screen / EscPrinter-friendly Version Interactive Discussion
EGU
REFIR-PAD makes use of two uncooled deuterated L-alanine-doped triglycene sul-phate (DLATGS) pyroelectric detectors, stabilised at 25◦C, which allow to reach the required noise performances. The interferometer can be operated with either polaris-ing or amplitude beam splitters (BS) in order to maximise the performance in different spectral regions.
5
A summary of the main parameters that characterise REFIR-PAD in the configuration used for the measurements here reported is shown in Table1. The instrument was operated with Ge-coated Mylar BSs covering the 100–1400 cm−1 spectral range with 0.5 cm−1 unapodised resolution and 30 s acquisition time. A hot black-body (HBB) at about 80◦C and a cold black-body (CBB) at about 20◦C are used for calibration. The
10
pointing mirror allows the spectrometer to look alternatively at these two sources during the in-flight calibration.
The instrument was characterised in the laboratory under vacuum conditions before the field campaign. The emission of the on board BBs was known with a temperature error of about 0.5 K. HBB was used as the input source for the evaluation of the
in-15
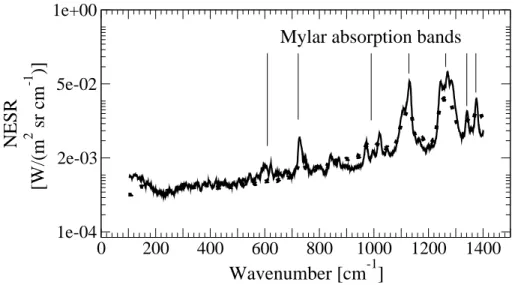
strument performances. Different measurements of HBB at a pressure of 20 Pa were performed, and the noise equivalent spectral radiance (NESR) was calculated. The results, shown in Fig.2(dots), are in the range of 0.5–2 mW/(m2sr cm−1), apart from a few narrow bands in which the NESR is larger due to a reduced instrument efficiency caused by the absorption of the Mylar substrates.
20
3 Results of stratospheric platform observations
REFIR-PAD was flown for the first time on 30 June 2005 from the Timon airfield, near Teresina, located in the North-East Brazil (in the region of Maranhao) at 05◦050S, 42◦520W. The ELBC campaign was led by the French Centre National d’Etudes Spa-tiales (CNES) in collaboration with the European Space Agency (ESA), within the
25
framework of the Envisat (Environmental Satellite) validation campaigns, and with the Brazilian National Institute for Space Research (Instituto Nacional de Pesquisas
Espa-ACPD
6, 4061–4080, 2006 Wideband spectral measurement of the Earth’s emission L. Palchetti et al. Title Page Abstract Introduction Conclusions References Tables Figures J I J I Back Close Full Screen / EscPrinter-friendly Version Interactive Discussion
EGU
ciais – INPE).
The LPMAA gondola, that hosted REFIR-PAD, was launched at 03:36 local time and landed 10 h later at 270 km south-west of Timon. The flight reached the mean floating altitude of 34 km for about 8 h.
During the flight, 54 sequences (10 during the ascending leg and 44 at floating
al-5
titude) were acquired. Each sequence contained calibration spectra, deep space and limb view measurements, as well as nadir measurements, according to the scheme shown in Table2. A total of 540 spectra per each output channel looking at the atmo-sphere at nadir were measured.
3.1 Instrument performances
10
The space and limb views are used for a verification of the calibration accuracy. Fig-ure3, for instance, shows an example of the space view (bottom panel) and limb view (top panel) measurements. The measured radiance is nearly zero apart the contribu-tion of the emission from the rotacontribu-tional water vapour band in the FIR region, the CO2 at 667 cm−1, and the O3at 1055 cm−1. In these and in the following figures, the four
15
high-frequency peaks of noise due to a reduced instrument efficiency caused by the absorption bands in the BS substrate (see Fig.2) are masked with blanks.
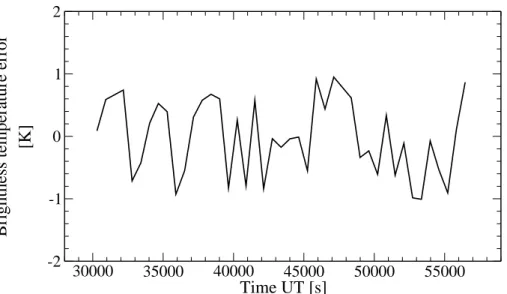
The radiance in the 500–560 cm−1 spectral window, where no significant emission lines exist in either the space view or the limb view, can be used for an estimate of the absolute calibration error. In this narrow spectral region, the mean difference from the
20
zero deep space radiance has allowed to calculate the equivalent brightness tempera-ture uncertainty, shown in Fig.4 as a function of time, for a brightness temperature of 280 K. The absolute calibration error resulted to be less than ±1 K peak-to-peak. Fur-ther improvements of the radiometric performances of REFIR-PAD are possible and the encouraging results of this first test flight are a good step in this direction.
25
In order to verify the measurement noise for nadir viewings, the NESR has been determined from the rms of a set of 10 measurements looking at a constant scene from a single sequence. The result, reported in Fig.2(continuous line), is comparable
ACPD
6, 4061–4080, 2006 Wideband spectral measurement of the Earth’s emission L. Palchetti et al. Title Page Abstract Introduction Conclusions References Tables Figures J I J I Back Close Full Screen / EscPrinter-friendly Version Interactive Discussion
EGU
to the NESR measured in laboratory conditions (dots) and allows to conclude that the instrument correctly attained its radiometric performances during the flight. The corresponding SNR is about 150 in the region around the CO2 band and meets the requirement of SNR>100 established in the space instrument feasibility study .
3.2 Comparison with IASI-balloon measurements
5
The accuracy of REFIR-PAD measurement has been checked against the results obtained with the balloon instrument sharing the same LPMAA gondola. IASI-balloon is a nadir looking Fourier transform MIR spectro-radiometer. Its spectral reso-lution is 0.1 cm−1. The radiometric calibration is done by two blackbodies (HBB heated to+30◦C and CBB cooled to −20◦C).
10
The two instruments have different ground pixels and this difference must be taken into account in the comparison. The boresights of the two Fourier transform instru-ments were co-aligned along the nadir direction, on ground before launch, using an IR camera and a warm point-like target. The camera, mounted on board the gondola for temperature characterisation of the observed scene, works in the 7.5–13 µm
spec-15
tral range and has a rectangular field of view of 0.416×0.312 rad (corresponding, at a float altitude of 34 km, to about 14×10 km on ground), which is sufficiently larger than both the IASI-balloon (0.016 rad) and the REFIR-PAD (0.133 rad) instantaneous fields of view (IFOV). In this way, the IR camera has allowed the identification of possible differences between the scenes seen by the two instruments.
20
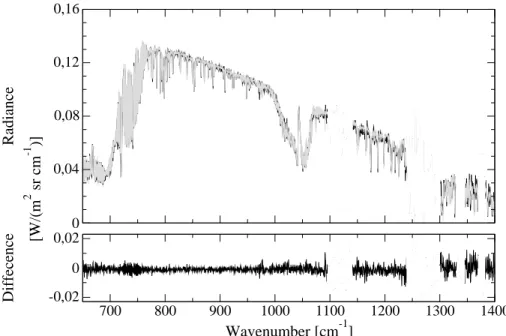
The comparison is performed in the spectral region from 650 to 1400 cm−1 common to the two instruments, when the observed scene is constant with time. Figure5shows the results obtained near the end of flight at 14:49 UTC. The comparison is good in terms of the absolute difference between the two measurements.
ACPD
6, 4061–4080, 2006 Wideband spectral measurement of the Earth’s emission L. Palchetti et al. Title Page Abstract Introduction Conclusions References Tables Figures J I J I Back Close Full Screen / EscPrinter-friendly Version Interactive Discussion
EGU
3.3 Wideband radiance
The wideband measurement of radiance allows the identification and characterisation of all the atmospheric components that control the radiation emitted to space. The spectral signatures of water vapour, CO2and O3allow the determination of the vertical profiles of temperature and concentrations, wheras the coverage of the full emission
5
band allows a study of the effect due to clouds or aerosols if present.
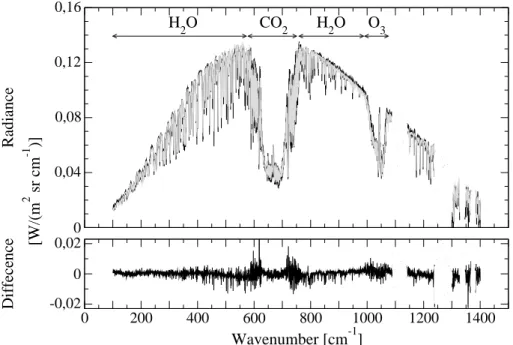
Observations over the whole spectral region observed by REFIR-PAD are com-pared with a simulation obtained by the atmospheric radiative transfer simulator (ARTS) (Buehler et al.,2005) forward model as a reference. In the simulation we used pressure and temperature values obtained from a balloon sounding performed from the nearest
10
meteorological station (Manaus, 03◦080S, 59◦580W) with data available in the same time window of the IASI-balloon/REFIR-PAD flight. The CO2volume mixing ratio used was 375 ppm, while the water vapour profile was fitted with a non-linear least-square routine. The other atmospheric profiles were taken from the tropical scenario of the fast atmospheric signature code (FASCOD) dataset (Anderson et al.,1986). The result
15
of the comparison between measured data and forward model, shown in Fig.6, gives generally a good agreement. The differences that exist are expected to be mostly due to a possible mismatch in the temperature profile.
Other significant new information could be extracted by the measurement of REFIR-PAD after the completion of the retrieval analysis. Water vapour and temperature
pro-20
files in clear sky conditions can be retrieved by taking advantage of the wideband cov-erage and of the new water vapour measurements in the FIR rotational band (Lubrano
et al.,2000;Rizzi et al.,2002a). The retrieval of vertical concentration profiles is be-yond the aim of this work and it will be covered in a future paper.
The wideband emitted radiances can also be affected by clouds, which are detected
25
by the IR camera co-aligned with IASI-balloon and REFIR. Figure7 shows the di ffer-ence in the spectral radiance measured in clear sky and cloudy conditions during the passage of a cloud through the instrument IFOV. The wideband spectrally resolved
ACPD
6, 4061–4080, 2006 Wideband spectral measurement of the Earth’s emission L. Palchetti et al. Title Page Abstract Introduction Conclusions References Tables Figures J I J I Back Close Full Screen / EscPrinter-friendly Version Interactive Discussion
EGU
coverage has allowed a quantification of the effect of the cloud in the whole emission spectrum. In this case, we see that the cloud causes a cooling in the 700–1000 cm−1 region and does not affect the atmospheric emission below 500 cm−1.
The different behaviour in the two spectral regions is an important piece of infor-mation about cloud characteristics that can be exploited in a comprehensive retrieval
5
approach of the REFIR-PAD measurements. In particular, REFIR-PAD is expected to be sensitive to the properties of high altitude cirrus clouds that have important signa-tures in the 200–500 cm−1 range (Evans et al.,1999;Yang at al.,2003).
4 Conclusions
The first spectral measurement of the wideband thermal emission of the Earth’s
atmo-10
sphere was performed from a stratospheric balloon using the REFIR-PAD instrument in the 100–1400 cm−1 spectral range at 0.5 cm−1 resolution.
An important technical feature of these new measurements is the use of an uncooled instrument with uncooled detectors. An important scientific feature is the observation of the FIR component of the emitted radiation, which can not be neglected for a proper
15
modelling of long term climate changes. The combination of the two features opens new perspectives in space-borne observations of the atmosphere.
The measurements allow the clear identification of the effects of clouds and the vertical distributions of water vapour and temperature. A comprehensive work is in progress for the simultaneous quantification of the different components of the system.
20
Acknowledgements. The authors acknowledge the helpful support for the Brazilian field
cam-paign of CNES balloon team (led by P. Chadoutaud) and CNES nacelles point ´ees (led by J. Evrard), LPMAA gondola team for having hosted REFIR-PAD, and INPE for logistics. The authors also wish to thank ESA for the support given in the early stage of development of the instrument components.
ACPD
6, 4061–4080, 2006 Wideband spectral measurement of the Earth’s emission L. Palchetti et al. Title Page Abstract Introduction Conclusions References Tables Figures J I J I Back Close Full Screen / EscPrinter-friendly Version Interactive Discussion
EGU
References
Anderson, G. P., Clough, S. A., Kneizys, F. X., Chetwynd, J. H., and Shettle, E. P.: AFGL atmospheric constituent profiles (0–120 km), Tech. Rep. TR-86-0110, Air Force Geophys. Lab, Bedford, Mass., 1986. 4068
Brindley, H. E. and Harries, J. E.: The impact of FAR I.R. absorption on clear sky greenhouse
5
forcing: sensitivity studies at high spectral resolution, J. Quant. Spectrosc. Radiat. Trans., 60, 151–180, 1998. 4062
Buehler, S. A., Eriksson, P., Kuhn, T., Von Engeln, A., and Verdes, C.: ARTS, the atmospheric radiative transfer simulator, J. Quant. Spectrosc. Radiat. Trans., 91, 65–93, 2005. 4068 Carli, B., Barbis, A., Harries, J. E., and Palchetti, L.: Design of an efficient broad band far
10
infrared FT spectrometer, Appl. Opt., 38, 3945–3950, 1999. 4063
Clough, S. A., Iacono, M. J., and Moncet, J. L.: Line-by-Line Calculations of Atmospheric Fluxes and Cooling Rates – Application to Water-Vapor, J. Geophys. Res. A., 97, 15 761–15 785, 1992. 4062
Clough, S. A. and Iacono, M. J.: Line-by-Line Calculation of Atmospheric Fluxes and Cooling
15
Rates 2. Application to Carbon-Dioxide, Ozone, Methane, Nitrous-Oxide and the Halocar-bons, J. Geophys. Res. A., 100, 16 519–16 535, 1995. 4062
Evans, K. F., Evans, A. H., Nolt, I. G., and Marshall, B. T.: The prospect for Remote Sensing of Cirrus Clouds with a Submillimiter-Wave Spectrometer, J. Appl. Meteorol., 38, 514–525, 1999. 4069
20
Formisano, V., Angrilli, F., Arnold, G., et al.: The Planetary Fourier Spectrometer (PFS) onboard the European Mars Express mission, Planet. Space Sci., 53, 963–974, 2005. 4063
Mlynczak, M. G., Johnson, D. G., Bingham, G. E, Jucks, K. W., Traub, W. A., Gordley, L., and Harries, J. E.: The Far-Infrared Spectroscopy of the Troposphere (FIRST) Project, Geo-science and Remote Sensing Symposium, IGARSS 21–25 July 2003, Proc. IEEE Int., 1,
25
512–514, 2003. 4063
Palchetti, L., Barbis, A., Harries, J. E., and Lastrucci, D.: Design and mathematical modelling of the space-borne far-infrared Fourier transform spectrometer for REFIR experiment, Infrared Phys. & Tech., 40, 367–377, 1999. 4063
Lubrano, A. M., Serio, C., Clough, S. A., and Kobayashi, H.: Simultaneous inversion for
tem-30
perature and water vapor from IMG radiances, Geophys. Res. Lett., 27, 2533–2536, 2000. 4068
ACPD
6, 4061–4080, 2006 Wideband spectral measurement of the Earth’s emission L. Palchetti et al. Title Page Abstract Introduction Conclusions References Tables Figures J I J I Back Close Full Screen / EscPrinter-friendly Version Interactive Discussion
EGU
Palchetti, L., Bianchini, G., Castagnoli, F., Carli, B., Serio, C., Esposito, F., Cuomo, V., Rizzi, R., and Maestri, T.: Breadboard of a Fourier-transform spectrometer for the Radiation Explorer in the Far Infrared atmospheric mission, Appl. Opt., 44, 2870–2878, 2005. 4063
Philipona, R., D ¨urr, B., Ohmura, A., and Ruckstuhl, C.: Anthropogenic greenhouse forcing and strong water vapor feedback increase temperature in Europe, Geophys. Res. Lett., 32,
5
2533–2536, 2005. 4063
Rizzi, R., Serio, C., and Amorati, R.: Sensitivity of broad-band and spectral measurements of outgoing radiance to changes in water vapour content, in: Optical Spectroscopic Techniques, Remote Sensing and Instrumentation for Atmospheric and Space Research IV, edited by: Larar, A. M. and Mlynczak, M. G., Proceedings of SPIE, 4485, 181–190, 2002. 4063,4068
10
Rizzi, R., Palchetti, L., Carli, B., Bonsignori, R., Harries, J. E., Leotin, J., Peskett, S., Serio, C., and Sutera, A.: Feasibility study of the space-borne Radiation Explorer in the Far InfraRed (REFIR), in Optical Spectroscopic Techniques, Remote Sensing and Instrumentation for At-mospheric and Space Research IV, edited by: Larar, A. M. and Mlynczak, M. G., Proceedings of SPIE, 4485, 202–209, 2002. 4063
15
Rizzi, R. and Maestri, T.: Some considerations on far infrared emission in presence of clouds, J. Geophys. Res., 108, 4403–4408, 2003. 4063
Sinha, A. and Harries, J. E.: Water vapor greenhouse trapping: The role of the far infrared absorption, Geophys. Res. Lett., 22, 2147–2150, 1995. 4062
Stocker T. F., Clarke, G. K. C., Le Treut, H., Lindzen, R. S., et al.: Physical Climate Processes
20
and Feedbacks. Climate Change 2001: The Scientific Basis, IPCC Third Assessment Re-port, Chapter 7, Cambridge Univ. Press, 2001. 4063
T ´e, Y., Jeseck, P., Camy-Peyret, C., Payan, S., Perron, G., and Aubertin, G.: Balloonborne calibrated spectroradiometer for atmospheric nadir sounding, Appl. Opt., 41, 6431–6441, 2002. 4064
25
Yang, P., Mlynczak, M. G., Wei, H., Kratz, D. P., Baum, B. A., Hu, Y. X., Wiscombe, W. J., Heidinger, A., and Mishchenko, M. I.: Spectral signature of ice clouds in the far-infrared region: Single-scattering calculations and radiative sensitivity study, J. Geophys. Res., 108, 4569, 2003. 4069
ACPD
6, 4061–4080, 2006 Wideband spectral measurement of the Earth’s emission L. Palchetti et al. Title Page Abstract Introduction Conclusions References Tables Figures J I J I Back Close Full Screen / EscPrinter-friendly Version Interactive Discussion
EGU
Table 1. Configuration of the REFIR-PAD instrument for Earth’s emission measurements.
Spectrometer specifications
Interferometer ports double-input/double-output Spectral coverage 100–1400 cm−1
Spectral resolution 0.5 cm−1 Optical throughput 0.02 cm2sr
Field of view 0.133 rad
Line of sight nadir, limb, deep space at+30◦
Acquisition time 30 s
Absolute calibration error 0.5 K
Beam splitters Ge-coated Mylar film
Detectors DLATGS pyroelectric detectors
Size 62 cm diam., 26 cm heigth
ACPD
6, 4061–4080, 2006 Wideband spectral measurement of the Earth’s emission L. Palchetti et al. Title Page Abstract Introduction Conclusions References Tables Figures J I J I Back Close Full Screen / EscPrinter-friendly Version Interactive Discussion
EGU
Table 2. Acquisition sequence of measurements.
Spectrum number Observed view
0–1 CBB
2–3 HBB
4 deep space (+30◦elevation angle) 5 limb (0◦ elevation angle)
ACPD
6, 4061–4080, 2006 Wideband spectral measurement of the Earth’s emission L. Palchetti et al. Title Page Abstract Introduction Conclusions References Tables Figures J I J I Back Close Full Screen / EscPrinter-friendly Version Interactive Discussion
EGU
ACPD
6, 4061–4080, 2006 Wideband spectral measurement of the Earth’s emission L. Palchetti et al. Title Page Abstract Introduction Conclusions References Tables Figures J I J I Back Close Full Screen / EscPrinter-friendly Version Interactive Discussion EGU 0 200 400 600 800 1000 1200 1400
Wavenumber [cm
-1]
1e-04 2e-03 5e-02 1e+00NESR
[W/(m
2sr cm
-1)]
Mylar absorption bands
Fig. 2. Comparison between NESR measured during the 30 June 2005 flight (solid line) and
ACPD
6, 4061–4080, 2006 Wideband spectral measurement of the Earth’s emission L. Palchetti et al. Title Page Abstract Introduction Conclusions References Tables Figures J I J I Back Close Full Screen / EscPrinter-friendly Version Interactive Discussion EGU 0 0,04 0,08 Radiance 0 200 400 600 800 1000 1200 1400 Wavenumber [cm-1] 0 0,04 0,08 [W/(m 2 sr cm -1 )] H2O CO2 O3
Fig. 3. Measurement of radiance emitted from the deep space (bottom panel) and the
ACPD
6, 4061–4080, 2006 Wideband spectral measurement of the Earth’s emission L. Palchetti et al. Title Page Abstract Introduction Conclusions References Tables Figures J I J I Back Close Full Screen / EscPrinter-friendly Version Interactive Discussion EGU 30000 35000 40000 45000 50000 55000 Time UT [s] -2 -1 0 1 2
Brightness temperature error
[K]
Fig. 4. Brightness temperature error during the flight, defined at 500–560 cm−1for a brightness temperature of 280 K.
ACPD
6, 4061–4080, 2006 Wideband spectral measurement of the Earth’s emission L. Palchetti et al. Title Page Abstract Introduction Conclusions References Tables Figures J I J I Back Close Full Screen / EscPrinter-friendly Version Interactive Discussion EGU 0 0,04 0,08 0,12 0,16 Radiance 700 800 900 1000 1100 1200 1300 1400 Wavenumber [cm-1] -0,02 0 0,02 Diffecence [W/(m 2 sr cm -1 )]
Fig. 5. Comparison of REFIR-PAD and IASI-balloon measurements (top panel – black and
grey lines, respectively) and differences (bottom panel) in the common spectral region. Mea-surements were acquired near the end of flight at 14:49 UTC.
ACPD
6, 4061–4080, 2006 Wideband spectral measurement of the Earth’s emission L. Palchetti et al. Title Page Abstract Introduction Conclusions References Tables Figures J I J I Back Close Full Screen / EscPrinter-friendly Version Interactive Discussion EGU 0 0,04 0,08 0,12 0,16 Radiance 0 200 400 600 800 1000 1200 1400 Wavenumber [cm-1] -0,02 0 0,02 Diffecence [W/(m 2 sr cm -1 )] H2O CO2 H2O O3
Fig. 6. Comparison of REFIR-PAD with ARTS forward model (top panel) and differences
ACPD
6, 4061–4080, 2006 Wideband spectral measurement of the Earth’s emission L. Palchetti et al. Title Page Abstract Introduction Conclusions References Tables Figures J I J I Back Close Full Screen / EscPrinter-friendly Version Interactive Discussion EGU 0 0,04 0,08 0,12 0,16 Radiance 0 200 400 600 800 1000 1200 Wavenumber [cm-1] -0,02 0 0,02 Diffecence [W/(m 2 sr cm -1 )]
Fig. 7. Comparison between measurements in clear sky and in presence of clouds (top panel