HAL Id: hal-01581147
https://hal.sorbonne-universite.fr/hal-01581147
Submitted on 4 Sep 2017
HAL is a multi-disciplinary open access
archive for the deposit and dissemination of
sci-entific research documents, whether they are
pub-lished or not. The documents may come from
teaching and research institutions in France or
abroad, or from public or private research centers.
L’archive ouverte pluridisciplinaire HAL, est
destinée au dépôt et à la diffusion de documents
scientifiques de niveau recherche, publiés ou non,
émanant des établissements d’enseignement et de
recherche français ou étrangers, des laboratoires
publics ou privés.
Distributed under a Creative Commons Attribution| 4.0 International License
Yan Sun, Shushi Peng, Daniel S. Goll, Philippe Ciais, Bertrand Guenet,
Matthieu Guimberteau, Philippe Hinsinger, Ivan A. Janssens, Josep Peñuelas,
Shilong Piao, et al.
To cite this version:
Yan Sun, Shushi Peng, Daniel S. Goll, Philippe Ciais, Bertrand Guenet, et al.. Diagnosing
phospho-rus limitations in natural terrestrial ecosystems in carbon cycle models. Earth’s Future, American
Geophysical Union, 2017, 5 (7), pp.730-749. �10.1002/2016EF000472�. �hal-01581147�
ecosystems in carbon cycle models
Yan Sun1,2 , Shushi Peng1 , Daniel S. Goll2 , Philippe Ciais2, Bertrand Guenet2 , Matthieu Guimberteau2,3 , Philippe Hinsinger4 , Ivan A. Janssens5, Josep Peñuelas6,7 , Shilong Piao1,8 , Benjamin Poulter9 , Aurélie Violette2, Xiaojuan Yang10 , Yi Yin2 , and Hui Zeng11
1Sino-French Institute for Earth System Science, College of Urban and Environmental Sciences, Peking University, Beijing, China,2Laboratoire des Sciences du Climat et de 1’Environnement, CEA-CNRS-UVSQ, Gif sur Yvette, France, 3UPMC, CNRS, EPHE, Sorbonne Universités, Paris, France,4UMR Eco&Sols, INRA, Montpellier, France,5Research Group of Plant and Vegetation Ecology (PLECO), Department of Biology, University of Antwerp, Antwerp, Belgium,6CSIC, Global Ecology Unit, CREAF-CSIC-UAB, Catalonia, Spain,7CREAF, Catalonia, Spain,8Institute of Tibetan Plateau Research, Chinese Academy of Sciences, Beijing, China,9Institute on Ecosystems and the Department of Ecology, Montana State University, Bozeman, Montana, USA,10Oak Ridge National Lab, Oak Ridge, Tennessee, USA,11Shenzhen Graduate School, Peking University, Shenzhen, China
Abstract
Most of the Earth System Models (ESMs) project increases in net primary productivity (NPP) and terrestrial carbon (C) storage during the 21st century. Despite empirical evidence that limited avail-ability of phosphorus (P) may limit the response of NPP to increasing atmospheric CO2, none of the ESMs used in the previous Intergovernmental Panel on Climate Change assessment accounted for P limitation. We diagnosed from ESM simulations the amount of P need to support increases in carbon uptake by nat-ural ecosystems using two approaches: the demand derived from (1) changes in C stocks and (2) changes in NPP. The C stock-based additional P demand was estimated to range between −31 and 193 Tg P and between −89 and 262 Tg P for Representative Concentration Pathway (RCP) 2.6 and RCP8.5, respectively, with negative values indicating a P surplus. The NPP-based demand, which takes ecosystem P recycling into account, results in a significantly higher P demand of 648–1606 Tg P for RCP2.6 and 924–2110 Tg P for RCP8.5. We found that the P demand is sensitive to the turnover of P in decomposing plant material, explaining the large differences between the NPP-based demand and C stock-based demand. The discrep-ancy between diagnosed P demand and actual P availability (potential P deficit) depends mainly on the assumptions about availability of the different soil P forms. Overall, future P limitation strongly depends on both soil P availability and P recycling on ecosystem scale.Plain Language Summary
Phosphorus (P) is a fundamental component of all living organisms. Low available P in soils is considered to be a limiting factor for plant growth in a majority of ecosystems. Increases in projected productivity and carbon (C) sinks in the next few decades need higher P input and/or enhanced P recycling to support. If soil available P and P input into natural ecosystems cannot keep pace with the increased demand of P by increased future carbon sink in natural ecosystems, then the future carbon sink could be reduced. The magnitude of land carbon sink on mitigating climate change also depends on future P limitation. In this study, we diagnosed future additional P demand of natural ecosystems by two approaches, and these two approaches get very different magnitude of P limitation on future carbon sink. The large uncertainty between the two approaches is caused by processes of P cycle such as litter P turnover and parameters such as soil and plant stoichiometry. In addition, large uncertainty of soil available P also leads to large uncertainty in future P limitation. To reduce the large uncertainty of future P limitation, soil available P and key processes of P cycle needs further investigation.1. Introduction
Phosphorus (P) is a fundamental component of all living organisms [White and Hammond, 2008]. Its primary source in terrestrial systems derives from weathering of minerals [Walker and Syers, 1976; Vitousek et al., 2010]. Once released from parent material, P is quickly converted into less available forms (biomass P, P 10.1002/2016EF000472
Key Points:
• None of the ESMs used in the IPCC AR5 accounted for the effect of P limitation on the increase in NPP and carbon storage
• Future additional P demand was estimated to have very large uncertainties under different climate scenarios and approaches • Future P limitation strongly depends
on soil P availability, litter P turnover, the C:P stoichiometry of plant, and the P content in soil organic matter
Supporting Information:
• Supporting Information S1
Correspondence to:
S. Peng, [email protected]
Citation:
Sun, Y. et al. (2017), Diagnosing phosphorus limitations in natural terrestrial ecosystems in carbon cycle models, Earth’s Future, 5, 730–749, doi:10.1002/2016EF000472.
Received 24 SEP 2016 Accepted 25 APR 2017
Accepted article online 28 APR 2017 Published online 18 JUL 2017
© 2017 The Authors.
This is an open access article under the terms of the Creative Commons Attribution-NonCommercial-NoDerivs License, which permits use and distri-bution in any medium, provided the original work is properly cited, the use is non-commercial and no modifica-tions or adaptamodifica-tions are made.
adsorbed to soil particles and occluded in secondary minerals; Walker and Syers [1976]; Vitousek et al. [2010]). P from atmospheric deposition provides another but minor P input to terrestrial ecosystems [Newman, 1995;
Peñuelas et al., 2013].
Low concentration of soil P available to biota is considered as a limiting factor for plant growth in a wide range of ecosystems [Hinsinger, 2001; Elser et al., 2007]. In response to the low concentrations of available soil P, plants have evolved processes that tend to minimize losses of P and enhance recycling at ecosystem levels [Walker and Syers, 1976; Vance et al., 2003; Lambers et al., 2011]. The extent to which ecosystems are able to increase the efficiencies at which they recycle, use (in respect to carbon assimilation), and retain P controls the potential effect of P cycling on future carbon sequestration [Vitousek et al., 2010; Goll et al., 2012; Yang et al., 2014; Reed et al., 2015].
Despite evidence for P limitation from observations [Elser et al., 2007; Vitousek et al., 2010; Norby et al., 2016] and model simulations [Wang et al., 2010; Zhang et al., 2011; Goll et al., 2012; Yang et al., 2014; Zhang et al., 2014; Wang et al., 2015], none of the Earth System Models (ESMs) incorporate C-P interactions in the fifth Climate Model Inter-comparison (CMIP5) project of the Intergovernmental Panel on Climate Change (IPCC) Fifth Assessment Report (AR5). In absence of P limitation, most of ESMs project an increase in terrestrial C storage and net primary productivity (NPP) by the end of the 21st century [Jones et al., 2013]. Based on the stoichiometry of plant and soil C pools, Peñuelas et al. [2013] diagnosed the amount of P necessary to support increases of C storage predicted by ESMs (C stock-based additional P demand). They estimated additional P demands of −0.9–4.3 Pg (RCP2.6) and −1.7–6.5 Pg (RCP8.5), which lie within their estimates of available soil P between −2 and 11 Pg P. Wieder et al. [2015] used projected NPP instead of C stocks to compute the land C storage, which is supported by a scenario of low P availability of 0.75 Pg P, and found that N and P limitation could reduce land C storage by 52–629 Pg C, turning land into a source of carbon by end of the century. Their results were criticized because of the use of an extreme low P availability scenario and the assumed decoupling of C decomposition from mineralization, which both maximize the negative effect of nutrient limitation on land C storage [Brovkin and Goll, 2015].
The studies by Peñuelas et al. [2013] and Wieder et al. [2015] are not directly comparable due to differences in (1) the approach of diagnosing nutrient demand, (2) assumptions about the availability of phosphorus, and (3) reported variables (Wieder et al. [2015] only reports C fluxes and stocks while Peñuelas et al. [2013] only reports P demand). Thus the factors leading to the vast differences remain unclear. Comparison and reconciliation of those two approaches will help to identify the causes for the differences, to reveal the key processes coupling C and P and to ultimately improve the estimation of additional P demand to maintain future C sinks.
The main purposes of this study are (1) to compare and reconcile the P demand implied by CMIP5 projec-tions using both the C stock- versus the NPP-based approaches in a consistent framework; (2) to investigate whether available soil P can support the P demand with four scenarios of soil P availability; (3) to discuss the uncertainties of parameters, available soil P and future P demand and potential P deficit. To address these questions, we used outputs from CMIP5 models in combination with observed stoichiometric relationships to diagnose the P demand and P deficit under two future CO2pathways (RCP2.6 and RCP8.5) by the C stock-and NPP-based approaches.
2. Data and Materials
As illustrated in Figure 1, we used biome-specific and soil type-specific stoichiometric C:P ratios to diagnose the additional P demand from either changes in NPP or in C stocks simulated by ESMs for the 21st century [Taylor et al., 2012]. We then compared the inferred P demand to P supply given by observation-based esti-mates of available soil P [Yang et al., 2013] and increases in P release from weathering due to soil warming [Goll et al., 2014] to derive soil potential P deficit during the 21st century. Details of data and materials are described below.
2.1. Earth System Model Outputs From CMIP5
We used simulations of terrestrial C storage from the ESMs of the CMIP5 project [Taylor et al., 2012]. We selected data from the historical period (1850–2005) and two representative greenhouse con-centration pathways (RCPs). Only three models, each from different modeling center (IPSL-CM5A-MR,
MIROC-ESM-CHEM and BNU-ESM; http://cmip-pcmdi.llnl.gov/cmip5/data_getting_started.html), were selected based on the availability of the information needed to separate different C pools: foliage (Cleaf), stems and branches (Cwood), roots (Croot), litter (Clitter), and soil organic matter (SOM; Csoil), as well as simu-lated NPP and fractional coverage of plant functional types (PFTs). Model outputs for different C pools are needed because these pools have significantly different C:P ratios [Wright et al., 2004; Weedon et al., 2009;
Cleveland et al., 2013]. We preprocessed monthly output into annual variables before calculations, and only
annual variables were analyzed in this study. Table S1, Supporting Information summarizes the information collected from the three ESMs and the corresponding PFTs-specific variables.
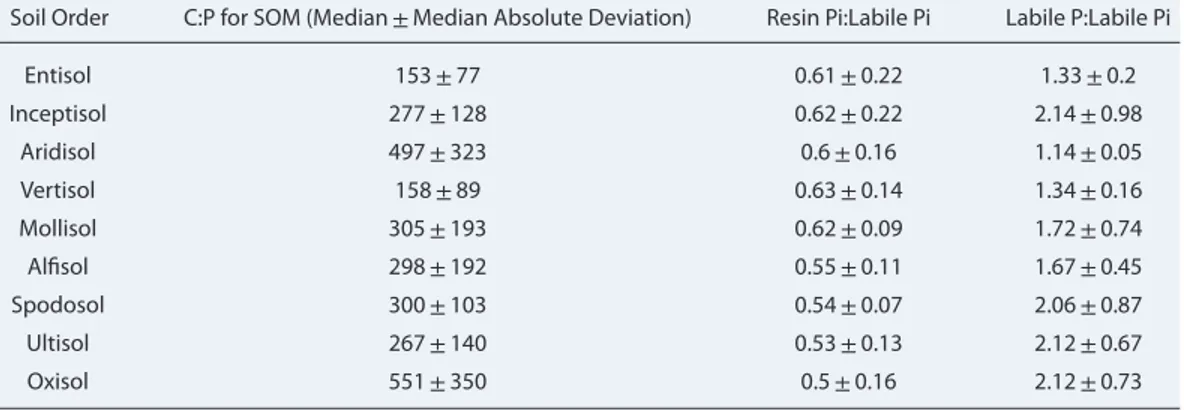
2.2. Suborder-Specific C:P for SOM
We combined the soil organic P (SOP) map from Yang et al. [2013] and the soil organic carbon (SOC) map from the World Soil Information (ISRIC; http://www.isric.org/content/faq-soilgrids) to produce a set of C:P ratios of SOM specific to each soil suborder (see Method S1 in Supporting Information S1; Table 1). Note that SOP was only provided in the top 50 cm soil by Yang et al. [2013]. We thus used the C:P ratio of SOM in the top 50 cm soil to represent the C:P ratio of the whole SOM pool.
2.3. Stoichiometric and Allocation Parameters
We collected 1155 observations (665 plant species) of leaf C and P content from the Plant Trait Database (TRY) [Kattge et al., 2011] to derive leaf C:P ratios for different biome types. Plant species were grouped into
ESM outputs C stock for leaf, wood, root, litter and soil NPP C stock-based additional P demand NPP-based additional P demand NPP-based P deficit C stock-based P deficit
Parameters
Soil P supply
Figure 1. Schematic steps and datasets utilized to derive additional P demand
and P deficit.
seven biome types, for which we obtained the respective median value and range (10th and 90th quantiles) of leaf C:P ratios (Table 2). The ranges of leaf C:P ratios given by TRY database cover the values used in previous stud-ies [Wang et al., 2010; Cleveland et al., 2013] for most biome types except for evergreen needle-leaf forest ENF. Stoichiometric parameters that could not be derived from the TRY database (e.g., C:P ratios of wood, root, and litter) were taken from the literature [McGroddy et al., 2004; Wang et al., 2010]. C allocation parameters, that is, the fraction of NPP allocated to each biomass pool, were provided by
Cleve-land et al. [2013] for each biome, based
on literature data and model results [Gower et al., 2001; Wang et al., 2010]. We used the historical and future land cover maps from each CMIP5 model to derive the annual biome map for each year (Figure 1). We regridded the CMIP5 output into 1∘ × 1∘ spatial resolution fields by nearest neighbor interpolation. As parameterization for different crop types and P fertiliza-tion of croplands are absent or not well represented in CMIP5 models, we simply excluded major cropland areas in our analysis. This led us to exclude 8.7%–12.3% of the total land area for IPSL-CM5A-MR and MIROC-ESM-CHEM, but no exclusion was necessary for BNU-ESM because this model does not have any croplands. Biome-specific stoichiometric parameters from the TRY database and the literature, the NPP allocation parameters from Cleveland et al. [2013] (Table 2), and C:P ratios for SOM for each soil suborder
Table 1. Ratios of Resin Inorganic P (resin Pi) and Labile Inorganic P (Labile Pi), Labile P and Labile Inorganic P for Each
Soil Order Derived From Collection of Soil P Measurements at Depth of 50 cm by Yang et al. [2013].
Soil Order C:P for SOM (Median±Median Absolute Deviation) Resin Pi:Labile Pi Labile P:Labile Pi Entisol 153±77 0.61±0.22 1.33±0.2 Inceptisol 277±128 0.62±0.22 2.14±0.98 Aridisol 497±323 0.6±0.16 1.14±0.05 Vertisol 158±89 0.63±0.14 1.34±0.16 Mollisol 305±193 0.62±0.09 1.72±0.74 Alfisol 298±192 0.55±0.11 1.67±0.45 Spodosol 300±103 0.54±0.07 2.06±0.87 Ultisol 267±140 0.53±0.13 2.12±0.67 Oxisol 551±350 0.5±0.16 2.12±0.73
(see Section 2.2; Table 1) were then used to calculate the additional P demand for each grid cell covered by natural vegetation (Figure 1).
3. Analyses
We first estimated the additional P demand using either the C storage or the NPP approach (Section 3.1). Then we derived four scenarios of plant-available P supplies (Section 3.2). Potential P deficit was estimated as the difference between additional P demand and P supply (Section 3.3). Finally, we estimated the com-patible C stock and NPP limited by potential P deficit (Section 3.4).
3.1. The Additional P Demand to Realize Changes in C Storage or NPP
The additional P demand is defined as the amount of P needed to realize the state of ecosystem C variables in each grid and each year according to each ESM. Here additional means the demand due to increases in carbon storage. The C storage-based additional P demand (ΔPpool) for a given time in the future can be estimated by the difference in the simulated change in C pools at that time with respect to preindustrial values, multiplied by their corresponding C:P ratios as:
ΔPpool,i= m ∑ j=1 ΔCij rij (1)
where ΔCijis the C stock change of pool j for biome i between a future time period and the preindustrial conditions, and rijis the C:P ratio of that pool. m is the number of C pools. The C pools considered are: Cleaf,
Cwood, Croot, Clitter, and Csoil.
The total P demand related to NPP changes (ΔPNPP, total) is calculated by:
ΔPNPP,total,i= m ∑ j=1 ΔNPPij× fij rij (2)
where ΔNPPiis the simulated change of NPP for biome i, and fijthe fraction of NPP allocated to leaf, wood, and root (indexed by j), respectively. Mind, that the total NPP demand can be partly met by the ecosystem recycling of P in contrast to the additional P demand.
The recycling of P in natural ecosystems is controlled by P resorption from leaves prior to litterfall and uptake of mineralized, nonresorbed P from litter and SOM [Schachtman et al., 1998]. To correct ΔPNPP, totalfor the fraction which can be met by recycling, we estimated background P recycling rates during preindustrial times. To do so, we assumed that 100% of the plant uptake of P by NPP was met at that time by resorption and uptake of mineralized, nonresorbed P from litter and SOM during the period from 1900 to 1910; that is, the additional P demand was zero under preindustrial conditions. The NPP-based additional P demand (ΔPNPP) was estimated as the total P demand (ΔPNPP, total) minus changes in recycled P supply from leaf P
Ta b le 2 . St oichiometr ic a nd Allocation P a ramet ers U sed in T his Study Biome E NF EBF D NF DBF M XF SHB GRS Ref e renc es C:P ratios Leaf 656 a(601 – 960) 396 a(199 – 992) 338 (270 – 405) 388 a(192 – 1052) 232 (185 – 278) 393 a(160 – 967) 320 a(165 – 896) W right et al .[2004]; Wa n g et al .[2010] W ood 3125 (2500 – 3750) 1875 (1500 – 2250) 3125 (2500 – 3750) 2187 (1750 – 2625) 2187 (1750 – 2625) 1875 (1500 – 2250) 1875 (1500 – 2250) W eedon et a l. [2009]; Wa n g et al .[2010] Root 975 (780 – 1170) 850 (680 – 1020) 513 (410 – 615) 513 (410 – 615) 513 (410 – 615) 513 (410 – 615) 513 (410 – 615) [W a ng et al ., 2010; W eedon et al ., 2009] Litt er 1218 b(1086 – 1351) 1218 b(1086 – 1351) 1218 b(1086 – 1351) 1218 b(1086 – 1351) 1218 b(1086 – 1351) 1218 b(1086 – 1351) 565 (452 – 678) [McGr oddy et al ., 2004; Wa n g et al ., 2010] b NPP alloca tion Le af 0.43 0.56 0.44 0.49 0.39 0.38 0.56 O lson et a l. [2001]; Wa n g et al ., [2010] W ood 0.34 0.22 0.33 0.33 0.45 0.14 0 O lson et a l. [2001]; Wa n g et al .;2010] Root 0.23 0.22 0.23 0.18 0.16 0.48 0.44 Go w er et a l. [2001]; O lson et al .[2001] Resorption efficienc y 0.52 0.58 0.47 0.46 0.54 0.54 0.57 [Reed et al ., 2012] ENF ,ev er g reen needle – leaf fo re st; E BF ,e v e rg reen br oad-leaf fo re st; D NF ,deciduous needle-leaf fo re st; D BF ,deciduous br oad-leaf fo re st; M XF ,m ix ed fo re st; S HB ,c losed shrublands; GRS, g rass-land; Numbers in p ar entheses indicat e the ranges o f p aramet ers .F o r g rass ,t he litt er C:P w as calculat e d a s foliar C :P divided b y re sor ption efficienc y. Fo r o ther PFT s, litt er C:P ratios w e re fr om McGr oddy et al .[2004] aM e an values fr o m T R Y database ,a nd numbers in p ar entheses ar e for the 10th a nd 90th q uantiles . bM e an value fr om McGr oddy et al .[2004].
resorption (ΔPRSB) and in the NPP uptake of mineralized P (ΔPMR): ΔPNPP,i= b ∑ t=a ( ΔPNPP,total,i− ΔPRSB,i− ΔPMR,i ) (3)
where a and b are the start and end year of the study period, respectively. The change of leaf P resorption available for the increment of NPP of the next year was assumed to be only associated with the leaf ΔNPP component flux, according to:
ΔPRSB,i= ΔNPPi× fleaf,i× RSBi
rleaf,i
(4)
where RSBiis a biome-specific resorption ratio, for which a value of unity corresponds to 100% leaf P resorbed, rleaf,iis the foliar C:P ratio, and fleaf,iis the fraction of NPP allocated to leaf production.
The mineralization of P from SOM and litter is another source of inorganic P (Pi) for NPP uptake. This flux is a net release of P from SOM and litter, which depends on both environmental drivers and biological factors (e.g., plant roots and soil microbes) and can be described as the difference between microbial immobi-lization and gross SOM and litter mineraimmobi-lization. As the net release of Pi by microbial immobiimmobi-lization and mineralization for plant utilization is impossible to be inferred from CMIP5 variables, we used two idealized scenarios to infer this flux (ΔPMR). Scenario 1 (L1) assumes low mineralization; that is, that only P in fallen leaves can be mineralized and support NPP in the following year, while P in wood and root components of litter cannot be used for NPP. This is given by:
ΔPMR,i=ΔNPPi× fleaf,i× ( 1 − RSBi ) rleaf,i (5)
Scenario 2 (L2) assumes a higher future mineralization, that is, that 90% of P in the wood and root litter is recycled in addition to all P in fallen leaves each year. This is given by:
ΔPMR,i= ΔNPPi× fleaf,i× ( 1 − RSBi ) rleaf,i + frac × ΔNPPi× (f wood,i rwood,i +froot,i rroot,i ) (6)
fwood,iand froot,iare the fraction of NPP allocated to wood and root, respectively, and frac is the fraction of P in litter reused in the ecosystems.
To estimate uncertainties on the stock-based P demand, we used a Monte-Carlo approach. Totally 500 sets of suborder-specific C: P ratios for SOM (Figure S10) and 500 sets of biome-specific C:P ratios of litter and plant tissues were generated, the stoichiometry of different pools being assumed independent from the others. To estimate uncertainties on the NPP-based additional P demand, 500 sets of C:P ratios for plant tissues were used.
3.2. Estimating Plant-Available P in Soil and P From Weathering
The availability of different soil P forms to biota is uncertain and depends on the timescale [Johnson et al., 2003]. To account for the large uncertainty in P availability, we constructed four contrasting scenarios. The first scenario (S0) is an extreme case that assumes that plants cannot utilize any form of P in soils and thus need externally supplied P, namely from weathering. In this scenario, available soil P (ASP) is zero. The second scenario (S1) corresponds to a low availability, where ASP is assumed to equal only resin inorganic P (Pi), the most labile form of P according to the measurement method of Hedley et al. [1982]. The third scenario (S2) corresponds to moderate availability, where ASP equals labile Pi (resin Pi + bicarbonate Pi) of the Hedley et al. [1982] method. The fourth scenario (S3) corresponds to a high-availability scenario, where ASP is equaled to the total labile P of the Hedley et al. [1982] method (resin Pi + bicarbonate Pi + bicarbonate Po).
The distribution of total labile Pi in soils provided by Yang and Post [2011] can be directly used for calculating
ASP in scenario S2. To estimate ASP in S1 and S3, we used the total labile Pi estimate provided by Yang and Post [2011], multiplied by observed resin Pi-to-labile Pi ratios, and labile P-to-labile Pi ratios, respectively
To account for changes in P released by chemical weathering (ΔPWTR), we derived the change in weathering P release from the map of present day weathering P from Hartmann et al. [2014], which is from an empirical model considering the dependence of chemical weathering on lithology and runoff. The flux ΔPWTRwas shown to be sensitive to temperature increase [Goll et al., 2014; Hartmann et al., 2014]. Following Goll et al. [2014], we assumed that 100% of additionally released P by weathering is available for ecosystems, thereby omitting losses from leaching, erosion, soil P adsorption or occlusion. ΔPWTRflux maps for different ESMs and climate scenarios (RCP2.6 and RCP8.5) was obtained based on the Hartmann et al. [2014] maps and a relationship between air temperature and global weathering rate whereby P weathering increases by 9% per 1∘C [Goll et al., 2014]. Changes in the P concentration in primary minerals are not accounted for. P inputs via atmospheric deposition are not included in the calculation due to lack of historical and future projections of deposition rates. Present-day deposition inputs are of comparable magnitude to those from weathering [Newman, 1995; Mahowald et al., 2008; Wang et al., 2015]. Overall, input rates by weathering and deposition are small compared to overall soil P availability [Newman, 1995; Peñuelas et al., 2013].
3.3. Estimating Soil Potential P Deficit
We estimated the potential P deficit (Pdeficit) as the difference between the additional P demand calculated by the C storage or by the NPP based approach (Section 3.1), and the P supply from ASP and weathering (Section 3.2), according to:
Pdeficit,i= ΔPpool,i− ASP − ΔPWTR (7)
3.4. Estimating Compatible C Stock and NPP According to Potential P Deficit
We reconstructed changes in C stock and NPP which are consistent with different scenarios of ASP, called here compatible C stock (Cr) and compatible-NPP (NPPr) for each grid-cell. For a given RCP and ASP scenario, we first diagnosed Pdeficitat grid-scale during 1900–2100. For grid cells with no P deficit, the compatible C stocks and compatible NPP equals the original values simulated by ESMs (CESM). For grid cells with P deficit,
Cris calculated as the difference between CESMand the change in C stocks which cannot be realized because of insufficient ASP (C+hereafter):
Cr= CESM− ΔC+ (8) ΔC+=(ΔPpool,i− ΔPWTR)× m ∑ j=1 𝜀i,j× ri,j (9)
where ΔPpool,iis the additional P demand by the C stock-based approach, ΔPWTRis the change of weathering compared to 1900–1910,𝜀i,jare the proportions of Csoil, Clitter, Cleaf, Cwood, and Croot(indexed by j) in total land C for biome i, ri,jare the C:P ratios for corresponding C stock j for biome i.
NPPris calculated as the NPP simulated by ESMs (NPPESMhereafter) minus NPP that cannot be realized because of insufficient ASP (NPP+hereafter):
NPPr= NPPESM− NPP+ (10) NPP+= 2100 ∑ y=year_deficit ([ ΔPNPP,total,i− ΔP∗RSB,i− ΔP∗MR,i− ΔPWTR− Pbuffer,y ] × m ∑ j=1 fi,j× ri,j ) (11) Pbuffer,y= { 0, y < year_deficit ΔPbuffer,y−1+ ΔPWTR− ΔP∗ NPP,i, y ≥ year_deficit (12)
where ΔPNPP,total,i indicates the total P demand for year y compared to 1900–1910 by the NPP-based approach (2), ΔP∗
RSB,i and ΔP∗MR,irefer to the P resorption and mineralization, respectively, using NPPrfor year y − 1 following the (4)–(6). ΔP∗
NPP,iis the additional P demand using NPPrfor year y (2), ΔPWTRrefers to the change in weathering P for year y compared to 1900–1910. Pbuffer,istands for the annual variability of available P due to the interannual variability of NPP, fi,jfor the C allocations to leaf, root, and wood pools (indexed by j) for biome i, ri,jfor the C:P ratios for the corresponding C stock for biome i.
4. Results
4.1. Additional P Demand
4.1.1. C-Pool-Based Additional P Demand
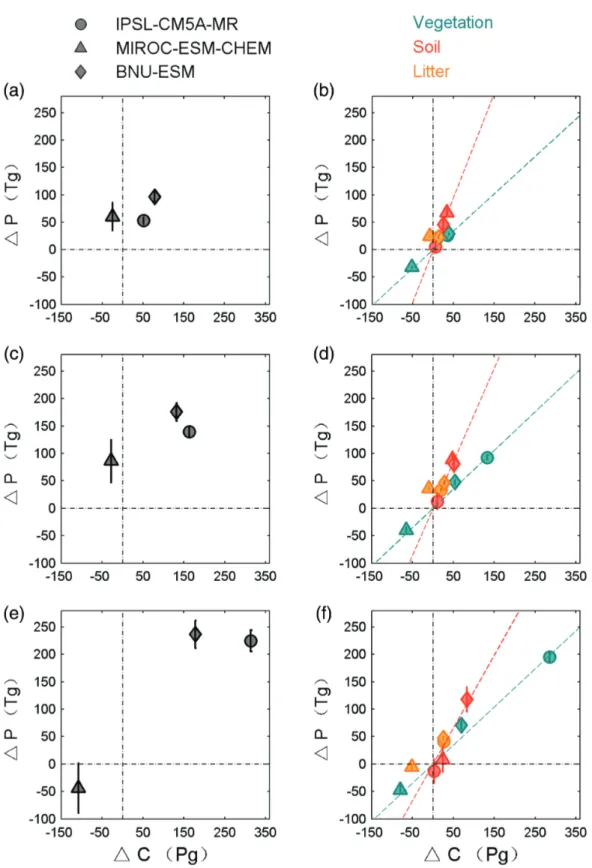
During the period 1900–2005, two models (IPSL-CM5A-MR and BNU-ESM) simulate an increase in terrestrial C storage by 55 and 81 Pg C, respectively (Figure 2a). MIROC-ESM-CHEM simulates a reduction in terrestrial C storage of 25 Pg C. Globally, a demand (ΔPpool) of 36–114 Tg P (including the variances between models and uncertainties of C:P ratios for SOM and plant tissues) is diagnosed as needed to sustain the modeled changes in C stocks between 1900 and 2005 (Figure 2a). In general, ΔPpoolincreases over time, tracking the monotonic increase of global C stock (Figures 2a, 2c, and 2e). However, ΔPpooldecreases between 2050 and 2100 in MIROC-ESM-CHEM under the RCP8.5 scenario (Figures 2c and 2e), reflecting a climate-driven decrease in global C stock. As shown by Figures 2b, 2d, and 2f the differences between ESMs for the total additional P demand are mainly explained by their different changes in soil C and vegetation C. By 2100, the inferred additional P demand ranges from −89 to 262 Tg P (Figure 2e). Compared to RCP8.5, there is a much lower estimate of additional P demand by RCP2.6 (−31 to 193 Tg P; Figure S1).
Although the global total additional P demand under RCP8.5 is much larger than that under RCP2.6, the spatial distributions of additional P demand between those RCPs are similar (Figures 4a and S3a). Three models simulate the same sign of change in additional P demand in most tropical regions, but coefficients of variations (ratio of standard variation to mean value between ESMs) in most tropical regions were higher than one (Figures S4 and S5).
4.1.2. Additional P Demand Diagnosed From NPP
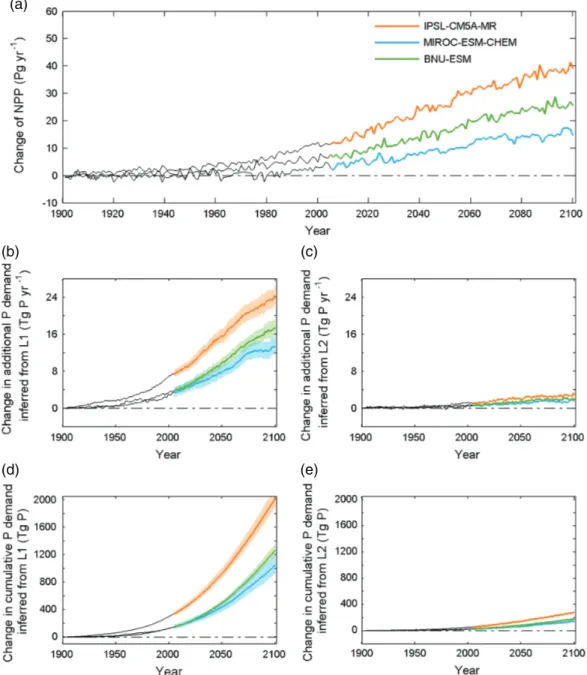
Under RCP8.5, all models simulate an increase of global NPP for natural ecosystems, ranging from 14.5 Pg C yr−1in MIROC-ESM-CHEM to 38.9 Pg C yr−1for IPSL-CM5A-MR during the 2090s relative to the reference period of the 1900s (Figure 3a). As a result of increasing NPP, the annual additional NPP-P demand in 2090s is higher than in the 1900s by 11.9–26.4 Tg P yr−1(L1 scenario; range from both ESMs and uncertain C:P ratios; Figure 3b).
In the L1 scenario, the cumulative additional NPP-P demand diagnosed in the RCP8.5 ranges from 924 to 2110 Tg P (Figure 3d). In the L2 scenario, which assumes a higher P recycling in ecosystems, the cumulative additional P demand (ΔPNPP) is found to be six to seven times lower than in the L1 scenario, where only leaf P was assumed to be recycled for NPP (Figure 3e). Yet, the spread of ΔPNPP between the three ESMs is smaller than that between the L1 and the L2 recycling scenarios (Figures 3b–3e).
Both under the L1 and L2 assumptions for recycling, there is an increase in ΔPNPPin over 90% pixels by 2100 (Figures 4b and 4c). However, significant differences among the three ESMs lead to large uncertainty, especially in tropical regions (Figures S5d–S5f ). In regions north of 30∘N, more than 96% of the grid cells have a positive additional P demand in all the three ESMs (Figures S5d–S5f ).
In the RCP2.6 scenario, the increase in global NPP relative to preindustrial levels reaches a maximum value of 5.6–14.8 Pg C yr−1by around 2050 and then gradually decreases to 6.6–12.3 Pg C yr−1by 2100 (Figure S2a). In accordance to the evolution of NPP, the diagnosed value of the annual additional NPP-P demand peaks in the 2050s (Figures S2b and S2c). Compared to RCP8.5, the cumulative additional NPP-P demand by RCP2.6 is diagnosed to be lower (648–1606 Tg P in L1 scenario; Figure S2d).
4.2. Total Additional P Available in Soils
Globally, ASP was estimated at 1.2 Pg P for S1, 2.2 Pg P for S2 and 3.8 Pg P for S3, respectively. Compared to the amount of P already present in soils as labile form, the P supplied by increased weathering (ΔPWTR) represents a small net addition of 0.1 Tg P for RCP 2.6, and 0.3–0.4 Tg P for RCP 8.5, respectively. ΔPWTRis ubiquitously lower than ASP, in S1, S2, and S3. As shown by the spatial patterns of ASP (Figures 5a–5c), the lowest supply is found in regions with highly weathered soils, like the Amazon and Central Africa. Higher supply values (>20 g P m−2for S1,>30 g P m−2for S2, and>60 g P m−2for S3) are found in regions with slightly or intermediately weathered soils, such as along the west coasts of South America and North Amer-ica, eastern Australia, and in north China.
Figure 2. Additional P demand for changes in total terrestrial carbon stocks (a, c, and e) and each carbon pool (b, d, and f ) under RCP8.5
estimated by the three CMIP5 models from 1900 to 2005 (a, b), 2050 (c, d), and 2100 (e, f ), respectively. Changes of P demand for soil, vegetation, and litter pools are discriminated by red, green, and orange, respectively. Error bars shown in total and soil P demand indicate the variations estimated by uncertain C:P ratios in soil organic matters, litter, and plant tissues.
(a)
(b) (c)
(d) (e)
Figure 3. Changes of NPP (a), annual additional P demand (b for L1, c for L2; running average with 15-years window) and cumulative
additional P demand (d for L1, e for L2) relative to 1900–1910 under RCP8.5 derived from three models. Shading indicates the variations of P demand (standard deviation) considering the uncertainty of plant tissue C:P ratios.
4.3. Potential P Deficit
Under the medium scenario of ASP (S2) and RCP8.5, the global potential P deficit by 2100 is estimated at 27.2 ± 26.7 Tg P (mean value ± standard deviation; including the variances between models and uncertain-ties of C:P for SOM and plant tissues; Table S2) with the C stock-based approach (positive values mean P deficit). About 36%–45% of the total uncertainty of global P deficit is contributed by uncertain C:P of SOM. The P deficit under S2 diagnosed with the NPP-based approach depends strongly on the assumed mineralization of litter involved in recycling P for NPP. For the L1 scenario of low recycling of P by plants (NPP_L1 hereafter), a global P deficit of 262.7 ± 260.6 Tg P is estimated. The P deficit of NPP_L1 is an order of magnitude higher than in the C stock approach because of both higher P deficits at the grid-cell level and more areas with P deficit (Figures 6a and 6b). By contrast, for the L2 scenario with a high rate of P recy-cling in the ecosystem (NPP_L2 hereafter), there are few locations showing a P deficit by 2100 (Figure 6c;
Table S2). Therefore, the P deficit in the NPP-based approach depends critically on the assumed recycling of P in litter.
The global distributions of P deficit from the C stock-based and the NPP_L1 approaches are shown in Figures 6a and 6b. P deficits systematically occur in tropical regions, owing to the higher additional P demand and lower ASP than in other regions. Under the medium scenario of ASP (S2), NPP_L1 approach predicts that tropical regions encounter P deficit by the year 1970 (Figure S8b). By 2100, 10%–45% of the pixels in tropical regions exhibited a slight P deficit (Figure S8b). A lower percentage (0%–13%) of the tropical pixels with P deficit by 2100 was simulated with the C stock-based approach (Figure S8a).
Figure 4. Spatial patterns of mean additional P demand across three models
based on the changes of terrestrial pools (a) and NPP (b, c for L1; e, f for L2) from 1900 to 2100 for RCP 8.5.
We found that the different assump-tions for ASP are the major source of uncertainty in our estimates of future P deficit, together with assumptions for the mineralization of litter with the NPP-based approach (Figures 7 and 8, Table S2). Under the extreme sce-nario of no ASP S0, both C stock-based and NPP-based P deficits emerge in most parts of the globe before the year 1925. By 2100, the global total P deficit reaches up to 63.9–835.3 Tg P (mean across C stock-based, NPP_L1 and NPP_L2 approaches), the most severe P deficits occurring in Central Africa and tropical Asia. Under the S1
ASP scenario, both the stock-based and
NPP-based P deficits start to emerge in the 1950s–1960s across tropical regions. The global total P deficits rise up to 3.6–423.8 Tg P by 2100, with the highest deficits found in Central Africa, tropical, and temperate Asia and tem-perate South America. Under assump-tions of higher ASP like in S2 and S3, we diagnosed that P deficits emerge later (Figure S8), and are lower glob-ally and are close to zero by 2100 in a number of regions (Figure 8). Under S2, the P deficit of tropical regions appears about 20 years later than in S1, and the cumulative P deficit by 2100 is compa-rable to the one of S1 in the most lim-ited regions. However, under S3, there is almost no P deficit, except in few tropical grid cells by 2100.
Compared to that of RCP8.5, the poten-tial P deficit estimated under RCP2.6 is much lower for both C stock and NPP approaches in terms of global and regional total P deficit independent of the ASP scenario (Table S2, Figure S7). The spatial distributions of potential P deficit between those RCPs are similar (Figures 6 and S6).
4.4. Reduced Future C Stocks and NPP by P Limitation
Considering the soil P availability scenarios S1, 14–78 Pg C (8%–24%; range between three ESMs) of global land C storage changes cannot be realized for the RCP8.5 scenario (Table S3, Figure S9). Under a lower soil
Figure 5. External P supply from available soil P and rock weathering. Spatial patterns of available soil P (ASP) with three different assumptions: resin inorganic P (a), labile inorganic P
(b) and labile inorganic and organic P (c), and estimated changes in weathering P-release (d) under RCP8.5 from 1900 to 2100 associated with mean air temperature across the three CMIP5 models.
availability scenario S2, 3–46 Pg (0%–14%) of global land C storage changes are constrained by P limitation. The reduction of C storage due to P limitation under ASP scenario S1 and S2 is higher in tropical regions (Table S3). The S3 scenario with larger soil P translates into hardly any reduction in global land C storage by 2100, that is, less than 5% compared to no limitation.
NPP from the simulations of ESMs is more limited by P in scenario L1 than in scenario L2 (Figure S9, Table S4). Under the low soil availability assumptions made in S1, the NPP-based P deficit in L2 remains very small, but NPP in_L1 becomes reduced by 35%–57% (range between ESMs under RCP8.5). Here again, it is in the tropical regions that NPP is more limited in L1 (Table S4).
5. Discussion
5.1. Comparison of C Stock-Based P Demand With Other Studies
Peñuelas et al. [2013] used globally uniform stoichiometric ratios for vegetation and soil to derive a
sim-ple estimate of the additional P demand from both the CMIP5 and C4MIP-cousim-pled carbon cycle-climate models. We refined their approach here by using biome-specific C:P ratios for different C pools. With the C stock-based approach, we estimated the increase in global additional P demand to be −89 to 262 Tg P (range between ESMs and RCPs, including uncertainties of the C:P ratios of SOM) during the period 1900–2100, which falls in the ranges of previous estimations (−0.9 to 4.3 Pg P for RCP 2.6; −1.7 to 6.5 Pg P for RCP 8.5 from 2000 to 2099) for the CMIP5 ESMs by Peñuelas et al. [2013]. The stoichiometry of SOM thus strongly determines the P demand in the C stock-based approach. Peñuelas et al. [2013] used a global mean C:P of
SOM of 50 (humic substances as in Lal [2008]). In this study, we used a median C:P of SOM ranging from 153 to 551 across the nine soil orders (Table 1; Figure S10) based on global SOC and SOP databases (see Section 3.2 and Method S1). There are few values of C:P of SOM reported in previous studies, and generally only the C:P ratios for total soil pool and microbial biomass were reported. For instance, Xu et al. [2013] pro-vided the C:P ratios for total soil pool (Ctot:Ptot = 2–895) and for microbial biomass (Cmic:Pmic = 9–106) per biome. To represent the uncertainty of the C:P of SOM, we applied a Monte-Carlo method to derive the average and variability of the C:P ratio of SOM for each soil order (Table 1). Our estimates of C:P of SOM are between the C:P of microbial biomass and the C:P of total soil pool synthesized by Xu et al. [2013]. In addition, in this study, we used only a subset of the CMIP5 ESMs which have changes of soil C stocks lower than 100 Pg C, whereas Peñuelas et al. [2013] (Figure S11) used all CMIP5 models. The three ESMs used in this study simulated moderate changes of soil and biomass C stocks compared to the ensemble of all ESMs. The combination of lower change in SOM and higher C:P of SOM together lead to a more narrow range than
Peñuelas et al. [2013].
The uncertainty of the P demand diagnosed from the C stock-based approach depends not only on the uncertain stoichiometry of SOM, but also on the stoichiometry of plant tissues. A globally uniform C:P ratio for vegetation biomass of 3454 was used to estimate the P demand by Peñuelas et al. [2013]. However, plant C:P ratios vary widely across different biome types as well as within biomes, especially in leaves [Reich
and Oleksyn, 2004; Kattge et al., 2011]. These uncertainties in plant C:P ratios propagate into the
estima-tion of P demand, and were accounted for in our calculaestima-tion by using biome-specific C:P ratios for different vegetation pools (leaf, wood, and root) based on the TRY database and the literature (Table 2). More com-prehensive datasets on ecosystem stoichiometry will help to further reduce the uncertainty in the estimated P demand.
5.2. Reconciling Additional P Demand Derived From C Stock- and NPP-Based Approaches
In contrast to the C stock-based approach, the NPP-based approach takes into account the annual ecosys-tem P recycling fluxes (e.g., leaf P resorption and mineralization of litter). It is uncertain whether the resorp-tion and mineralizaresorp-tion will increase and keep pace with the producresorp-tion of new biomass, resulting in a mismatch between P demand and P availability. By contrast to the NPP-based approach, the C stock-based approach only estimates the additional P demand to support the increased C stock between the start and the end of the study period. The underlying assumption of the C stock approach is that the rate of P recy-cling within an ecosystem can keep pace with the increasing NPP. Thus, C storage can be only realized as long as there is enough external P supply available for the built up of new organic matter. As the C stock approach does not consider the potentially insufficient turnover of P, it is prone to produce a lower-bound estimation of the additional P demand.
Spatially explicit estimates of the mean NPP-based additional P demand are shown in Figures 4b and 4c. Both the L1 and L2 scenarios show an increase in the additional NPP-P demand for more than 90% of the grid cells by 2100. These results are very different from the C stock-based simulations that give equal shares of increased and decreased P demand (Figure 4a). MIROC-ESM-CHEM simulates decreasing C stock but increasing NPP in tropical regions by 2100. This explains the opposite sign of additional P demand obtained between the C stock- and the NPP-based approaches over those regions in these two models.
In regions where P demand increases by both approaches, the additional P demand from NPP_L1 is higher, while the P demand from NPP_L2 is lower, than the demand diagnosed by the C stock-based approach (Figure 4). This illustrates that the accessibility of P in litter is a major source of uncertainty in the NPP-based P demand. The sensitivity of P demand to the turnover efficiency of P in fresh litter (ΔL hereafter) is particularly high in regions where the P demand of NPP is relatively high. Unfortunately, a range of globally uniform fixed turnover efficiencies like applied here can only be a rough approxima-tion of the real world in which turnover depends on climate [Davidson and Janssens, 2006], litter quality [Knops et al., 2010], physicochemical soil properties [Doetterl et al., 2015], decomposer-consumer interac-tions [Hättenschwiler and Gasser, 2005; Cherif and Loreau, 2009], and microbial dynamics [Moorhead and
5.3. Plant Available P in Soil and Its Effect on P Deficit
Cross and Schlesinger [1995] defined “labile P” as the sum of resin-extractable P, bicarbonate-extractable
inorganic P and organic P (following the Hedley sequential extraction method; Hedley et al. [1982]). Labile P is considered to be readily available to plants at daily to decadal timescale (this corresponds to the S3 scenario in this study) as shown by short-term soil exhaustion experiments [e.g., Guo and Yost, 1999] and by long-term P fertilization experiments [e.g., Blake et al., 2003]. The global amount of labile soil P was estimated at 3.6 ± 3 Pg P by Yang et al. [2013], who using the database of parent material and soil P
Figure 6. Spatial patterns of mean P deficit (g P m−2) across the three CMIP5 models by 2100 under RCP8.5 and the medium soil P availability (labile inorganic P) scenario. Note that negative values of the P deficit mean excess of P.
Global/regional P deficits are calculated by summing only the values of grid points that have a deficit. (a) Global patterns of P deficit derived from carbon pool, and (b) and (c) the results from the NPP-based approach with different litter mineralization scenarios (b for L1; c for L2) with black points indicating coefficient of variation (ratios of standard deviation and mean values of P deficit)<25%.
measurements. There are two esti-mates of global labile and sorbed P (sorbed P in models being included into our definition of labile P in this study) from the models of Wang et al. [2010] and Goll et al. [2012], respec-tively. Modeled labile P ranges from 2.3 Pg P in Goll et al. [2012] to 3.2 Pg P in
Wang et al. [2010]. Our estimation of 3.8
Pg P for S3 and 2.2 Pg P for S2, exclud-ing cropland soils, is thus close to the estimates both of Yang et al. [2013] and
Goll et al. [2012]. Different definitions
or approaches to calculate ASP have resulted in a large range of estimates in previous studies [Wang et al., 2010;
Goll et al., 2012; Yang et al., 2013], which
is the major source of uncertainty of the magnitude of P limitation on future C sink.
Johnson et al. [2003] found that the
amount of labile P is much greater than the vegetation demand and thus suggested to take labile P as the estimate of total bioavailable soil P (plant- and microbe-available). Unfor-tunately, there are few measurements of the microbial immobilization P fluxes as well as of the real amount that plant can access by their roots, which causes large uncertainties in estimating plant-available P as well as plant P demand. On short time scales, roots produce exudates (e.g., car-boxylates) phosphatase-like enzymes to release P absorbed on mineral surfaces or held in organic matter, respectively, or associate with myc-orrhizal fungi to take up additional P and thus alleviate P deficiency, yet at a C cost for them [Chambers and
Silver, 2004; Hinsinger et al., 2015].
The accessibility of the different soil P fractions on decadal to centurial timescale is less clear due to the lack of clear characterization of sorption strength for P in clay, and iron and aluminum oxides.
Figure 7. Global P deficit by 2050 and 2100 under RCP8.5 derived from C stock approach (a–c), NPP_L1 approach (d–f ), and NPP_L2 approach (g–i) for each ESM with four scenarios
of available soil P (S0–S3). Panels in the first, second and third row indicate IPSL-CM5A-MR, MIROC-ESM-CHEM, and BNU-ESM, respectively.
Wieder et al. [2015] considered “new P” (dust deposition and P release by weathering) which are very minor
fluxes compared to recycling fluxes and minor compared to the labile stocks, and thus pessimistically estimated P availability [Brovkin and Goll, 2015]. Peñuelas et al. [2013] used two extreme scenarios of P availability, which correspond to scenarios S0 and S3 of this study. We here introduced two additional intermediate scenarios for future soil P availability (resin Pi only for S1 and labile Pi for S2). Although the real-world ASP is still unknown, those four scenarios together provide a range that can cover the possibilities of soil P supply. Given the range in ASP between S0 and S3 and even between S1 and S2, we diagnosed very different P deficit values. Large P deficit emerged as early as the beginning of the 20th century in most tropical and temperate regions in S0 and S1, whereas those deficits remained very weak during the 20th and 21st centuries in S3. This shows that understanding P immobilization and mineralization, as well as the amount of ASP for plants, in particular the interactions with micro-bial processes and plant uptake are critical for assessing the effect of P availability on the future land C balance. Condron and Newman [2011] stressed that our ability to quantify the actual availability to plants (or other living organisms) of the various P fractions derived from soil P fractionation schemes in different ecological contexts was still in its infancy. In addition, long-term P fertilizer experiments have been showing that limitation of plant productivity can occur long before the most available P pool (e.g.,
Figure 8. Scatter plots showing total cumulative soil P deficit (Tg P) by 2100 for 12 land regions as estimated by different scenarios of available soil P (S0-S3) under RCP8.5. Regional P
deficit is given as the sum of P deficit from grids with positive deficit. Soil P deficit derived from carbon pool and two scenarios in the NPP-based approach (NPP_L1 and NPP_L2) are discriminated by grey, blue, and orange respectively. Markers and error bars indicate the mean values and standard deviations among estimates from three ESMs and uncertain C:P ratios for plant tissues, litter, and SOM. The divisions of land regions are shown in the map.
bicarbonate-Pi or resin-Pi pools) is fully depleted, and the threshold value for P limitation varies among crops [e.g., Colomb et al., 2007]. At this point of view, both S1 and S2 are meaningful scenarios worth consideration.
It is difficult to assess the realism of each of the four scenarios, because the available fraction of soil P can change with changing environmental conditions or biological conditions [Buendía et al., 2014;
Hasegawa et al., 2015]. Inorganic forms of P can become available by soil acidification via increased
soil respiration and increased excretion of acids and chelating agents. This will enhance the release of P from primary minerals as well as the deocclusion of P. Elevated CO2, on the one hand, can increase soil microbial communities and thus their demand for soil P [Liu et al., 2012]. On the other hand, increasing availability of carbohydrates under elevated CO2 can lead to enhanced P recycling and redistribution of P from unavailable to available forms [Guenet et al., 2012; Buendía et al., 2014; Hasegawa
et al., 2015]. Hereby microbial phosphatase activity [Guenet et al., 2012], mycorrhizal hyphae, and more
generally P-solubilizing microorganisms play an important role. Moreover, losses of P via leaching, erosion, and soil P adsorption and occlusion are all sensitive to climatic and environmental changes. Losses of P from the ecosystem by leaching and soil erosion can be reduced by resorption of P prior to leaf shedding [McGroddy et al., 2004], changes in root growth and morphology [Niu et al., 2013]. Ignorance of changes in P losses in this study could induce uncertainty in estimates of P availability and P deficit.
Under our assumption that all ASP can be locked into organic matter (S1–S3), globally soil resin Pi, labile Pi, and labile P are all substantially depleted in 2100 compared to the those of preindustrial period (Figure S12). A higher relative depletion of ASP (more than 60%) is found in tropical regions, especially in tropical forests in central Amazonia where available resin Pi and labile Pi are fully depleted and thus cannot meet the P demand for increasing C stock and NPP (Figure S12).
5.4. Reduced Future C Sink
Our estimates of reduced C storage by phosphorus limitation are within the range of the previous esti-mates based on model simulations considering explicitly nutrient limitation. Goll et al. [2012] estimated that the increase of land C stock that considered C and P interactions during the period 1860–2100 was 16% lower than in simulations assuming unlimited P availability under the Special Report on Emissions Scenar-ios A1B scenario. Zhang et al. [2014] reported that the C accumulated on land during the period 2006–2100 is reduced by 37% due to N limitation or 63%–68% due to both N and P limitations, as compared to C-only simulation in RCP2.6 and RCP8.5. Wieder et al. [2015] reported that the increase of C stock is reduced by 193% due to N limitation or 225% due to both N and P limitations. Comparing the additional P demand by Peñuelas et al. [2013] to the P supply scenario S1 in our study, an increment of 0–5.3 Pg C (0%–82%) in carbon stock predicted by CMIP5 models cannot be realized by 2090s. Compared with the reduction in land C storage due to P limitation found in this study (from 0 to 181 Pg C in RCP2.6 and from 0 to 264 Pg C in RCP8.5), the reduction to N limitation diagnosed using a stock-based approach from CMIP5 models by Zaehle et al. [2015], was equally uncertain but of larger magnitude (69–252 Pg C for RCP2.6; 57–323 Pg C for RCP8.5; calculated from 1860 to 2100). However, it is the regional colimitation by the two nutrients that determines future carbon storage. Our study uses only a subset of the models analyzed by Zaehle et al. [2015], which hampers a direct comparison. In general, it seems likely that ESM which do not account for nutrient availability are prone to overestimate increases in NPP and carbon storage, but the extent to which these models are biased is highly uncertain.
5.5. Limitations
We presented a comprehensive analysis toward estimating P demand and P deficit from CMIP5 projections, taking into account various sources of uncertainty related to ecosystem stoichiometry, ecosystem P recy-cling, and soil P availability. Nevertheless, there are some sources of uncertainty that were not taken into account in this study. First, we omitted the interactions between N and P, which will lead to an overesti-mation of P uptake where there is N limitation [Wieder et al., 2015]. So both approaches for P demand are prone to overestimate the P demand and thus also P deficit. Second, we neglected changes in P deposition and erosion/leaching losses, which would have an impact on the P balance and therefore soil available P of ecosystem, especially in tropical regions [Parton et al., 2005], but appropriate datasets are currently lacking. Third, our analyses showed that projections of additional P demand are hampered by the large uncertainty in the stoichiometry of SOM as well as assumptions about the time scale at which P in litter becomes acces-sible to biota again. Differences in time scale between the C and P cycles, as well as the wide range of time scales—from minutes (sorption) to millions of year (weathering)—at which the P processes operate, can-not be resolved in the bookkeeping approach and this represents a major shortcoming of our technique. Fourth, changes in the processes that affect the ecosystem-level efficiencies of use, recycling, and retention of P cannot be resolved either; examples are changes in microbial and mycorrhizal communities, soil pH, soil enzyme activities, plant communities, and tissue stoichiometry [Reed et al., 2012].
We here investigate in more detail the role of stoichiometric changes for the estimation of P demand. Ecosystem-level manipulation experiments have shown that warming, elevated atmospheric CO2, and N and P fertilization can drive stoichiometric changes [Elser et al., 2010; Sistla and Schimel, 2012; Yuan and
Chen, 2015]. For example, CO2and warming can increase the C:P ratio of ecosystems, while P fertilization was shown to decrease the C:P ratio in field experiments by Yuan and Chen [2015]. By assuming as a sensi-tivity test that the vegetation C:P ratios increase linearly with time after 2005 (9% by 2100; Goll et al. [2012]), we recalculated the additional P demand. The C stock-based additional P demand with this flexible vegeta-tion C:P ratio test is 26%–40% lower than that when assuming constant vegetavegeta-tion C:P ratios (Table S5). The NPP-based additional P demand with the same assumption about flexible vegetation C:P ratios is 12%–14% lower than that with constant C:P ratios (Figure S13). Thus, to some extent, flexible vegetation C:P ratios for different plant C pools can buffer the P limitation, and influence the P demand. How flexible the ecosystem
stoichiometry actually is in the context of global change remains a key uncertainty for the role of P in con-trolling the land C cycle. Uncertainties on these processes could be addressed by manipulation experiments and more field measurements in the future, in particular in tropical forests.
Finally, shortcomings of C data from ESMs itself affect diagnosed P demand and deficit. Because ESMs did not separately report changes in these components of NPP, we assumed time-invariant NPP allocation to leaves, roots and wood, and fixed C:P ratios for plant tissues and SOM. Alterations of shoot-root ratios with nutrient availability, a well-known adaptation of plants to nutrient stress [Hermans et al., 2006], were not included in our analyses because the majority of ESMs did not report changes in the components of NPP. To explore the effects of changed NPP allocation in the NPP-based approach, we compared the additional P demand by using outputs of NPP allocated to leaf, wood, and root by IPSL-CM5A-MR to that derived from the constant allocation fractions in this study. We found that cumulative additional P demand by constant allocation fractions is 46% lower than that from modeled allocation fractions (Figure S14), which indicates that the uncertain allocation fractions can lead to large uncertainty in predicting P demand and ultimately P deficit. The allocation schemes of ESM do not consider the influence of nutrient availability, for example, on the root to shoot ratio, which potentially can lead to biases when nutrient availability is low [Poorter et al., 2012].
6. Conclusions
We presented a comprehensive analysis toward estimating P demand and P deficit from CMIP5 projections, taking into account various sources of uncertainty related to ecosystem stoichiometry, ecosystem P recy-cling, and soil P availability. The C stock-based additional P demand, which does not resolve ecosystem P recycling, in natural ecosystem was estimated at −19 to 171 Tg P and −22 to 243 Tg P for the RCP2.6 and RCP8.5, respectively. The NPP-based additional P demand, which resolves ecosystem P recycling, was esti-mated at 708–1409 Tg P for RCP2.6 and 1014–2010 Tg P for RCP8.5 under L1 scenario (low recycling of P by plants), and 93–176 Tg P for RCP2.6 and 136–277 Tg P for RCP8.5 under L2 scenario (high recycling of P by plants). The NPP-based approach results in P demands which are either comparable or much larger than the ones derived from the C stock-based approach depending on the assumption about the recycling efficiency of P. The absence of constraints on the recycling efficiency of P hampers the applicability of the NPP-based approach.
We observed larger differences among models than between the two RCP scenarios for both the C stock-and the NPP-based approaches, indicating the importance of the fate of the C taken up (turnover, allo-cation) for the occurrence of nutrient limitation. The comparison of the two mineralization scenarios (L1 an L2) indicated that the assumption about ecosystem recycling efficiency of P can cause considerable uncertainty (∼150%) in the P demand, severely hampering the applicability of the NPP-based approach. In general, uncertainties of estimating P demand and deficit are very large due to the uncertain stoichiometric parameters, especially due to C:P of SOM, implying that more measurements are needed for increasing the reliability of modeling and projections.
Independent of the approach to diagnose the P demand, the P deficit critically depends on assumptions about soil P availability. Soil P availability per se is difficult to derive from Hedley fraction soil P measure-ments. Additionally, the fate of the availability of soil P on a centennial timescale is controlled by processes that cannot be resolved in this approach (phosphatase activity and the resulting mineralization of organic P, complexing agents such as carboxylates and the resulting desorption of P adsorbed onto soil minerals). Thus better constrains on soil P availability are needed to decrease the uncertainty about future P deficits and feedbacks on the terrestrial C cycle. For this purpose and in order to evaluate the potential fate of soil P availability over the coming decades, long-term ecosystem manipulation experiments and monitoring sites should be set up in a broad range of regions and ecosystems of the world, including the tropics.
Overall, we found that diagnosing the P deficit from simulation models has a very large uncertainty, mainly because of the uncertain parameterization and underlying assumptions of soil P availability as shown in this study. More empirical data are needed to constrain and understand P availability and the stoichiometry of soil organic matter and plant tissues, as well as dynamics of ASP pools related to the gross and net P mineralization. Yet, more models incorporating the P cycle and its interactions with the cycles of C and N have to be developed. Considering all of those shortcomings of bookkeeping approaches, process-based
Acknowledgments
This work was supported by the European Research Council Syn-ergy project SyG-2013-610028 IMBALANCE-P. Xiaojuan Yang was supported by the Accelerated Climate Modeling for Energy (ACME) project, funded by the U.S. Department of Energy, Office of Science, Office of Biological and Environmental Research. The study has been supported by the TRY initiative on plant traits (http:// www.try-db.org). The TRY initiative and database is hosted, developed and maintained by J. Kattge and G. Boenisch (Max Planck Institute for Biogeochemistry, Jena, Germany). TRY is currently supported by DIVER-SITAS/Future Earth and the German Centre for Integrative Biodiversity Research (iDiv) Halle-Jena-Leipzig. The source data used in this study can be available by the links in Data and Material and Text S1. The complete datasets of global gridded soil and vegetation C:P ratios can be requested from the corresponding author.
models are needed to better represent P processes and constraint future P deficit. Until then the effect of P availability on the land C sink will remain elusive.
References
Blake, L., A. E. Johnston, P. R. Poulton, and K. W. T. Goulding (2003), Changes in soil phosphorus fractions following positive and negative phosphorus balances for long periods, Plant Soil, 254(2), 245–261. https://doi.org/10.1023/a:1025544817872.
Brovkin, V., and D. Goll (2015), Land unlikely to become large carbon source, Nat. Geosci., 8(12), 893.
Buendía, C., S. Arens, T. Hickler, S. I. Higgins, P. Porada, and A. Kleidon (2014), On the potential vegetation feedbacks that enhance phosphorus availability–Insights from a process-based model linking geological and ecological timescales, Biogeosciences, 11, 3661–3683.
Chambers, J. Q., and W. L. Silver (2004), Some aspects of ecophysiological and biogeochemical responses of tropical forests to atmospheric change, Philos. Trans. R. Soc. B, 359(1443), 463–476.
Cherif, M., and M. Loreau (2009), When microbes and consumers determine the limiting nutrient of autotrophs: A theoretical analysis,
Philos. Trans. R. Soc. B, 276(1656), 487–497.
Cleveland, C. C., B. Z. Houlton, W. K. Smith, A. R. Marklein, S. C. Reed, W. Parton, S. J. Del Grosso, and S. W. Cleveland Running (2013), Patterns of new versus recycled primary production in the terrestrial biosphere, Proc. Natl. Acad. Sci. U. S. A., 110(31), 12,733–12,737. https://doi.org/10.1073/pnas.1302768110.
Colomb, B., P. Debaeke, C. Jouany, and J. Nolot (2007), Phosphorus management in low input stockless cropping systems: Crop and soil responses to contrasting P regimes in a 36-year experiment in southern France, Eur. J. Agron., 26(2), 154–165.
Condron, L. M., and S. Newman (2011), Revisiting the fundamentals of phosphorus fractionation of sediments and soils, J. Soils Sediment.,
11(5), 830–840.
Cross, A. F., and W. H. Schlesinger (1995), A literature review and evaluation of the Hedley fractionation: Applications to the biogeochemical cycle of soil phosphorus in natural ecosystems, Geoderma, 64(3), 197–214.
Davidson, E. A., and I. A. Janssens (2006), Temperature sensitivity of soil carbon decomposition and feedbacks to climate change, Nature,
440(7081), 165–173.
Doetterl, S., A. Stevens, J. Six, R. Merckx, K. Van Oost, M. C. Pinto, A. Casanova-Katny, C. Muñoz, M. Boudin, and E. Z. Venegas (2015), Soil carbon storage controlled by interactions between geochemistry and climate, Nat. Geosci., 8(10), 780–783.
Elser, J. J., M. E. Bracken, E. E. Cleland, D. S. Gruner, W. S. Harpole, H. Hillebrand, J. T. Ngai, E. W. Seabloom, J. B. Shurin, and J. E. Smith (2007), Global analysis of nitrogen and phosphorus limitation of primary producers in freshwater, marine and terrestrial ecosystems,
Ecol. Lett., 10(12), 1135–1142.
Elser, J., W. Fagan, A. Kerkhoff, N. Swenson, and B. Enquist (2010), Biological stoichiometry of plant production: Metabolism, scaling and ecological response to global change, New Phytol., 186(3), 593–608.
Goll, D. S., N. Moosdorf, J. Hartmann, and V. Brovkin (2014), Climate-driven changes in chemical weathering and associated phosphorus release since 1850: Implications for the land carbon balance, Geophys. Res. Lett., 41(10), 3553–3558.
Goll, D., V. Brovkin, B. Parida, C. H. Reick, J. Kattge, P. Reich, P. Van Bodegom, and Ü. Niinemets (2012), Nutrient limitation reduces land carbon uptake in simulations with a model of combined carbon, nitrogen and phosphorus cycling, Biogeosciences, 9(9), 3547–3569. Gower, S., O. Krankina, R. Olson, M. Apps, S. Linder, and C. Wang (2001), Net primary production and carbon allocation patterns of boreal
forest ecosystems, Ecol. Appl., 11(5), 1395–1411.
Guenet, B., K. Lenhart, J. Leloup, S. Giusti-Miller, V. Pouteau, P. Mora, N. Nunan, and L. Abbadie (2012), The impact of long-term CO2 enrichment and moisture levels on soil microbial community structure and enzyme activities, Geoderma, 170, 331–336.
Guo, F., and R. S. Yost (1999), Quantifying the available soil phosphorus pool with the acid ammonium oxalate method, Soil Sci. Soc. Am. J.,
63(3), 651–656.
Hartmann, J., N. Moosdorf, R. Lauerwald, M. Hinderer, and A. J. West (2014), Global chemical weathering and associated P-release—The role of lithology, temperature and soil properties, Chem. Geol., 363, 145–163.
Hasegawa, S., C. A. Macdonald, and S. A. Power (2015), Elevated carbon dioxide increases soil nitrogen and phosphorus availability in a phosphorus-limited Eucalyptus woodland, Global Change Biol., 22, 1628–1643.
Hättenschwiler, S., and P. Gasser (2005), Soil animals alter plant litter diversity effects on decomposition, Proc. Natl. Acad. Sci. U. S. A.,
102(5), 1519–1524.
Hedley, M., J. Stewart, and B. Chauhan (1982), Changes in inorganic and organic soil phosphorus fractions induced by cultivation practices and by laboratory incubations, Soil Sci. Soc. Am. J., 46(5), 970–976.
Hermans, C., J. P. Hammond, P. J. White, and N. Verbruggen (2006), How do plants respond to nutrient shortage by biomass allocation?
Trends Plant Sci., 11(12), 610–617.
Hinsinger, P. (2001), Bioavailability of soil inorganic P in the rhizosphere as affected by root-induced chemical changes: A review, Plant
Soil, 237(2), 173–195.
Hinsinger, P., L. Herrmann, D. Lesueur, A. Robin, J. Trap, K. Waithaisong, and C. Plassard (2015), Impact of roots, microorganisms and microfauna on the fate of soil phosphorus in the rhizosphere, in Annual Plant Reviews, edited by W. C. Plaxton, and H. Lambers, vol. 48 , pp. 375–407 , John Wiley & Sons, Hoboken, N. J.
Johnson, A. H., J. Frizano, and D. R. Vann (2003), Biogeochemical implications of labile phosphorus in forest soils determined by the Hedley fractionation procedure, Oecologia, 135(4), 487–499.
Jones, C., et al. (2013), Twenty-first-century compatible CO2 emissions and airborne fraction simulated by CMIP5 earth system models under four representative concentration pathways, J. Clim., 26(13), 4398–4413. https://doi.org/10.1175/jcli-d-12-00554.1. Kattge, J., et al. (2011), TRY–a global database of plant traits, Global Change Biol., 17(9), 2905–2935.
Knops, J. M., D. A. Wedin, and S. Naeem (2010), The role of litter quality feedbacks in terrestrial nitrogen and phosphorus cycling, Open
Ecol. J., 3, 14–25.
Lal, R. (2008), Promise and limitations of soils to minimize climate change, J. Soil Water Conserv., 63(4), 113A–118A.
Lambers, H., P. M. Finnegan, E. Laliberté, S. J. Pearse, M. H. Ryan, M. W. Shane, and E. J. Veneklaas (2011), Phosphorus nutrition of proteaceae in severely phosphorus-impoverished soils: Are there lessons to be learned for future crops? Plant Physiol., 156(3), 1058–1066.
Liu, L., P. Gundersen, T. Zhang, and J. Mo (2012), Effects of phosphorus addition on soil microbial biomass and community composition in three forest types in tropical China, Soil Biol. Biochem., 44(1), 31–38.