HAL Id: hal-03128776
https://hal.archives-ouvertes.fr/hal-03128776
Preprint submitted on 28 Apr 2021HAL is a multi-disciplinary open access
archive for the deposit and dissemination of sci-entific research documents, whether they are pub-lished or not. The documents may come from teaching and research institutions in France or abroad, or from public or private research centers.
L’archive ouverte pluridisciplinaire HAL, est destinée au dépôt et à la diffusion de documents scientifiques de niveau recherche, publiés ou non, émanant des établissements d’enseignement et de recherche français ou étrangers, des laboratoires publics ou privés.
Virginia S Lioy, Jean-Noel Lorenzi, Soumaya Najah, Thibault Poinsignon,
Herve Leh, Corinne Saulnier, Bertrand Aigle, Sylvie Lautru, Annabelle
Thibessard, Olivier Lespinet, et al.
To cite this version:
Virginia S Lioy, Jean-Noel Lorenzi, Soumaya Najah, Thibault Poinsignon, Herve Leh, et al.. Dynamics of the compartmentalized Streptomyces chromosome during metabolic differentiation. 2021. �hal-03128776�
1 Dynamics of the compartmentalized Streptomyces chromosome during 1
metabolic differentiation 2
3
Virginia Lioy1,*, Jean-Noël Lorenzi1, Soumaya Najah1, Thibault Poinsignon1, Hervé 4
Leh1, Corinne Saulnier1, Bertrand Aigle2, Sylvie Lautru1, Annabelle Thibessard2, 5
Olivier Lespinet1, Pierre Leblond2, Yan Jaszczyszyn1, Kevin Gorrichon1, Nelle 6
Varoquaux3, Ivan Junier3, Frédéric Boccard1, Jean-Luc Pernodet1, Stéphanie Bury-7
Moné1,* 8
9
1Université Paris-Saclay, CEA, CNRS, Institute for Integrative Biology of the Cell 10
(I2BC), 91198, Gif-sur-Yvette, France. 11
2Université de Lorraine, INRAE, DynAMic, F-54000 Nancy, France 12
3TIMC-IMAG, CNRS - Université Grenoble Alpes, Grenoble, France 13
*Address correspondence to: [email protected], 14
15 16
Running Title: Dynamics of a compartmentalized genome 17
18
Keywords: Chromosome conformation; Transcriptomics; Genome dynamics; 19
Genomic islands; Compartmentalization; Specialized metabolism biosynthetic gene 20
clusters; Antibiotic production; Streptomyces 21
2 Abstract
23
Streptomyces are among the most prolific bacterial producers of specialized
24
metabolites, including antibiotics. The linear chromosome is partitioned into a central 25
region harboring core genes and two extremities enriched in specialized metabolite 26
biosynthetic gene clusters (SMBGCs). The molecular mechanisms governing 27
structure and function of these compartmentalized genomes remain mostly unknown. 28
Here we show that in exponential phase, chromosome structure correlates with 29
genetic compartmentalization: conserved, large and highly transcribed genes form 30
boundaries that segment the central part of the chromosome into domains, whereas 31
the terminal ends are transcriptionally, largely quiescent compartments with different 32
structural features. Onset of metabolic differentiation is accompanied by remodeling 33
of chromosome architecture from an ‘open’ to a rather ‘closed’ conformation, in which 34
the SMBGCs are expressed forming new boundaries. Altogether, our results reveal 35
that S. ambofaciens’ linear chromosome is partitioned into structurally distinct 36
entities, indicating a link between chromosome folding, gene expression and genome 37 evolution. 38 39 Introductory paragraph 40
Bacteria of the genus Streptomyces are amongst the most prolific producers of 41
specialized metabolites with applications in medicine, agriculture and the food 42
industry1. The biosynthesis of these specialized metabolites (e.g. antibiotics and 43
pigments) generally occurs after ‘metabolic differentiation’, a physiological transition 44
from primary to specialized metabolism2,3. This transition coincides with 45
morphological differentiation4 (e.g. formation of the secondary multinucleated 46
mycelium, sporulation) that occurs late in the growth phase. These metabolic and 47
3 morphological changes are controlled by highly interconnected regulatory
48
mechanisms that have been studied mostly at the transcriptional, translational and 49
post-translational levels4-7. However, a clear link between global chromosome 50
organization and metabolic differentiation has yet to be established. 51
Streptomyces possess an unusual linear chromosome. Moreover, its
52
extremities, or ‘terminal arms’, contain terminal inverted repeats (TIRs) capped by 53
telomere-like sequences. In addition, the chromosome is large (6-15 Mb) with an 54
extreme GC content (circa 72%). Finally, the Streptomyces chromosome presents a 55
remarkable genetic compartmentalization, with a distinguishable central region and 56
the terminal arms. The central region primarily contains core genes, common to all 57
Streptomyces species, these being often essential8-13. The terminal arms are mainly
58
composed of conditionally adaptive genes, in particular, enriched in specialized 59
metabolite biosynthetic gene clusters (SMBGCs)14. In addition, they are prone to 60
large DNA rearrangements and frequent recombination12,15,16,17. Importantly, many 61
SMGBCs appear silent or poorly expressed under laboratory conditions, giving rise to 62
the concept of ‘cryptic’ SMBGCs. The basis of the regulation of these clusters in 63
relation to the overall genome dynamics remains to be explored. 64
The development of chromosome conformation capture (3C) methods coupled 65
to deep sequencing provided novel concepts in bacterial chromosome biology18,19. 66
Notably pioneer studies revealed that bacterial chromosomes present a high degree 67
of 3D-organization in macrodomains and/or ‘chromosome interacting domains’ 68
(CIDs), mediated by multiple structural factors, including transcription and 69
replication20-27. Here, we explore the dynamics of the Streptomyces chromosome 70
during metabolic differentiation. By combining multi-omic approaches, we show that 71
the dynamics of gene expression correlate with the folding of the linear chromosome 72
4 of Streptomyces ambofaciens ATCC 23877 into transcriptionally active and silent 73
compartments. Moreover, metabolic differentiation is accompanied by a huge 74
remodeling of chromosome architecture from an ‘open’ to a rather ‘closed’ 75
conformation, SMBGCs forming new boundaries. Altogether, our results highlight a 76
link between chromosome folding, gene expression and genome evolution. 77
78
Results 79
Compartmentalization of the Streptomyces ambofaciens genome highlighted
80
by comparative genomics and functional annotation
81
The genetic compartmentalization of the S. ambofaciens ATCC 23877 genome 82
was previously reported12. However, here we took advantage of the numerous 83
Streptomyces available sequences to update the cartography of the genome. We
84
also used gene persistence28 as a new indicator to describe the organization of 85
Streptomyces genome. Gene persistence reflects the tendency for genes to be
86
conserved in a large number of genomes. As shown in other bacteria, gene 87
persistence is associated with gene essentiality and similar expression levels28-30. 88
Here, we calculated a gene persistence index by determining the frequency of a 89
given gene in a panel of 125 complete Streptomyces genomes (Supplementary 90
Table 1)31. The highest level of persistence associated with the best reciprocal
91
matches between genes of all these genomes defines the core-genome31. In 92
addition, we mapped the genes encoding the ‘actinobacterial signature’ previously 93
identified32 as those coding sequences (CDSs) that are nearly universal among 94
actinobacteria. In contrast, we searched the S. ambofaciens ATCC 23877 genome 95
for variable regions, potentially acquired by horizontal gene transfer. For this 96
purpose, we identified unique genes as well as genomic islands (GIs, 97
5
Supplementary Table 2, Supplementary Fig. 1). These are defined as DNA
98
sequences that are inserted in regions of synteny (i.e. same orthologous gene order 99
in closely related genomes, see Methods). Thus genes from the core, the 100
actinobacterial signature and/or presenting a high level of persistence are enriched in 101
the central region, whereas GIs and unique CDSs are enriched in chromosome 102
extremities. The results clearly highlight the compartmentalization of the S. 103
ambofaciens genome (Fig.1, Supplementary Table 3). Synteny gradually
104
disappears in terminal arms (Fig.1), as previously reported12. This makes it difficult to 105
have an operational delineation of the limits of these arms. However, since the first 106
and last ribosomal operons approximately mark the limits of a central region beyond 107
which the synteny level falls (Fig.1), these operons were used as limits for definition 108
of the left and right extremities in this study. 109
Functional annotation also highlighted a bias of gene distribution along the 110
chromosome (Fig.1, Supplementary Table 3). As a proxy for major metabolic 111
processes, we used the functional RNA genes (encoding rRNA, tRNA, tmRNA, 112
RNAse-P RNA, SRP-RNA) and genes encoding functions related to translation 113
and/or RNA stability. We also mapped the genes encoding nucleoid-associated 114
proteins (NAPs) and chromatin structural factors, further shorten ‘NAPSFs’, that play 115
a central role in the dynamic organization of the bacterial chromosome and are 116
enriched in the central region (Fig.1, Supplementary Table 3). Finally, we used the 117
antiSMASH secondary metabolite genome mining pipeline (version 5.1.0)33 to identify 118
putative SMBGCs (Supplementary Table 4). These genes are preferentially located 119
in the terminals arms and almost half of them are present within GIs (Fig.1, 120
Supplementary Table 3). Accordingly, GIs are 3.5-fold enriched in SMBGC genes (p
121
value < 2.2.10-6, Fisher’s exact test for count data). These results illustrate that the 122
6 high variability of Streptomyces extremities relates in particular to functions involved 123
in metabolic differentiation. 124
Together, these analyses confirm the strong genetic compartmentalization of 125
the S. ambofaciens chromosome. In this context, we then explored the extent to 126
which this genetic organization correlates with gene expression and chromosome 127
architecture. 128
129
Transcription of the S. ambofaciens genome is strongly compartmentalized
130
To focus specifically on transcriptome dynamics during metabolic 131
differentiation, while limiting cellular physiological heterogeneity in the colony, we 132
took advantage of the fact that S. ambofaciens, like many Streptomyces2, does not 133
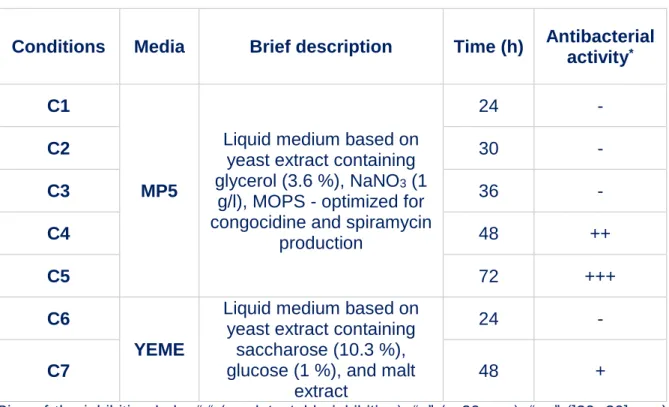
sporulate in liquid medium. We chose MP5 and YEME liquid media (Table 1) in 134
which S. ambofaciens grows in a rather dispersed manner that makes the cells also 135
more accessible to further 3C-treatments. Moreover, for S. ambofaciens, MP5 136
medium was previously reported to be suited for the production of the antibiotics 137
spiramycin34 and congocidine35 by S. ambofaciens while there is only limited 138
antibiotic production in YEME medium (Extended Data Fig.1.A&B). The results 139
showed that the transcriptomes were rather similar in exponential phase in both 140
media, while commitment to specialized metabolism (C4, C5 and C7 conditions) was 141
accompanied by major transcriptional changes that form a distinct cluster 142
(Fig.2.A&B, Extended Data Fig.1.C&D). Notably, at the earliest time points in the 143
growth period in both media, the terminal regions were rather poorly expressed, 144
whereas transcription gradually increased toward terminal ends over the growth 145
period (Fig.2.B), as previously reported in S. coelicolor10,36. We observed that the S. 146
ambofaciens genome has a transcriptional landscape with approximately 90 % of the
7 genes significantly expressed (‘CAT_1’ level or more) and/or regulated (DESeq2 148
statistical analysis) in at least one condition (Extended Data Fig.2.A&B, 149
Supplementary Table 5).
150
As shown by scanning the genome with respect to gene expression levels, we 151
found a marked bias in the localization of poorly versus highly expressed genes 152
along the genome as well as a positive correlation between gene persistence and 153
expression (Fig. 2C, Extended Data Fig.2.C & D). The 332 chromosomal genes 154
expressed at very high level in all conditions are mainly enriched in the central region 155
of the genome (Supplementary Table 3, Fig.3D), whereas most (> 60 %) of the 156
SMBGCs, GIs and mobile genetic elements (pSAM1, pSAM2 and a prophage) are 157
silent or poorly expressed in at least one condition. Up to 19 and 23 % of SMBGC 158
and GI genes, respectively, were found in this category in all tested conditions 159
(Extended Data Fig.2.B). However, compared to other poorly conserved genes, 160
SMBGCs have a higher proportion of highly induced genes, from ‘CAT_0’ to the 161
highest (‘CAT_3’ or ‘CAT_4’) categories (Extended data Fig.2.C). 162
Interestingly, as previously described in S. coelicolor36, we observed 163
significant antisense-transcription throughout the genome. Considering the absolute 164
number of transcripts, this antisense-transcription was positively correlated to the 165
level of sense-transcription (Extended Data Fig.2.E), suggesting that spurious 166
antisense-transcription can arise from highly transcribed regions. To investigate the 167
relative importance of this antisense-transcription, we defined the ‘antisense index’ as 168
the level of antisense-transcription over the total (sense plus antisense) transcription. 169
Interestingly, in exponential phase, the antisense index was particularly high for GIs, 170
mobile genetic elements and SMBGCs and very low in conserved regions enriched in 171
the central region (except for pSAM2) (Extended Data Fig.2.F). During metabolic 172
8 differentiation the antisense indices of GIs, pSAM1, prophage and especially
173
SMBGCs tended to decrease (Extended Data Fig.2.F). This observation suggests 174
that antisense-transcription could be a consequence of or directly involved in the 175
regulation of gene expression concerning metabolic differentiation. 176
Together, these results indicate that the genetic compartmentalization of the 177
Streptomyces genome clearly correlates with a compartmentalization of transcription,
178
both sense and antisense. 179
180
Compartmentalized architecture of the Streptomyces ambofaciens
181
chromosome in exponential phase
182
We next asked the question, is a compartmentalized transcriptome correlated 183
with a specific chromosome folding. We first performed 3C-seq on cells harvested in 184
the exponential growth phase (Fig.3, Fig.4.A). The contact map displayed a main 185
diagonal reflecting the frequency of contacts, which extends up to 1 Mb (Extended 186
Fig.3.A). This diagonal contains loci acting as boundaries delimiting segments
187
(visualized as squares, Fig.3.A, Fig.4.A) reminiscent of CIDs in other bacteria20-22. 188
To define these domains precisely in S. ambofaciens, we computed the ‘frontier 189
index’, a domain boundary indicator built from a multiscale analysis of the contact 190
map37. Briefly, two indices are computed, reflecting the intensity of the loss of contact 191
frequencies when going downwards or upwards, respectively, to each genome 192
position (Extended Fig.3.B). In this context, a boundary is defined by a significant 193
change in both the downstream (green peaks, Fig.3.B) and upstream (orange peaks, 194
Fig.3.B) directions (see method section for details). In exponential phase in YEME
195
medium (non-optimal for antibiotic production, condition C6), we found 10 boundaries 196
that defined the central region, delimited by the first and last rDNA operons, 9 197
9 domains ranging in size from 240 kbp to 700 kbp (Fig.3.B). These central domains 198
resembled regular CIDs20,23 both in size and in the presumably nature of its formation 199
(see below). The central boundaries are also conserved in exponential phase in MP5 200
medium, which is optimized for antibiotic production (Fig.4.A). Only four additional 201
boundaries are observed in this medium (Fig.4.A). All rDNA operons coincide with 202
the sharpest boundaries (Fig.3.B, Fig.4.A). The genes surrounding these operons, 203
as well as those of other boundaries, are enriched in consecutive genes expressed at 204
very high level (Fig.4.B, Supplementary Table 5), as previously reported in other 205
bacterial models20,23. Interestingly, in exponential phase, we report a clear correlation 206
between the level of gene conservation and the formation of boundaries (Fig.4.C). 207
Moreover, the transcription of the genes present within boundaries tends to be 208
oriented in the direction of continuous replication (odds ratio 1.8, p value 1.4.10-8, 209
Fisher’s exact test for count data), with a very low antisense index (Extended Data 210
Fig.3.C).
211
Genome extremities form two large terminal compartments of 1.46 and 2.46 212
Mbp, respectively, with different structural features (Fig.3, Fig.4.A and Extended 213
Data Fig.3B). Interestingly, within the terminal arms, the low transcriptional activity in
214
exponential phase in YEME medium correlates well with the absence of boundaries. 215
Of note, the boundaries present in each terminal domain in MP5 medium (one of 216
which is composed of an active prophage) do not contain highly expressed genes 217
and do not divide the terminal compartment into two parts (Fig.4.A). To compare the 218
dynamics of contacts within regions, we thus calculated a dispersion index, reflecting 219
the variability of the 3C-seq signal in each region (Fig.4.D, Extended Data Fig.3.E). 220
Despite that the plots for the probability of contacts as a function of genomic distance 221
are similar for both the terminal and central regions (Extended Data Fig.3.D), the 222
10 terminal ends present a higher dispersion index than the central compartment in both 223
media for contacts longer than 100 kbp (Fig.4.D, Extended Data Fig.3.E). This 224
indicates that contacts between loci in the terminal regions are more variable than in 225
the central compartment. 226
Thus, at the conformational level, the chromosome of exponentially growing 227
cells of S. ambofaciens is partitioned into three compartments: a central 228
compartment, actively transcribed and structured in multiple domains formed by the 229
high-level expression of persistent genes and two large terminal compartments rich in 230
GIs and SMBCGs and rather transcriptionally silent in which large-scale contacts are 231
highly variable. Since in exponential phase, the boundaries are very similar in YEME 232
and MP5 media and correspond mostly to persistent CDSs (Fig.4.C) or rDNA, their 233
orthologous sequences may also structure the spatial organization of the 234
chromosome in other Streptomyces species at a similar growth phase. 235
236
Chromosome remodeling during metabolic differentiation
237
As shown above, during metabolic differentiation we observed that the level of 238
transcription gradually increased within the terminal ends (Fig.2). To determine 239
whether transcription dynamics influence the 3D-organization of the chromosome, we 240
performed 3C-seq on Streptomyces cells during metabolic differentiation in MP5 241
medium (48 h, condition C4) (Fig.4.E). The frontier index revealed changes in the 242
boundaries along the primary diagonal; the boundaries identified in exponential 243
phase were not detected anymore after 48 h in the growth medium (Fig.4.E). By 244
contrast, the appearance of a very sharp boundary within the right terminal region 245
that divides this arm into two domains of 1,350 kpb and 1,000 kpb, correlates very 246
well with the increased level of transcription of the congocidine biosynthetic gene 247
11 cluster (BGC, Fig.4.B & E). In a replicate experiment, we observed that the
248
expression of another SMBGC, encoding the biosynthesis of a siderophore, could 249
generate the formation of an additional boundary (Supplementary Fig.3.C). This 250
illustrates some variability in the expression of SMBGCs during metabolic 251
differentiation. Together, these results highlight the correlation between SMBGC 252
expression and the formation of boundaries after 48 h. Accordingly, the level of 253
conservation of genes present within the boundaries switches from highly persistent 254
in exponential phase to poorly conserved during metabolic differentiation (Fig.4.C). In 255
addition, a second boundary detected within the right compartment is located in the 256
stambomycin BGC that is not or is poorly expressed in this condition. Interestingly, 257
accompanying the formation of boundaries and the increase of transcription in the 258
terminal compartments, the variability in the long-range contacts within the terminal 259
compartments is comparable to that of the central compartment (Fig 4.D). 260
The contact map also revealed the appearance of a secondary diagonal after 261
48 h of growth, indicating an increase in the frequency of contacts between regions 262
along the entire arms of the chromosome. This suggests that late in the cell cycle and 263
in the absence of a central compartment segmented into multiple domains, the two 264
chromosome arms are closer to each other (Fig.4.E & F). Remarkably, the second 265
diagonal is slightly tilted when it moves away from the origin, representing an 266
asymmetry in the contacts between loci within the terminal compartments. 267
In summary, our results indicate that the central and transcriptionally active 268
compartments in exponential phase present no boundaries after 48 h of growth, 269
whereas the terminal domains are locally remodeled concomitantly with the 270
expression of SMBGCs and with a decrease in the variability of the long-range 271
contacts. In addition, inter-arm contacts become more frequent. These results 272
12 indicate that metabolic differentiation is accompanied by major remodeling of the 3D-273
architecture of the chromosome, both at the local and global levels (Fig.4.F). 274
275
Discussion 276
In this study, we demonstrated that in Streptomyces, compartmentalization of 277
gene organization, transcription and architecture are correlated. We explore the 278
transcriptional landscape of S. ambofaciens ATCC 23877 during metabolic 279
differentiation: its large genome is highly dynamic, most of the genes (≈ 90 %) being 280
significantly expressed in at least one condition. This situation is very similar to 281
Bacillus subtilis, another Gram-positive bacteria from soil38. Interestingly, the
282
SMBGCs (e.g. antibiotic clusters) are generally considered as ‘cryptic’ under most 283
growth conditions10,39. We observed that they are poorly expressed in exponential 284
phase. However their expression is characterized by up regulation after 48 h in the 285
growth medium, compared to the rest of the chromosome including other genes 286
putatively acquired by horizontal gene transfer (e.g. GIs). This result highlights that 287
SMBGCs in S. ambofaciens have evolved regulatory mechanisms, such as the 288
induction of cluster-situated transcriptional factor genes (Supplementary Fig.2) that 289
efficiently and specifically regulate gene expression during metabolic differentiation, 290
as reported in other Streptomyces species4-7. 291
Moreover, we show that changes in gene expression dynamics are correlated 292
with metabolic differentiation. Indeed, the terminal regions become transcriptionally 293
active after 48 h of growth (see also references10,36) (Fig.2). Interestingly, the ratio, 294
antisense- over sense-transcription is high within the terminal compartments but 295
decreases over the growth period, especially in the SMBGCs (Extended Data 296
Fig.2.F). This suggests that this antisense-transcription may reflect regulatory
13 processes that remain to be explored. This is particularly interesting since some 298
NAPs suppress antisense-transcription in S. venezuelae40.
299
In addition, 3C-seq analysis revealed that in exponential phase the central 300
compartment forms a multiple domain structure, delineated by boundaries, whereas 301
the terminal regions form two large compartments in which contacts are more 302
variable at larger distances. As previously shown for bacteria with circular 303
genomes20-23,26, long and highly expressed genes (LHEGs encoding rRNA, ribosomal 304
proteins, or respiratory chain components) are found at the boundaries in the 305
Streptomyces chromosome (Supplementary Table 5, Fig.4). The positions of these
306
boundaries are both conserved (under certain circumstances) and dynamic, since 307
they change over the growth phase (22, this work). Notably, most of the boundaries 308
observed at early growth times were correlated with the presence of persistent genes 309
(Fig.4C). Within the central compartment, domains are a direct consequence of 310
boundary formation. Additionally, no trivial role in gene expression or in chromosome 311
conformation have been assigned to chromosome interacting domains (CIDs) in 312
bacteria41. Here we propose that boundaries are likely to act as transcriptional hubs 313
for clustered and persistent genes42, associated with very high levels of transcription 314
in exponential phase. Moreover, in exponential phase, the first and last rDNA 315
operons form the sharpest boundaries, recapitulating the borders that were arbitrarily 316
used to define the central region beyond which genome synteny falls (Figure 1). We 317
thus propose that they also constitute an evolutionary barrier that limits the 318
occurrence of single recombination events within the central region. Interestingly, 319
some boundaries in Streptomyces do not display high levels of gene expression 320
(Supplementary Table 5). These are generally located within the terminal arms, 321
14 suggesting the existence of other mechanisms, yet to be discovered that impose 322
chromosome constraints. 323
Furthermore, we show for the first time that the central and terminal 324
compartments present different organizational features, an observation 325
independently demonstrated for the S. venezuelae chromosome (see accompanying 326
paper, Szafran et al.). We favor the idea that the different organization of the terminal 327
compartments could be a consequence of multiple factors: i) the lack of constraints 328
imposed by active and sense-transcription; ii) the high level of anti-sense 329
transcription; iii) the enrichment of horizontally acquired NAPs and other 330
transcriptional regulators that, by increasing the dynamics of DNA intramolecular 331
interactions, ensure appropriate SMBGC repression in exponential phase. 332
Interestingly, it was shown in S. venezuelae that during sporulation the HupS NAP is 333
involved in promoting optimal contacts along the whole chromosome, but seems to 334
be particularly important for the organization of the terminal regions (see 335
accompanying paper, Szafran et al.). 336
During metabolic differentiation, the changes in transcriptional dynamics are 337
accompanied by a huge remodeling of chromosome folding, switching from an ‘open’ 338
to a ‘closed’ conformation, in which highly expressed SMBGC genes form new 339
boundaries (Fig.4.E & F). This may illustrate a relocation of transcriptional hubs from 340
clustered and persistent genes (in exponential phase) to SMBGCs at the onset of 341
metabolic differentiation. Remarkably, the central region is no longer structured into 342
multiple domains. The lack of boundaries in the central compartment after 48 h 343
growth is correlated with a slight decrease in transcripts from genes that were 344
present in boundaries in exponential phase. Indeed most of these genes remain 345
expressed at high level (‘CAT-3’ or ‘CAT_4’) but below a threshold classically 346
15 associated with boundaries (a string of genes with above 20 000 normalized reads 347
per kb, Supplementary Table 5). Moreover, we cannot exclude the possibility that 348
some of these transcripts are stable RNAs produced in exponential rather than 349
stationary phase43. This loss of boundaries in the central compartment is reminiscent 350
of the phenomena observed in eukaryotes during G1-to-mitosis transition44 and could 351
reflect a more general phenomenon of genome compaction during the cell cycle. 352
At larger scales, there is an increase in the frequency of inter-arm DNA 353
contacts. The most likely candidate to be involved in this reorganization is the Smc-354
ScpAB condensin complex, which is recruited to the origin region by ParB bound to 355
parS45,46. From the parS sites, Smc-ScpAB promotes inter-arm contacts by
356
translocating to the terminal region of the chromosome, likely by loop 357
extrusion20,21,24,27,47-52. Streptomyces spp. encode both a ParABS system53-55 and a 358
Smc-ScpAB complex56. Interestingly, during sporulation Streptomyces chromosomes 359
need to be compacted and segregated to ensure correct spore formation5756. Indeed, 360
HiC studies during sporogenic development in S. venezuelae showed that inter-arm 361
contacts are dependent on Smc-ScpAB (Szafran et al., see accompanying paper). 362
The global remodeling of the Streptomyces chromosome going from an ‘open’ to a 363
‘closed’ conformation seems to occur similarly during metabolic (this work) and 364
sporogenic development (Szafran et al., see accompanying paper). Such a global 365
rearrangement has not been previously described in wild-type bacteria. Interestingly, 366
we observed a slight tilt in the secondary diagonal in contact analysis when it 367
approaches to the terminal compartments (Fig.4.E, Supplementary Fig.3.C). This is 368
consistent with a slow-down of Smc-ScpAB activity when interacting with the 369
transcription machinery50,58, in agreement with the fact that transcription in the 370
16 terminal compartment is higher than in the central compartment during metabolic 371
differentiation (Fig.4.E, Supplementary Fig.3.C). 372
Collectively, these results indicate a link between evolutionary processes, 373
including genome-compartmentalization and the molecular mechanisms (e.g. 374
transcription, 3D-folding) that shape the structure and function of genes and 375
genomes in Streptomyces. We therefore hypothesize that the efficiency of the 376
regulatory processes controlling conditional expression of SMBGCs may be an 377
emerging property of spatial compartmentalization. We believe that this study will 378
open new insights into setting the rules governing chromosome spatial organization, 379
expression and stability, and the optimal design of Streptomyces genomes for 380 SMBCG expression. 381 382 Methods 383
Streptomyces strains and growth conditions
384
S. ambofaciens ATCC 23877 was grown on solid soy flour-mannitol (SFM)
385
medium59 at 28°C unless otherwise indicated. The strain was grown in the following 386
media: MP5 medium (7 g/l yeast extract, 20.9 g/l MOPS, 5 g/l NaCl, 1 g/l NaNO3, 36 387
ml/l glycerol – pH 7.5) 34, or YEME medium 10.3 % sucrose (3 g/l yeast extract, 5 g/l 388
bactotryptone, 3 g/l malt extract, 10 g/l glucose, 103 g/l sucrose; pH 7.0-7.2 ; adapted 389
from59). Twenty million spores of S. ambofaciens ATCC 23877 were inoculated in 390
100 ml of media before growth at 30°C in a shaking agitator (220 rpm, INFORS HT 391 multitron standard). 392 393 Bioassays 394
17 For bioassays from liquid cultures, 50 µl of filtered supernatants were spotted on 395
to agar medium using cylinder (diameter 0.5 cm) and allowed to dry until complete 396
penetration into a plate containing 50 ml of DIFCO antibiotic medium 5 (DIFCO 397
227710). Thereafter 7 ml of SNA medium (2 g/l agar, 8 g/l nutrient broth MP 398
Biomedicals Cat#1007917) containing Micrococcus luteus (final OD600nm 0.04) were 399
overlaid on the plate and incubated at 37°C. The growth inhibition area was 400
measured 24 h later. 401
Genomic island (GI) identification
402
We designed the Synteruptor program (
http://bim.i2bc.paris-403
saclay.fr/synteruptor/)60 to compare the sequences of chromosomes of species close
404
enough to have synteny blocks, and to identify the genomic islands existing in each 405
respective chromosome. We define synteny breaks as genomic regions between two 406
consecutive synteny blocks when comparing two genomes, with the two blocks 407
having the same direction. The genome of S. ambofaciens ATCC 23877 was 408
compared to the chromosome of 7 closely related strains: S. ambofaciens 409
DSM40697, S. coelicolor A3(2), S. lividans 1326, S. lividans TK24, S. mutabilis, 410
Streptomyces sp. FXJ7.023, Streptomyces spp. M1013. To define a region
411
harbouring GIs, we used a threshold of 15 CDS as the minimal number of CDSs 412
within the synteny break, in at least one of the strains used for the pairwise 413
comparison. Of note, a GI can therefore correspond to 15 CDS in one strain but less 414
CDS in the other one. However, when the corresponding position within the S. 415
ambofaciens genome contained less than 2 CDS or only tRNAs, compared to at least
416
15 CDSs in the chromosome of the compared species, it was considered as an 417
insertion point (but not a GI) within S. ambofaciens. When the GIs were identified 418
during several pairwise comparisons of S. ambofaciens ATCC 23877 and/or 419
18 overlapping, they were fused and considered thereafter as a single GI. The complete 420
list of GIs identified in the S. ambofaciens genome is presented in Supplementary 421
Fig. 1 and Supplementary Table 2.
422 423 424
SMBGCs identification
425
We used antiSMASH5.1.033 to identify putative SMBGCs. Thirty SMBGCs have 426
thus been identified in the S. ambofaciens genome, the one encoding kinamycin 427
biosynthesis being duplicated owing to its location within the TIRs. The definition of 428
cluster boundaries has been manually refined on the basis of literature data for 429
characterized SMBGCs (Supplementary Table 4). Of note, SMBGC genes are ≈ 1.5 430
times larger than the average, and only 13 of them (from 4 SMBGCs, namely 431
‘CL4_Indole’, ‘CL10_Furan’, ‘CL11_NRPS’, ‘CL20_Hopenoid’) belong to the core 432
genome. 433
NAPSFs, identification
434
In this study, we considered NAPs and chromosome structural factors sensu lato 435
by including orthologues of classical NAPs and structural factors (HU, sIHF, Lsr2, 436
Lrp/AsnC, SMC, Dps, CbpA, DnaA or IciA family proteins)61 and/or proteins 437
associated with S. coelicolor chromatin62. This list is available in Supplementary 438
Table 5.
439
Definition of indexes for genome conservation analyses
440
We selected 125 Streptomyces genomes from the NCBI database representative 441
of the Streptomyces genus by keeping only complete genomes of distinct species. 442
When genomes share an average nucleotide identity (ANIb) value greater than or 443
equal to 96 %, they are considered as members of the same species31 444
19 (Supplementary Table 1). We made one exception by keeping two strains of S. 445
ambofaciens (ATCC 23877 and DSM 40697). Orthologous genes were identified by
446
BLASTp best hits63 with at least 40 % of identity, 70 % coverage and an E-value 447
lower than 1e-10 31. The gene persistence index was calculated as N
orth/N, where North 448
is the number of genomes carrying a given orthologue and N the number of genomes 449
searched28. Pairwise comparisons are achieved using a sliding window and 450
comparing a reference strain (species A) to another (species B). Here is considered a 451
window containing 8 genes noted from 1 to 8 in the reference species. To calculate 452
the GOC index (Gene Order Conservation), which is the number of contiguous 453
syntenic orthologs between the two chromosomes over the number of orthologs 454
between the two chromosomes, calculated in a sliding window, the pair of contiguous 455
genes present in the window in the reference species are searched and counted as 456
contiguous pairs of orthologues in the whole genome of species B related to the 457
number of orthologs is defined by the window. 458
Transcriptome analysis
459
For RNA-seq analysis performed in liquid cultures, ≈ 2.107 spores of S. 460
ambofaciens ATCC 23877 were inoculated in 100 ml of liquid medium. Thereafter, 25
461
ml (for samples harvested after 24 h growth) or 10 ml of cultures (for other time 462
points) were added to an equal volume of cold ethanol. 463
Cells were then harvested by centrifugation for 15 min at 4,000 g at 4°C, and 464
stored at -20°C. Pellets were washed with 1 ml of DEPC water, centrifuged for 5 min 465
at 16,000 g at 4°C and homogenized with glass beads (≤ 106 µm; G4649, SIGMA) in 466
350 µl of lysis buffer (RNeasy Plus Mini Kit, QIAGEN) supplemented with 10 µl/ml β-467
mercaptoethanol. Samples were processed 3 times for 45 sec each in FastPrep-24TM 468
5G instrument (MP Biomedicals) at setting 6 with 1 min cooling between the stages. 469
20 After centrifugation for 10 min at 16,000 g at 4°C, total RNAs were isolated from the 470
supernatants using an RNeasy Plus Mini Kit (QIAGEN) and gDNA Eliminator 471
columns, following the manufacturer’s recommendations. To remove genomic DNA, 472
RNA samples were incubated for 30 min at 37°C with 20 U of RNase-free DNase I 473
(Roche) in a final reaction volume of 30 µl. RNAs were then cleaned up using the 474
RNeasy Mini Kit (QIAGEN), following the manufacturer’s recommendations. The 475
absence of DNA in the preparations was checked by PCR on an aliquot. RNA 476
samples were quantified using QubitTM RNA HS Assay kit (ThermoFischer Scientific), 477
following manufacturer’s recommendations. 478
Total RNA quality was assessed in an Agilent Bioanalyzer 2100, using RNA 6000 479
pico kit (Agilent Technologies). 500 ng of total RNA were treated with DNAse 480
(Baseline Zero DNAse, Epicentre) prior to ribosomal RNA depletion using the 481
RiboZero bacteria magnetic Kit from Illumina according to the manufacturer’s 482
recommendations. After the Ribo-Zero step, the samples were checked in the Agilent 483
Bioanalyzer for complete rRNA depletion. Directional RNA-seq libraries were 484
constructed using the Illumina ScriptSeq kit V2 (discontinued) for samples 485
corresponding to C5 conditions and Illumina Stranded library preparation kit for all 486
other samples, according to the manufacturer’s recommendations. 487
Libraries were pooled in equimolar proportions and sequenced (Paired-end 2x43 488
bp) with an Illumina NextSeq500 instrument, using a NextSeq 500 High Output 75 489
cycles kit. Demultiplexing was done (bcl2fastq2 V2.2.18.12) and adapters 490
(adapter_3p_R1: AGATCGGAAGAGCACACGTCTGAACT; adapter_3p_R2: 491
AGATCGGAAGAGCGTCGTGTAGGGA) were trimmed with Cutadapt1.15, only 492
reads longer than 10 bp were kept. 493
21 STAR software 64 was used for mapping RNA-seq to the reference genome 494
(genome-build-accession NCBI_Assembly: GCF_001267885.1) containing only one 495
terminal inverted repeat (TIR). This avoids any biases with multiple mapping within 496
the duplicated extremities of the genome (since the two TIR sequences are 497
indistinguishable). We used the featureCounts program65 to quantify reads (in sense- 498
and antisense- orientation) generated from RNA-sequencing technology in terms of 499
“Gene” feature characteristics of S. ambofaciens ATCC 23877 most recent 500
annotation (GCF_001267885.1_ASM126788v1_genomic.gff – released on the 501
06/15/2020). 502
Bioinformatic analysis of RNA-seq count data
503
SARTools (Statistical Analysis of RNA-Seq data Tools) DESeq2-based R 504
pipeline66 was used for systematic quality controls and the detection of differentially 505
expressed genes. PCA and sample clustering used homoscedastic data transformed 506
with Variance Stabilizing Transformation (VST). For the differential analysis, the 507
Benjamini and Hochberg's method was used with a threshold of statistical 508
significance adjusted to 0.05. The reference condition was C1 (medium “MP5_24h”). 509
All parameters of SARTools that have default values were kept unchanged. Genes 510
with null read counts in the 37 samples were not taken into account for the analysis 511
with DESeq2. Genes corresponding to the second TIR (not used for the mapping) or 512
the rRNAs (RiboZero treatment) were excluded from further analysis. 513
Supplementary Table 5 presents the normalized counts per gene in each growth
514
condition. To ensure that antisense-transcription did not affect the normalization of 515
sense-transcription data, the latter were normalized as follows: the percentage of 516
transcription in antisense orientation of each gene was determined with the raw data, 517
then the normalized antisense-transcription was evaluated by applying this 518
22 percentage to the normalized sense-transcript counts. To determine the category of 519
gene expression the normalized counts obtained by the SARTools DESeq2-based 520
pipeline were again normalized with respect to gene size (number of DESeq2 521
normalized reads/gene size x 1000 bp), and thereafter expressed in RPK (reads per 522
kb). This allowed us to compare directly the relative levels of gene expression of 523
individual genes. Data were analyzed with R software67 and the Integrative Genomics 524
Viewer (IGV) tool was used to simultaneously visualize RNAseq data and genomic 525
annotations68. 526
Multidimensional analyses of the data
527
We used the FactoShiny R package69 to perform clustering, principal component 528
analyses and correspondence analyses. This overlay factor map presented in 529
Extended Data Fig.2.C results from the correspondence analysis performed using a
530
contingency table indicating the number of genes in each category of expression 531
level depending on the genome features of interest. Max’, ‘Mean’ and ‘Min’ refer to 532
the maximal, mean and minimal expression levels in all studied condition, from the 533
lowest category (‘0’) to the highest (‘4’). These categories were defined by 534
considering the distribution parameters of the normalized number of reads 535
(Extended Fig.2.A.). These gene expression categories as well as the number of 536
genes switched ON (‘Switch’, meaning that the expression level switches from 537
CAT_0 in at least one condition to CAT_3 or more in another condition), or 538
presenting a very low (‘AS < 0.05’) or high (‘AS > 0.5’) level of antisense index were 539
used to build the map, and projected on the plan. Here are some basic explanations 540
of how to interpret the results of correspondence analysis. On Extended Data 541
Fig.2.C, the squares correspond to the raw labels (genome features). The triangles
23 correspond to the column labels (e.g. category of level of mean, maximal, minimal 543
sense-transcription, antisense index < 0.05, antisense index > 0.5). 544
Chromosome conformation capture (3C)
545
Spores of S. ambofaciens ATCC 23877 (≈ 4.107) were inoculated in 200 ml of 546
MP5 or YEME liquid medium. In these media, bacterial growth was monitored by 547
opacimetry. At the indicated time point, cells were harvested from 100 ml samples of 548
culture, adjusted to an OD600 nm of about 0.15 (with the appropriate fresh medium) 549
and fixed by adding formaldehyde solution (3 % final concentration). Cells were then 550
incubated under moderate agitation for 30 min at RT and 30 min more at 4°C. 551
Glycine (250 mM final concentration) was added, and the bacteria incubated 30 min 552
at 4°C with moderate agitation. Cells were then harvested by centrifugation for 10 553
min at 4,000 g at 4°C. The cells were gently suspended in 50 ml of PBS 1X and then 554
again harvested by centrifugation for 10 min at 4,000 g at 4°C. This washing step 555
was repeated once before suspending the cells in 1 ml of PBS before final harvesting 556
by 10 min at 4,000 g at 4°C. The dry pellets were stored at -80°C until use. 557
Frozen pellets of exponentially grown cells were thawed, suspended in 600 µl Tris 558
10 mM EDTA 0.5 mM (TE) (pH 8) with 4 µl of lysozyme (35 U/µl; Tebu Bio) and 559
incubated at RT for 20 min. For the samples collected after 48 h, the pellets were 560
thawed, suspended in TE (pH 8) with 4 µl of lysozyme (35 U/µl; Tebu Bio) for 45 min 561
and then homogenized with a Bioruptor sonication device (3 cycles of 30 seconds, 562
with a pause of 30 second pause for each). Then, for both 24 h and 48 h samples, 563
SDS was added to the mix (final concentration 0.5%) of cells and incubated for 10 564
minutes at RT. 500 µl of lysed cells were transferred to a tube containing 4.5 ml of 565
digestion mix (1X NEB 3 buffer, 1% triton X-100) and 100 µl of the lysed cells were 566
transferred to a tube containing 0.9 ml of digestion mix. 800 units of SalI were added 567
24 to the 5 ml digestion mix. Both tubes were then incubated for 2 h at 37°C and 250 568
units of SalI were added to the 5 ml tube and further incubated, 2 h at 37°C. To stop 569
the digestion reaction, 4 ml of the digestion mix were immediately centrifuged for 20 570
min at 20,000 g, and pellets suspended in 4 ml of sterile water. The digested DNA (4 571
ml in total) was split into 4 aliquots and diluted in 8 ml ligation buffer (1X ligation 572
buffer NEB 3 (without ATP), 1 mM ATP, 0.1 mg/ml BSA, 125 Units of T4 DNA ligase 573
5 U/µl). Ligation was performed at 16°C for 4 h, followed by incubation overnight at 574
65°C with 100 µl of proteinase K (20 mg/ml) and 100µl EDTA 500 mM. DNA was 575
then precipitated with an equal volume of 3 M Na-Acetate (pH 5.2) and two volumes 576
of iso-propanol. After one hour at -80°C, DNA was pelleted and suspended in 500 µl 577
1X TE buffer. The remaining 1ml digestion mix with or without SalI were directly 578
incubated with 100 µl of proteinase K (20 mg/ml) overnight at 65°C. Finally, all the 579
tubes were transferred into 2 ml centrifuge tubes (8 tubes), extracted once with 400 580
µl phenol-chloroform pH 8.0, precipitated, washed with 1 ml cold ethanol 70% and 581
diluted in 30 µl 1X TE buffer in the presence of RNAse A (1 g/ml). Tubes containing 582
the ligated DNA (3C libraries) were pooled. The efficiency of the 3C preparation was 583
assayed by running aliquots of the 3C-librairies, the digested DNA or the non-584
digested DNA on 1% agarose gel. Finally the 3C libraries were quantified on the gel 585
using QuantityOne software (BioRad). 586
Processing of libraries for Illumina sequencing
587
Approximately 5 µg of a 3C library was suspended in water (final volume 130 µL) 588
and sheared using a Covaris S220 instrument (Duty cycle 5, Intensity 5, cycles/burst 589
200, time 60 sec for 4 cycles). The DNA was purified using a Qiaquick® PCR 590
purification kit, DNA ends were prepared for adapter ligation following standard 591
protocols70. Custom-made adapters21were ligated overnight at 4°C. Ligase was 592
25 inactivated by incubating the tubes at 65°C for 20 min. To purify DNA fragments 593
ranging in size from 400 to 900 pb, a PippinPrep apparatus (SAGE Science) was 594
used. For each library, one PCR reaction of 12 cycles was performed using 2 to 3 µl 595
of 3C library, 0.2 µM Illumina primers PE1.0 and PE2.0 and 1 unit of Taq Phusion 596
[Finnzymes]. The PCR product was purified on Qiagen MinElute columns and dimers 597
of primers were removed from the 3C library by using AMPure XP beads following 598
the manufacturer’s protocol (Beckman Coulter). Finally, libraries were subjected to 75 599
bp paired-end sequencing in an Illumina sequencer (NextSeq500). 600
Processing of sequencing data
601
PCR duplicates from each 3C library sequence dataset were discarded using the 6 602
Ns of custom-made adapters21. Reads were aligned independently using Bowtie 2 in 603
very sensitive mode71. Only reads with mapping quality > 30 were kept to establish 604
contact maps. 605
Generation of contact maps
606
Contact maps were built as described previously72. Briefly, each read was 607
assigned to a restriction fragment. Non-informative events such as self-circularized 608
restriction fragments, or uncut co-linear restriction fragments were discarded73. The 609
chromosome of S. ambofaciens devoid of the TIRs was divided into 10 kbp bins and 610
the frequencies of contacts between genomic loci for each bin were assigned. 611
Contact frequencies were visualized as heatmaps. Raw contact maps were 612
normalized with the sequential component normalization procedure (SCN73). To 613
facilitate visualization, contact matrices are visualized as log matrices. First we 614
applied to the SCN matrices the log10 and then a Gaussian filter (H=1) to smooth the 615
image. The contact score for a pair of bins that due to mapping was identified as an 616
26 outlier (z-score>contact score) was replaced with the median value of the contact 617
matrix. 618
Frontier Index determination
619
To analyze the domain organization of S. ambofaciens, we used the frontier index 620
(FI) method that quantifies the involvement of each bin in the frontier of any domain, 621
i.e. at any scale – see technical details in37. Briefly, this method consists, first, in 622
computing derivatives of the contact maps. To this end, we used normalized contact 623
maps where the average contact frequency, P(s), was substracted to reduce noise 624
coming from the natural overall decrease of contact frequencies as the genomic 625
distance (s) between loci increase. Here, we also added pseudocounts (equal to 626
m/20 where m is the maximal value of the contact frequencies) such that all values of
627
the contact maps are strictly positive and we considered the logarithm of the resulting 628
maps in order to mitigate the strongest variations close to the diagonal. We then 629
considered separately the derivatives of these maps along the vertical and horizontal 630
axes, whose large positive values (in the upper part of the maps) are respectively 631
associated with upstream and downstream frontiers of domains, respectively. After 632
setting negative values to zero (to reduce noise even more), for each bin the 633
corresponding upstream and downstream FIs were defined as the sum over all other 634
bins at a distance below 600 kb of the resulting signals. We then computed the 635
profile of upstream and downstream FIs. We considered peaks that are located 636
above the median of the peak values plus two times the standard deviation 637
(estimated by the 1.48 times the median absolute deviation to mitigate the impact of 638
outliers). These statistics were computed separately for the left terminal arm, the 639
central region and the right terminal arm as these compartments have distinct 640
27 statistical 3C-seq features. Altogether, this led us to a list of significant upstream 641
(orange) and downstream (green) peaks, respectively. 642
A boundary was then allocated to any bin (as well as to pairs of consecutive bins 643
to cope with uncertainty of peak positions) for which both the upstream and 644
downstream peaks were significant. To analyze the genetic environment associated 645
with a boundary, we considered the environment around the boundary identified by 646
the frontier index (± 2 bins). Note that due to intrinsically noisy nature of 3C-seq data, 647
we detected bins with only an upstream or a downstream significant peak 648
(Supplementary Fig.3.D). These bins with an ‘orphan’ peak were not associated 649
with a boundary, and hence, were removed from the analysis. 650
The dispersion index
651
The dispersion index of a signal reflects the range of variations relative to the 652
mean value of the signal. Here, we compute it for the frequency of contacts. More 653
precisely, it is defined as: I(s) = var(s)/P(s),where P(s) and var(s) are, respectively, 654
the mean value and variance of the frequency of contacts between bins separated by 655
the genomic distance. These quantities are then computed separately in each 656
compartment of the genome. The larger the dispersion index is, the more variable are 657
the contact frequencies within a compartment. 658
Statistical procedure
659
Data were analyzed with R software67. For the RNA-seq analyses, three independent 660
experiments (performed on different days) were carried out for each studied 661
condition, except for C3, C9 and C10 that were performed in duplicate and C5 in 662
quadruple. The statistical significance of RNA-seq analysis was assessed using the 663
SARTools DESeq2-based pipeline66. For the 3C-seq analyses, two independent 664
experiments (performed on different days) were carried out for each condition. To 665
28 quantify gene regionalization, we defined the left and right terminal arms using as 666
limits the first (genome position: 1,469,670-1,474,823 bp) and last (genome position: 667
5,802,471-5,807,629 bp) rDNA operons, respectively. The statistical significance was 668
assessed by means of Fisher's exact test for count data, which is appropriated to the 669
analysis of contingency tables. 670
Data availability
671
The datasets generated during this study have been deposited in the NCBI Gene 672
Expression Omnibus (GEO, https://www.ncbi.nlm.nih.gov/geo/) under the accession 673
number GSE162865. 674
List of abbreviations 675
3C: Chromosome Conformation Capture 676
“Actino. Sign.”: Actinobacterial Signature 677
BGC: Biosynthetic Gene Cluster 678
CDS: coding sequence 679
CID: Chromosome Interacting Domain 680
GI: Genomic island 681
IGV: Integrative Genomics Viewer 682
LHEG: long and highly expressed genes 683
NAP: Nucleoid Associated Protein 684
NAPSFs: Nucleoid Associated Proteins and structural factors 685
PCA: Principal Component Analysis 686
rDNA: ribosomal RNA encoding DNA 687
RPK: Read per kb 688
SARTools: Statistical Analysis of RNA-Seq data Tools 689
SMBGC: Specialized Metabolite Biosynthetic Gene Cluster 690
29 TIR: Terminal inverted repeat
691
VST: Variance Stabilizing Transformation 692
693
Acknowledgments 694
We acknowledge the High-throughput sequencing facility of I2BC for its sequencing 695
and bioinformatics expertise. We thank Barry Holland and Christophe Possoz for 696
careful reading of the manuscript and the members of F. B. and S. L. for fruitful 697
discussions and advice. 698
699 700
30 Figure legend
701
Figure 1: The genetic compartmentalization of S. ambofaciens linear 702
chromosome 703
The terminal inverted repeats (TIRs, 200 kb) and the origin of replication (oriC) are 704
indicated in black. The distribution of gene presenting features of interest are 705
represented in blue or red when enriched in the central region or within the extremities 706
(defined by the first and last rDNA operons), respectively (see Supplementary Table 707
3 for a statistical analysis of the data). The dot and asterisk indicate the position of
708
pSAM2 and of a complete prophage, respectively. The position of the SMBGC 709
encoding the biosynthesis of all known antibacterial compounds of S. ambofaciens 710
ATCC 23877 is also indicated. The level of synteny along the chromosome of S. 711
ambofaciens ATCC 23877 is represented as a heat map of GOC (Gene Order
712
Conservation) scores using a sliding window (8 CDSs with 1 CDS steps). Each line 713
corresponds to the GOC profile of the reference against another species. The species 714
are organized from the phylogenetically closest to the furthest compared to S. 715
ambofaciens. The vertical black dotted line represents the location of the dnaA gene
716
delineating the two replichores. “NA” (in yellow) indicates the absence of orthologs in 717
the corresponding window. S. ambofaciens ATCC 23877 also harbors a circular 718
pSAM1 plasmid (≈ 89 kbp). 719
Abbreviations: ‘Actino. Sign. CDSs’ (coding sequences of the actinobacterial 720
signature); BGC (biosynthetic gene cluster); ‘C.’ (congocidine BGC); ‘Chr.’ (whole 721
chromosome); GIs (genes belonging to genomic islands); ‘K.’ (kinamycin BGC); 722
‘Persist.>0.95 CDSs’ (coding sequences of S. ambofaciens ATCC 23877 presenting a 723
gene persistence superior to 95 % in 124 other Streptomyces genomes); ‘Transl. 724
CDSs’ (genes encoding functions involved in translation process and/or RNA stability); 725
31 NAPSFs (nucleoid associated proteins and structural factors); SMBGCs (specialized 726
metabolite BGCs); ‘Sp.’ (spiramycin BGC); ‘St.’ (stambomycin BGC); ‘rRNA’ 727
(ribosomal RNA). 728
729
Figure 2: Transcriptome dynamics depending on genome features and 730
metabolic differentiation 731
A. Transcriptome changes over growth. Heatmaps of the normalized number of 732
reads per gene, ranked by their expression level at 24 h. 733
B. Transcription along the chromosome over growth. The normalized counts
734
(DESeq2 analysis) were mapped on S. ambofaciens chromosome. The two 735
clusters to which the different conditions belong were obtained by hierarchical 736
classification (Extended Data Fig.1C). Whereas the cluster 1 corresponds to 737
exponential phases (no ATB production), the cluster 2 gathers conditions 738
associated to the activation of SMBGC encoding at least two known antibacterial 739
activities (Supplementary Fig.2). ‘C1’ to ‘C7’ refer to the name of the studied 740
conditions: C1 to C5, cells grown in MP5 during 24 h, 30 h, 36 h, 48 h and 72 h, 741
respectively; C6 and C7: cells grown in YEME during 24h and 48h, respectively 742
(see Table 1, for details). 743
C. Boxplot presenting the mean level of gene expression depending on 744
features of interest. The distribution of the number of counts (normalized by 745
DESeq and on gene size) as the mean of all studied conditions is presented 746
depending on the genome features of interest (see the legend of Figure 1 for 747
abbreviations). For clarity, outliers were excluded from this graphical 748
representation (but were taken into account for the numerical exploitation of the 749
data). The significant differences by Wilcoxon rank sum test with continuity 750
32 correction compared to the chromosome (‘Chr.’) are indicated by asterisks (**, 751
p< 0.01, ***, p< 0.001). Other abbreviation: ‘Func. RNA (-rRNA)’ (Functional
752
RNA excluding rRNA) 753
754
Figure 3: Spatial organization of S. ambofaciens chromosome and 755
transcriptome in absence of metabolic differentiation 756
3C-seq and RNA-seq were performed on S. ambofaciens grown in exponential phase 757
in YEME medium (24 h, C6 condition). The normalized contact map was obtained from 758
asynchronous populations. The x and y axes represent the genomic coordinates of the 759
reference genome. To simplify the analyses, TIRs were removed from the reference 760
genome. In panel A, the colour scale reflects the frequency of the contacts between 761
genome loci, from white (rare contacts) to dark purple (frequent contacts). In panel B, 762
the frontier index analysis is able to detect, for a given genome 10 kb bin, the change 763
in the contact bias with their neighbouring bins. Thus, a boundary is defined as any bin 764
in which there is a change in the right bias of contacts towards the left bias (± 2 bin, 765
green and orange peaks, respectively). Red and black circles indicate the position of 766
rDNAs and highly expressed genes (HEGs), respectively. In panel C, the normalized 767
counts (DESeq2 analysis) measured in cells grown in the same condition were mapped 768
on S. ambofaciens chromosome and binned in 10 kb. The panel D highlights genomic 769
and transcriptional features of interest. The right and left compartment were defined 770
owing the outer boundaries of the central compartment, which correspond to the first 771
and last rDNA operon position. The ‘synteny-break’ right arm corresponds to the 772
beginning of the spiramycin BGC. The replicate of this experiment is presented in the 773
Supplementary Fig. 3.A.
774 775
33 Figure 4: Chromosome remodeling during metabolic differentiation
776
A. 3C-seq and RNA-seq performed after 24 h in MP5 growth medium (C1 777
condition). Same legend than Figure 3. The replicate of this experiment is 778
presented in the Supplementary Fig. 3.B. 779
B. Level of gene expression depending on gene location within boundaries 780
or domains. The box-plot presents the sense-transcription (normalized number of 781
read per Kb) depending on gene location in exponential phase either in MP5 (C1) 782
or in YEME (C6), or after 48 h of growth in MP5 medium (C4). Boundaries in 783
common between MP5 24 h and YEME 24 h conditions (‘Common C1 & C6’) were 784
also analyzed separately. The significant differences by Wilcoxon rank sum test 785
with continuity correction (boundaries versus domains) are indicated by asterisks 786
(**, p < 0.01; ***, p < 0.001). 787
C. Level of gene persistence depending on gene location within boundaries 788
or domains. The box-plot presents the persistence index depending on gene 789
location in exponential phase (C1: MP5; C6: YEME) or after 48 h of growth in MP5 790
medium (C4). Boundaries in common between MP5 24 h and YEME 24 h 791
conditions (‘Common C1 & C6’) were also analyzed separately. The significant 792
differences by Wilcoxon rank sum test with continuity correction (boundaries versus 793
domains) are indicated by asterisks (***, p < 0.001). 794
D. Dispersion index of the left, central and right compartments plotted as a 795
function of genomic distance. The index of dispersion (Var(s)/P(s)) reflects the
796
range of variations relative to the mean value as a function of the genome distance 797
for the contact maps obtained for cells grown 24 h and 48 h in MP5 medium. Long-798
range DNA contacts within the terminal compartments (> 100 kbp) are more 799
variable than within the central compartment. 800
34 E. 3C-seq and RNA-seq performed after 48 h in MP5 growth medium (C4 801
condition). Same legend than Figure 3. The arrow indicates the position of the 802
congocidine biosynthetic gene cluster (BGC). The replicate of this experiment is 803
presented in the Supplementary Fig.3.C. 804
F. Schematic representation of genome dynamics during metabolic 805
differentiation. The Streptomyces linear chromosome is represented as dark gray 806
(central compartment) and dark red sticks (left and right compartments). The origin 807
of replication is indicated as a light yellow circle (oriC). In exponential phase, the 808
chromosome of Streptomyces is organized into one transcriptionally active (light 809
green) central compartment and two rather silent compartments (pink grey). The 810
transcriptionally active compartment is enriched in core genes and is segmented in 811
multiple domains, flanked by long and highly expressed conserved genes. The low 812
frequency of contacts between the two arms is represented as an open 813
conformation of the chromosome. After 48 h of growth, the transcription of the 814
congocidine cluster is accompanied by a global remodeling of the chromosome. 815
The increase in the frequency of contacts between the two chromosomal regions 816
around the origin is represented as a closed conformation. Interestingly, a slight tilt 817
on the secondary diagonal towards the ends of the chromosome shows an 818
asymmetry between contacts within the terminal ends that was not schematized in 819
the figure. In addition, since TIRs cannot be distinguished at the sequence level, 820
they were neither considered in this analysis nor represented in this figure. However 821
they may be located close to each other74, although this remains controversial75. 822
823 824 825