Publisher’s version / Version de l'éditeur:
Vous avez des questions? Nous pouvons vous aider. Pour communiquer directement avec un auteur, consultez la première page de la revue dans laquelle son article a été publié afin de trouver ses coordonnées. Si vous n’arrivez pas à les repérer, communiquez avec nous à [email protected].
Questions? Contact the NRC Publications Archive team at
[email protected]. If you wish to email the authors directly, please see the first page of the publication for their contact information.
https://publications-cnrc.canada.ca/fra/droits
L’accès à ce site Web et l’utilisation de son contenu sont assujettis aux conditions présentées dans le site LISEZ CES CONDITIONS ATTENTIVEMENT AVANT D’UTILISER CE SITE WEB.
Canadian Aeronautics and Space Institute AERO '09 Conference Aerodynamics
Symposium [Proceedings], 2009
READ THESE TERMS AND CONDITIONS CAREFULLY BEFORE USING THIS WEBSITE.
https://nrc-publications.canada.ca/eng/copyright
NRC Publications Archive Record / Notice des Archives des publications du CNRC :
https://nrc-publications.canada.ca/eng/view/object/?id=2c4c7828-10d2-465e-95be-467d03da751a https://publications-cnrc.canada.ca/fra/voir/objet/?id=2c4c7828-10d2-465e-95be-467d03da751a
NRC Publications Archive
Archives des publications du CNRC
This publication could be one of several versions: author’s original, accepted manuscript or the publisher’s version. / La version de cette publication peut être l’une des suivantes : la version prépublication de l’auteur, la version acceptée du manuscrit ou la version de l’éditeur.
Access and use of this website and the material on it are subject to the Terms and Conditions set forth at
Boundary layer behaviour on a morphing airfoil: simulation and wind
tunnel tests
Sainmont, Corentin; Paraschivoiu, Ion; Coutu, Daniel; Brailovski, Vladimir;
Laurendeau, Eric; Mamou, Mahmoud; Mebarki, Youssef; Khalid, Mahmood
Canadian Aeronautics and Space Institute AERO’09 Conference Aerodynamics Symposium
Boundary Layer Behaviour on a Morphing Airfoil: Simulation
and Wind Tunnel Tests
Corentin Sainmont, Ion Paraschivoiu
M. A. Sc. Student / Professor, École Polytechnique de Montréal, [email protected].
Daniel Coutu, Vladimir Brailovski
Ph.D. Student / Professor, LAMSI, École de Technologie Supérieure de Montréal.
Eric Laurendeau
Ph.D. CFD Group Leader Advanced Aerodynamics, Bombardier Aerospace, Montréal.
Mahmoud Mamou, Youssef Mébarki, Mahmood Khalid
Institute of Aerospace Research – National Research Council Canada (NRC), Ottawa.
ABSTRACT
This paper presents the boundary layer transitional flow behaviour past a morphing experimental wing. The objective of the present investigation is to reduce aerodynamic drag through laminar-turbulent transition location delay to promote large laminar region on the wing surface. The airfoil shape configurations of the adaptable part of the wing were optimized to extend the laminar flow on the upper surface of the airfoil. The optimizations were preformed with two different approaches. The classical approach uses a mathematical curve to model the flexible part. The multidisciplinary approach integrates the finite element model of the adaptable wing structure into the aerodynamic optimization process. The latter approach avoids the difficult task of reproducing the geometric representations of the airfoils, leading to the optimum performances offered by the morphing wing system. The optimizations are performed for various subsonic incompressible regimes using the computational fluid dynamics code Xfoil (Drela 2006) and the structural analysis software ANSYS coupled with a genetic optimization algorithm (Genial v1.1). Simulation and experimental results are presented and show that the morphing system is able to delay the transition location downstream by up to 30% of the chord length and to reduce the airfoil drag by up to 22%. Infra red maps and unsteady pressure frequency spectra measured on of the upper surface of the wing are also presented and show the laminar run extension.
INTRODUCTION
The main stages of transport aircraft flights are take-off, climb, cruise and landing. At each of these stages the aircraft is required to fly under different conditions and under safety and fuel consumption constraints. As the conditions change, a single aerodynamic configuration cannot be optimized for various flight conditions. In practice, the wing airfoil section is designed for cruise (high speed design), and then the airfoil is adapted with flaps and other retractable aerodynamic elements to enable take-off, climb and landing (low speed design). In the case of long-range aircraft, the cruise phase is the most important in terms of fuel consumption and thus has the greatest potential for improvement. This phase is characterized by the speed, altitude and weight of the aircraft. Because an aircraft can be used for different purposes, these characteristics are variable from one mission to another. Even during the same flight, the weight is continuously changing because the fuel stored in the aircraft is being consumed. For the cruise phase, the designers of the aircraft would find a compromise within the substantial range of flight conditions. A compromised design may be optimum for an average flight condition but there would be high savings in operating costs if the aerodynamic performance was optimal at all times during the cruise phase, which is the main objective of the morphing airfoils. The possibility of changing the airfoil shape allows the control of the laminar boundary layer. By extending the range of the laminar region over the wing surface, the friction drag, representing about 50% of the total drag, in subsonic flight, can be reduced substantially. Understandably, since the engine thrust must compensate for the aircraft drag to maintain the cruise speed, the morphing system will decrease the fuel consumption, operating costs, and carbon dioxide emissions while increasing the range of the aircraft.
The aim of the project is to show that laminarity of the boundary layer can be controlled by a real-time adaptable wall technique during a wind tunnel test. The research project is limited to 2-dimensional subsonic incompressible flow (Mach numbers from 0.2 to 0.35), and concentrates on cruise phase conditions (involving low angles of attack: -1 to 2 degrees). The morphing wing to be tested in the wind tunnel requires a controller, a database containing aerodynamic conditions and the corresponding optimum configurations. Because the actuation of the morphing wing system should not affect the flight aerodynamic performance, the morphed wing would have the same lift coefficient as the non-morphed wing. In other words, the optimizations of the airfoil have to be performed at given lift coefficients. In this paper, two different theoretical approaches are explored to find the optimum wing configurations for low drag performance. Also, wind tunnel experiment is performed to validate the two approaches.
OPTIMIZATION APPROACHES
BASIC CONCEPT OF AIRFOIL SHAPE OPTIMIZATION
The optimization of an airfoil shape can be realized with an optimization algorithm, a model of the morphing part of the airfoil and an aerodynamic solver. The optimizer provides a set of variables to be tested. The variables represent a configuration for the adaptable shape and allow a model of the morphing system to generate the airfoil geometry that corresponds to the configuration. The aerodynamic solver calculates the flow over the airfoil and returns the performance to the optimizer. After a sufficient number of evaluations, the optimization algorithm leads to an optimum configuration. CLASSICAL APPROACH
A classical method for optimizing the shape of the morphing wing would be to optimize the airfoil geometry using a mathematical representation of the flexible part such as Bspline or NURBS curves. The advantage of this approach is that the design and the numerical model of the morphing system are not required. The airfoil geometries obtained from this approach were used to give the design envelope of possible shapes. The disadvantage of this approach is that it is difficult to reproduce the optimized geometry using the morphing wing system due to structural constrains. As the boundary layer is very sensitive to small variations in the curvature of the airfoil, the airfoil produced is of lower performance than mathematical representation.
MULTIDISCIPLINARY APPROACH
The multidisciplinary approach is based on the integration of the aero-structural model of the morphing system into the optimization process. The difficult task of reproducing optimum geometry is then eliminated because the configuration settings of the morphing wing become the optimization variables. The multidisciplinary approach leads to the best shapes that the system can produce. The two major inconveniences are the necessity of an accurate aero-structural model and the large computation efforts required to run the aero-structural calculation for each evaluation [6].
WIND TUNNEL MODEL
The 2D base (reference) airfoil of the experimental morphing laminar wing is the WTEA airfoil which is similar to a family of natural laminar flow-capable, supercritical airfoils [1] having a maximum thickness/chord ratio of 16%. The wind tunnel model is a rectangular plan form wing designed to span the test section and has an aspect ratio of 2.
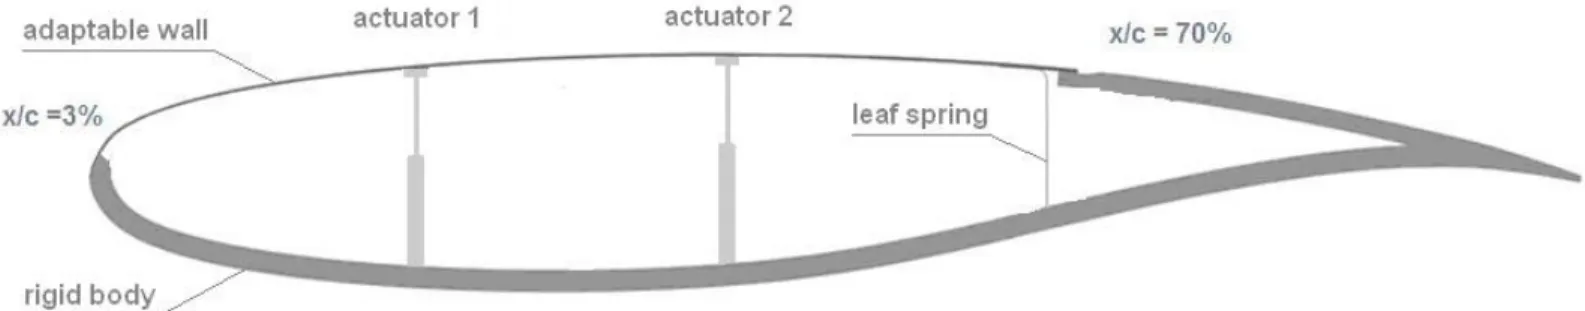
As the flow laminarity is expected to cover most of the upper surface of the airfoil, the adaptable wall was designed to cover this region from 3% to 70% of the chord length (Fig. 1).The morphing behaviour of the upper surface is provided by two shape memory alloys actuators (SMA) located inside the wing box at 25.3% and 47.6% of the chord. The overall stiffness and integrity of the experimental wing is provided by the rigid wing body. The front and rear edges of the adaptable wall are connected to the rigid body in such a way that ensures profile tangency continuity, accommodates shape modifications and sustains aerodynamic forces. The result is a flush-glued joint near the leading edge and a sliding-plane link at the aft end including a compensation spring leaf placed between flexible and rigid structures (Fig.1). The morphing wing works as follows: according to the flow condition changes, a controller commands the actuators to modify the profile to increase the laminarity of the boundary layer. Finding the optimum configuration for the airfoil shape for given flight conditions is a difficult task. Numerical calculation of the shape, flow analysis and an optimization algorithm must be run. As this task involves computational effort, the methodology is to build a database in which the optimal configurations for wind tunnel flow conditions are saved.
SIMULATION TOOLS
STRUCTURAL MODEL OF THE WING
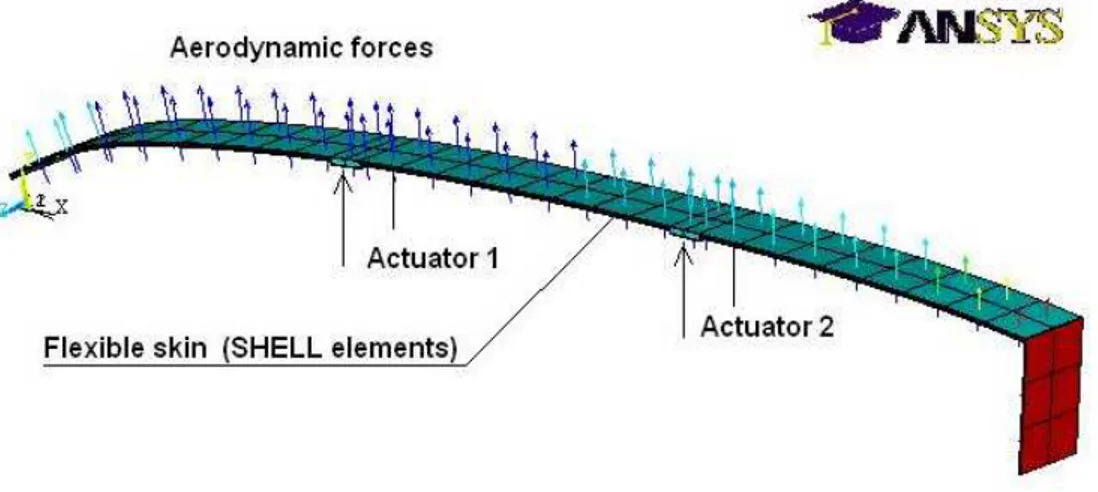
The design has been done by the École de Technologie Supérieure of Montreal. To assist the design the CAD software CATIA V5 has been used. A low-modulus unidirectional carbon and 2 x 2 twill woven hybrid carbon/Kevlar composite laminate has been chosen for the adaptable wall. The ANSYS finite element package was used to build a model for the behaviour of this composite skin. The model has been previously validated in its ability to evaluate wing shape change and force against actuator stroke [2]. Using this, FE analyses identified the two most important design variables: the number of plies and the number of actuators. Considering maximization of the laminar flow due to wing morphing and minimization of the strain energy required for this morphing as two design objectives, a multi-criteria optimization led to the selection of a design arrangement of the active structure: number of composite plies and actuators [3].
Figure 2: Finite element model of the active structure.
AERODYNAMIC SOLVER
The flow analyzer is a panel method coupled with a viscous boundary layer correction (Xfoil code). The code Xfoil was developed by Mark Drela in the 1980’s to analyse and design subsonic airfoils. During the viscous calculation Xfoil predicts the laminar to turbulent transition location using the eNmethod (Cebeci, Shao et al. 2005). The critical value of N
(Ncrit) has a great influence on the prediction of the transition and it is strongly related to the level of turbulence in the free stream flow. For an aircraft in the atmosphere the value of Ncrit is around 12 to 14. For a wind tunnel Ncrit is much smaller (6 to 8). In the present investigation, the value of Ncrit was set to 7 to match the turbulence level T=0.14% measured in the wind tunnel. The drag coefficient Cd is obtained by applying the Squire-Young formula at the last point in the wake [4]. The Cd calculated by Xfoil is then a total viscous drag that is influenced by the transition location.
Xfoil code was chosen because it allows a fast calculation of the flow and provides acceptable accuracy. The rapidity of the flow analysis is crucial while using an optimization algorithm because of the large number of tests. Moreover, Xfoil is able to run calculations at a given lift coefficient which allows the angle of attack to be a result of the analysis rather than an additional variable in the optimization.
COUPLED AERODYNAMIC AND STRUCTURAL SOLVER
The morphing part of the airfoil is structurally flexible. The deformations due to aerodynamic load, essentially the pressure distribution, are not negligible. As the stability of the boundary layer is very sensitive to small changes in shape, the aero structural resolution of the flow is necessary to estimate the real performance of the wing configurations. Using a batch file called by a user function, the ANSYS model launches the flow analyser Xfoil with a first calculation of the geometry. Xfoil calculates the flow and returns the pressure distribution to ANSYS (Fig. 2). A new structural analysis of the skin deformation is done using the updated pressure load. This process is repeated until convergence of the geometry is reached. A small number of iterations were necessary and the use of relaxation methods is not relevant. Five iterations were sufficient for an acceptable level of convergence for the severe aerodynamic load case corresponding to Mach=0.35 and cl=0.6006 (Fig. 3). 1.44 1.46 1.48 1.50 1.52 1.54 1.56 1.58 0 5 10 15 20 Iteration number M a x . a b s . S h a p e d e v . 0.20 0.24 0.28 0.32 0.36 0.40 0.44 0.48 Deviation Top_Xtr
Figure 3: Aero-structural convergence of the active structure for Mach=0.35 and cl= 0.6006 with actuator stroke Y1= 5.90 mm and Y2= 6.77 mm.
0.0 0.1 0.2 0.3 0.4 0.5 0.6 0.7 0.8 0.9 1.0 0 0.02 0.04 0.06 0.08 0.1 0.12 0.14 0.16 0.18 0.2
Simple aerodynamic simulation Aero-structural simulation Actuators
Pressure distribution
-Cp
airfoil geometry
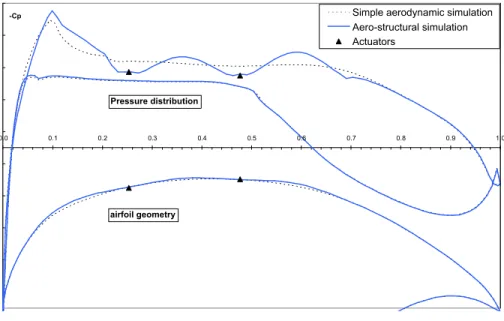
Figure 4: Simple aerodynamic simulation and aero-structural simulation (pressure distribution and geometry) of the un-morphed wing, Mach=0.35 and Cl= 0.3215.
Figure 4 shows the difference between a simple aerodynamic simulation and an aero-structural simulation. The distortion of the flexible skin due to the pressure difference between the wing interior (atmospheric pressure) and the exterior is clearly identifiable. When the aerodynamic load is applied, three bumps appear on the airfoil surface between the four attachment interstices. This deformed shape has a large impact on the velocity profile because it accelerates and decelerates the flow as it passes over the upper surface. As a result of this change in velocity, the pressure distribution exhibits the same three bumps.
OPTIMIZATION TOOL CODE ARCHITECTURE
The main code is subdivided into three programs. The first part performs the pre-optimization work; using the given flight conditions, the aerodynamic performances of the reference airfoil are calculated with Xfoil. The information is written into a text file for future statistical purpose and the lift coefficient is saved as a reference lift coefficient (clrf). To complete the
statistical data, an aero-structural calculation is done at the clrf on the un-morphed airfoil (zero displacement of the
actuators). This ends the pre-optimization subroutine. The clrf is transferred to optimizer. This second subroutine of the
code is composed of the optimization algorithm coupled with the aero-structural analyser and a performance calculator function. The optimization algorithm provides solutions to be tested. The aero-structural analyser calculates the aerodynamic performances of the wing configuration and provides the data to the performance calculator. The performance, called fitness when using genetic algorithm, is returned to the optimization algorithm. The optimizer used the fitness of each tested individual to provide the new set of variables and to progress towards the global optimum individual. Once the optimizer converges to an optimum or has completed the maximum number of evaluations, the optimization process stops and the best set of variables is sent to the last subdivision of the code for post optimization operations. During this third part, a detailed aerodynamic analysis is completed on the optimum configuration, and output files are written.
OPTIMIZATION ALGORITHM
The optimizer used is a genetic algorithm-based optimization code (Genial, developed in 1998 by Henrik Widell). Genetic algorithms are efficient and well known for their abilities to find global optimum. They use techniques inspired by evolutionary biology such as inheritance, mutation, selection and crossover. The vocabulary used to describe genetic algorithms is related to human evolution. An “individual” is a set of variables that define one possible solution, a “population” regroups individuals and a “generation” represents the individuals at a given time. To start the research of the optimum, Genial generates randomly an initial population. Each individual is analysed and the performance, also called fitness, is evaluated. Once the initial population is built, the algorithm repeats the following steps until termination (convergence or limited number of evaluations):
Select the best individuals to reproduce
Build a new generation through crossover and mutation, and gives birth to the offspring Evaluate the individual fitness of the offspring
Replace the worst individuals of the population with offspring OPTIMIZATION SETTINGS
A wing configuration is defined by the following variable: Mach number (M), Reynolds number (Re), angle of attack (AoA), first actuator displacement (Y1) and second actuator displacement (Y2). The flight conditions for which the morphing wing is optimized are defined by M, Re and a lift coefficient (Cl). Since Xfoil is able to run a calculation at a given Cl, the AoA is obtained as a result of the aero structural analysis. The remaining variables Y1 and Y2 (actuator positions) are the optimization variables. Because the actuators have limited displacement capabilities, the research area for these two variables is constrained.
The objective of the optimization is to reduce the drag by increasing the laminar run over the airfoil. Since Xfoil takes the friction drag into account in the calculation of the total Cd, it was found that a fitness function based on the total drag was an efficient way of reducing the friction drag by increasing the extent of the laminar zone while keeping the pressure drag low.
The following fitness function was used:
f
C
dFor the optimization the initial population size used was made of 30 “individuals” and the maximum number of evaluations was set to 400. This setting allows at least 12 generations, however, in most of the cases an optimum was found before the 6thgeneration.
OPTIMIZATION RESULTS
The optimization codes based on both the classical and the multidisciplinary approach appeared to be very robust and were able to find an optimum solution for the database cases. A case is defined by aerodynamic conditions: flow speed and lift coefficient. The flow speed is represented by the Mach number. Since the wind tunnel used is not pressurized, the Reynolds number is directly associated to the Mach number. To be able to assess the reduction in drag, the optimizations were processed for given lift coefficients. The lift coefficients, used to define the optimization cases, correspond to the lift coefficients of the un-morphed (original) airfoil at given angle of attack from -0.5° to 2°.
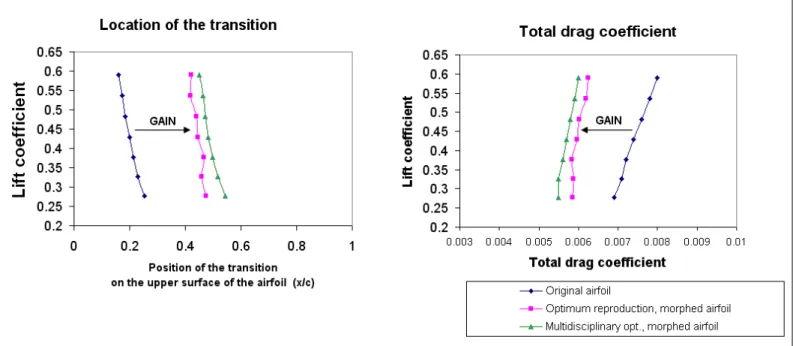
The optimum solution shows sizable reductions in drag and an increase in the laminar boundary layer range. The gain is greatest for lift coefficients that imposed higher angles of attack: a reduction of 25% in the total drag and a laminar boundary layer covering an additional 29% of the airfoil chord. The results obtained using the multidisciplinary approach are 3 to 5% better than the results obtained from the classical approach. Figure 5 shows comparisons between unmodified airfoil (“reference airfoil”) and modified airfoils from the classical and multidisciplinary methods. The left-hand graph of Fig.5 shows the extent of the laminar region (transition from laminar to turbulent moving downstream). The right-hand graph shows the decrease in the total drag.
Figure 5: Flow laminarity extent and drag coefficients for un-morphed and morphed airfoils, Mach = 0.275, Re = 3.1 million.
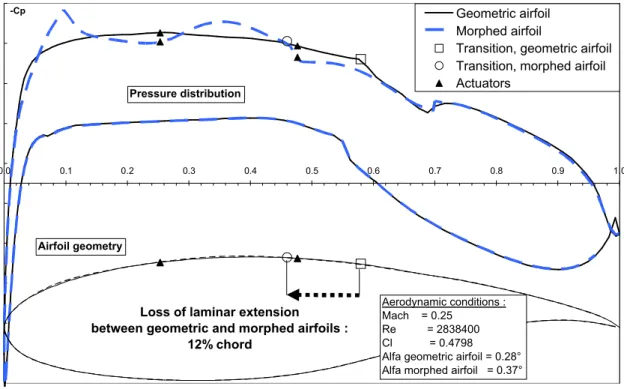
For the classical approach, optimum geometric airfoils were found using a BSpline model of the flexible part [5]. The laminar run over the upper surface of these airfoils was extended to an average of 60% of the chord length. The morphing wing model, to be tested in the wind tunnel, was designed with a flexible skin and two actuators. Using the aero-structural model of the wing, the performance of the system could be evaluated in the morphed shape under aerodynamic loads. The aerodynamic load affects the shape of the adaptable skin. The small displacements create changes in the curvature and cause fluctuations of the pressure. The disturbed pressure distribution creates instabilities within the boundary layer and larger unfavourable positive pressure gradients. For theses reasons the laminar to turbulent transition appears earlier. Figure 6 shows the pressure distribution for the geometric optimum and the morphing wing. In the case presented, the inability to accurately reproduce the shape causes a loss of 12% chord of laminar run. The multidisciplinary approach to optimization used reduces the improper reproduction error inherent to the classical approach.
0.0 0.1 0.2 0.3 0.4 0.5 0.6 0.7 0.8 0.9 1.0 -0.08 0.02 0.12 0.22 0.32 0.42 Geometric airfoil Morphed airfoil
Transition, geometric airfoil Transition, morphed airfoil Actuators
Pressure distribution
Airfoil geometry
Loss of laminar extension between geometric and morphed airfoils :
12% chord
Aerodynamic conditions : Mach = 0.25
Re = 2838400 Cl = 0.4798 Alfa geometric airfoil = 0.28° Alfa morphed airfoil = 0.37°
-Cp
Figure 6: Aero-structural results for the reproduction of the optimized geometry (coupled ANSYS/XFOIL simulation).
Figure 7 shows a comparison between the original airfoil, the geometric optimum airfoil and the morphed airfoils optimized using the two different approaches.
Figure 7: Simulations results of the pressure distributions and transitions locations (upper side), original airfoil, optimized (classical approach and multidisciplinary approach); M=0.275, Cl=0.375 (alfa~0°)
The pressure distribution on the upper surface of the un-morphed airfoil shows an important peak caused by a large acceleration of the flow after the leading edge. The pressure drop extends to 10% of the chord length. From 10% to 25% of the chord the pressure rises rapidly, creating instabilities within the boundary layer. Xfoil predicts the transition to appear at 21% of the chord which is 11% after the pressure peak. After multidisciplinary optimization the morphed solution shows an increase of the laminar run of 29% of the chord length. Analysis of the pressure distribution shows that the displacement of the flexible skin permits a reduction of the leading edge peak and the creation of a negative pressure gradient from 25% to 40% of the chord. These two combined effects delayed the transition behind the new favourable pressure gradient. The total drag coefficient was decreased by 22%. The optimized shape was obtained by setting the first actuator to 50% and the second to 90% of their maximal range. The augmentation of the thickness of the airfoil causes a trend to increase camber that increases the lift coefficient which is compensated for by a reduction in the angle of attack of 0.66°. This reduction of the airfoil incidence also has a beneficial effect on the pressure drag. In this case the augmentation of the pressure drag caused by the thickening of the airfoil is largely compensated by the diminution of the incidence because the calculation shows a diminution of the pressure drag of 30%.
WIND TUNNEL TESTS RESULTS
The wind tunnel tests were performed at the 2x3m atmospheric closed circuit wind tunnel of the Institute for Aerospace Research of the National Research Council Canada. The tunnel test section allows wind speed up to Mach=0.3 at atmospheric pressure. The wind tunnel model is a rectangular plan form wing consisting of rigid and flexible parts. The rigid body was equipped with static pressure taps. The upper surface flexible skin was instrumented with 16 Kulite transducers, for transition detection. The sensors were installed on a diagonal line in order to avoid turbulent contamination of the downstream sensors. The Kulite XCQ-062 series sensors are used and they are 0.066 inch in diameter. They did not contaminate the flow for the tests conditions, except when leaking problems occurred. The sensors have a 5 psi differential pressure range with infinitesimal resolution and a natural frequency range up to 150 kHz. They were installed within a cavity buried below the flexible skin surface and connected to the surface flow through a mall pressure tap of 0.020 inch, to avoid flow contamination. The data acquisition sampling rate was set to 10 kHz per channel over 16 channels due to acquisition system limitation of 160 kHz. The laminar to turbulent transition was detected by analysing the unsteady signal through Fast Fourier Transform (FFT) spectral decomposition. A rise in amplitudes of the signals in the neighbourhood of 4 kHZ frequency indicates the occurrence of the Tollmien-Schlichting waves that trigger the transition on the sensor location and subsequently the turbulent flow in the downstream of the sensor location. The RMS, which is the standard deviation of the pressure signal values with respect to the mean value for a high pass filtered signal at 1 kHz, was used as a quantifier of the pressure signal variations amplitudes [7].
In addition, infra-red camera visualizations were performed to detect the transition. The temperature differences detected by the infra red camera when the model is heated and cooled by the air flow allow the detection of the laminar boundary layer, the transition and the turbulent boundary layer. The temperature of the model where the boundary layer is turbulent is cooler because the thermal transfer between the model surface and the air is more efficient.
In the next section, the experimental results of three wind tunnel tests are presented. The three tests were performed at Mach 0.25, Reynolds number of 2.84 million and at lift coefficient 0.58 (corresponding to 2 degree incidence for the original airfoil). The morphing configurations tested are: (1) original un-morphed airfoil, (2) morphing airfoil with the configuration obtained using the classical approach for optimization and finally (3) the morphing airfoil with the configuration obtained using the multidisciplinary approach to optimization.
The transition was detected using the infra-red visualization for the original airfoil and for the multidisciplinary optimized airfoil. The temperature maps are presented in figure 8. For the airfoil optimized with the classical approach the transition was detected using the Kulites unsteady pressure measurements. The frequency spectra and RMS results are presented in figure 9.
Figure 8: Experimental visualization of the boundary layer using infra-red, left-hand side: original airfoil, right-hand side morphed airfoil optimized with the multidisciplinary approach
The infra-red maps show two dark V shapes which indicate turbulent wedge caused by leaking sensor or roughness. Also the SMA actuators that are at higher temperature can be clearly seen (25% chord and 48 % chord), as well as the two sensors diagonal lines. The laminar to turbulent transition line can be easily identified. The line is strait and parallel to the wing span which indicates that the flow has a 2 dimensional behaviour.
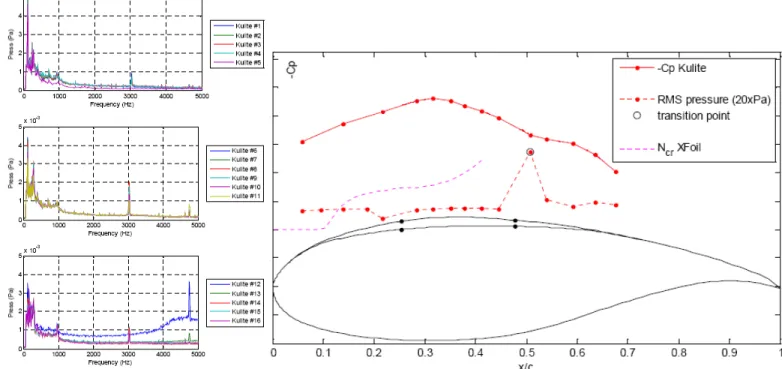
Figure 9: Experimental detection of the transition using Kulite transducers, morphed airfoil optimized with the classical approach.
Original airfoil
Transition:
25 % c
Morphed airfoil
Transition:
56 % c
The record of the unsteady pressure during the wind tunnel test of the morphed configuration (classical approach) is presented on the left-hand side of Fig. 9. The Kulite sensor number 12, placed at 51% of the chord length detected the transition. The augmentation of the fluctuations amplitudes clearly appeared on the frequency spectrum and the RMS curve present a net maximum for this sensor. Finally the pressure distributions were measured and three configurations were compared as shown in Fig. 10.
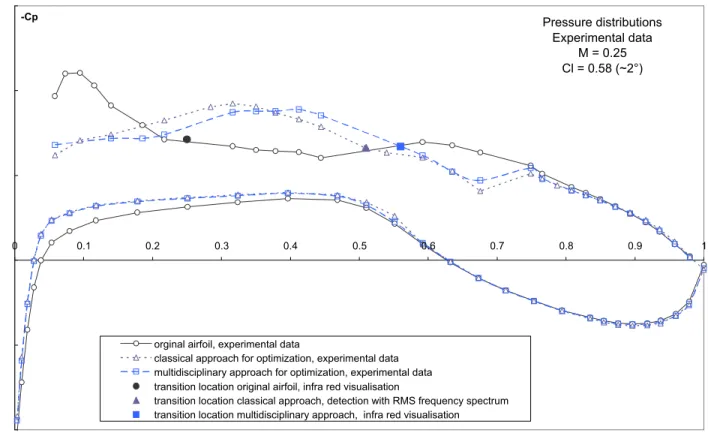
Pressure distributions Experimental data M = 0.25 Cl = 0.58 (~2°) -1.5 -1 -0.5 0 0.5 1 0 0.1 0.2 0.3 0.4 0.5 0.6 0.7 0.8 0.9 1
orginal airfoil, experimental data
classical approach for optimization, experimental data multidisciplinary approach for optimization, experimental data transition location original airfoil, infra red visualisation
transition location classical approach, detection with RMS frequency spectrum transition location multidisciplinary approach, infra red visualisation
-Cp
Figure 10: Experimental measurements of the pressure distributions and transitions locations (upper side), original airfoil, optimized (classical approach and multidisciplinary approach)
The experimental pressure distributions show the same trend as the simulation results. The original airfoil has the large pressure peak at the leading edge. The transition occurs at 25 % chord. The optimized airfoils have longer favourable pressure gradients, to 31% chord for the classical approach and to 41% chord for the multidisciplinary approach. As predicted, the multidisciplinary approach is superior, transition occurring at 56% chord as opposed to 51% chord for the classical approach.
CONCLUSION
The objective of the present investigation was to study the behaviour of the boundary layer for a morphing airfoil and find optimum configurations to extend the laminar run to reduce the drag. A classical and a multidisciplinary approach were explored to build an efficient optimization tool. The multidisciplinary approach was found to perform very well by adding a laminar run of 5% chord on average. The optimized morphing wing configurations resulted in a significant augmentation of the laminar run (additional laminar run of 28% of the chord length) which in turn reduced the drag (22%) compared to the un-morphed wing results. Because a major part of the airfoil is composed of a flexible skin, the geometry is highly dependent on flow conditions and structure behaviour. These two aspects were closely studied in a multidisciplinary approach joining the aerodynamic and structure teams. Finally, experimental validations were performed in wind tunnel and showed the effectiveness of the morphing airfoil concept, which shows a strong confidence in the predictions of the two theoretical approaches.
ACKNOWLEDGEMENTS
The authors would like to thank Mr George-Henri Simon and Mr Philippe Molaret of Thales Aerospace Division Canada for the initiation, funding and support of this project. The authors are also grateful to the CRIAQ and NSERC for their financial support. The authors would like to thanks Brian Jahraus and Marc Genest from NRC for their help, support and assistance provided during the wind tunnel testing.
REFERENCES
1. Eggleston B.,Poole R.J.D, Jones,D.J. and Khalid M., “Thick supercritical airfoil with low drag and natural laminar flow,” Journal of Aircraft,Vol.24, No.6, 1987, pp. 405-411
2. Coutu, D., Brailovski, V., Terriault, P., and Fischer, C., “Experimental validation of the 3D numerical model for an adaptive laminar wing with flexible extrados”, Proc. of the 18th Int. Conf. on Adaptive Str. and Tech., 3-5 Oct. 2007. 3. Coutu, D., Brailovski, V., Terriault, P., “Optimised design of an active structure for an experimental morphing laminar
wing”, submitted to the Journal of Aerospace Technology and Science, January 2009.
4. Xfoil 6.94 User Guide, Mark Drela, MIT Aero & Astro Harold Youngren, Aerocraft, Inc. 10 dec 2001.
5. Pagès, L., Trifu, O., Paraschivoiu, I., “Optimized laminar flow control on an airfoil using the adaptable wall technique”, Proc. of the CASI Aero 2007 symposium, June 2007.
6. Sainmont, C., Coutu, D., Paraschivoiu, I., “Multidisciplinary approach for the optimization of a laminar airfoil equipped with a morphing upper surface”, Proc. of the NATO AVT-168 symposium on “morphing vehicles”, 20-23 Apr 2009. 7. Popov, A. V., Botez, R. M., ”Drag reduction by improving laminar flows past morphing configurations”, Proc. of the