ORIGINAL PAPER
On-line SPE LC-MS/MS for the quantification
of
Δ9-tetrahydrocannabinol (THC) and its two major
metabolites in human peripheral blood by liquid
chromatography tandem mass spectrometry
Stefan König&Beat Aebi&Stephan Lanz&
Martina Gasser&Wolfgang Weinmann
Received: 30 September 2010 / Revised: 12 January 2011 / Accepted: 22 January 2011 / Published online: 11 February 2011 # Springer-Verlag 2011
Abstract A universal and robust analytical method for the determination ofΔ9-tetrahydrocannabinol (THC) and two of its metabolites Δ9-OH)-tetrahydrocannabinol (11-OH-THC) and 11-nor-Δ9-carboxy-tetrahydrocannabinol (THC-COOH) in human whole blood was developed and validated for use in forensic toxicology. Protein precipita-tion, integrated solid phase extraction and on-line enrich-ment followed by high-performance liquid chromatography separation and detection with a triple quadrupole mass spectrometer were combined. The linear ranges used for the three cannabinoids were from 0.5 to 20 ng/mL for THC and 11-OH-THC and from 2.5 to 100 ng/mL for THC-COOH, therefore covering the requirements for forensic use. Correlation coefficients of 0.9980 or better were achieved for all three analytes. No relevant hydrolysis was observed for THC-COOH glucuronide with this procedure — in contrast to our previous GC-MS procedure, which obvi-ously lead to an artificial increase of the THC-COOH concentration due to the hydrolysis of the
glucuronide-conjugate occurring at high pH during the phase-transfer catalyzed methylation step.
Keyword THC . LC-MS/MS . On-line SPE . Quantification Introduction
Driving under the influence of drugs is considered a serious offense in many countries [1–8]. With a confirmed drug level concentration either in whole blood or serum, drivers will face a revocation of their driving license from one to several months depending on the legal decisions. The sentences differ from case to case depending on drug concentration, consumption of one or several drugs or combination with alcohol consumption. Accurate determi-nation of the drug concentration is therefore a key factor within the legal action.
In our laboratory, cannabis is the most frequently encountered illicit drug with increasing number of cases every year. In the past years, the control activity of police and the number of positive tests for cannabis during traffic controls or traffic accidents have increased. Switzerland, among various other countries, has defined a threshold value for Δ9-tetrahydrocannabinol (THC) concentration in venous blood of suspected drivers. The current threshold value (1.5 ng/mL of THC in whole blood) was introduced by a federal court decision in 2005. Whenever the police finds positive test results, during traffic controls or traffic accidents, which could indicate earlier consumption of cannabis, e.g., by urine or saliva drug test, the analysis of THC and its two main metabolites in blood is required by an analytical chromatographic technique such as GC or HPLC. The capacity of our existing and validated method based on GC-MS has been exceeded quite rapidly due to
Published in the special issue Forensic Toxicology with Guest Editors Frank T. Peters, Hans H. Maurer, and Frank Musshoff.
Electronic supplementary material The online version of this article (doi:10.1007/s00216-011-4708-x) contains supplementary material, which is available to authorized users.
S. König (*)
:
S. Lanz:
M. Gasser:
W. WeinmannInstitute of Forensic Medicine, University of Bern, Bühlstrasse 20,
3012 Bern, Switzerland
e-mail: [email protected] B. Aebi
Chemistry Department, Spiez Laboratory, Federal Office for Civil Protection, 3700 Spiez, Switzerland
the time consuming sample preparation and relatively long run time per injection (27 min in total) and the frequent preventative cleaning of the GC-MS instrumentation. In addition, it was not possible to measure several conse-cutive series of samples without user intervention. Taking this into consideration, a more automated and robust method for the existing GC-MS analysis was needed which could be in operation during days or even weeks without maintenance.
Methods based on HPLC combined with triple quadrupole mass spectrometry offer several advantages over GC-MS methods: sample preparation is straight forward, overall analysis times are generally shorter and robustness increases when changing from GC to HPLC separation since the HPLC injector port is less prone to accumulating interferences. In addition, the lipophilic portion of the cannabis extracts tends to remain on the GC column.
THC is just one of more than 60 cannabinoid ingredients found in hemp (Cannabis sativa). As a major difference to most other illicit drugs, cannabinoids do not contain nitrogen and therefore exhibit a lower ionization efficiency during the electrospray ionization. THC and its two major metabolites Δ9-(11-OH)-tetrahydrocannabinol (11-OH-THC) and 11-nor-Δ9-carboxy-tetrahydrocannabinol (THC-COOH), are as well lipophilic and polar. In recent years, several scientific papers have been published [ref.9– 31] on the determination and quantification of cannabinoids in biological samples.
Experimental Chemicals
Δ9-tetrahydocannabinol (THC), 11-OH-THC, 11-nor-Δ9-carboxy-tetrahydrocannabinol and their tri-deuterated internal standards [2H3]-Δ9-tetrahydocannabinol (d3-THC),
[2H3]-Δ9-(11-OH)-tetrahydrocannabinol (d3-11-OH-THC)
and [2H3]-11-nor-Δ9-carboxy-tetrahydrocannabinol
(d3-THC-COOH) were purchased from Cerilliant (Austin, TX, USA). Acetonitrile supra gradient grade was obtained from Biosolve (Chemie Brunschwig, Basel, Switzerland) and HPLC-grade water was produced in-house with a Milli-Q water system from Millipore (Billerica, USA). Formic acid (puriss p.a., 98%) and methanol (spectrophotometric grade, ≥99%) were pur-chased from Fluka Sigma Aldrich (Buchs, Switzerland).
Precision pipettes from Socorex Isba S.A. (Lausanne, Switzerland), Gilson (Mettmenstetten, Switzerland) and Vaudaux-Eppendorf (Basel, Switzerland) were used for handling of all solutions and all samples.
Preparation of calibration and quality control samples The working solutions for spiking of calibration and quality control samples were prepared in pure methanol in glass screw cap vials by using two different diluting cascades (one for calibration and one for quality control samples) starting from two different 1.0 mg/mL stock solutions (prepared from different lots) with working solutions ranging from 10μg/mL down to 0.025 μg/mL. Calibration samples were spiked at concentration levels of 0.5, 1.0, 1.5, 2.0, 5.0, and 10 and 20 ng/mL for THC and 11-OH-THC and 2.5, 5.0, 7.5, 10, 25, 50, and 100 ng/mL for THC-COOH. Blank blood was obtained from the blood donor center of Bern and the blood was tested before it was used. Calibration and quality control samples were prepared freshly for each sequence. The stability of working solutions was tested while stored at 6°C and was found to be stable for at least 6 months.
Sample preparation
For each sample (calibration, quality control, and unknown), 200μL of whole blood were transferred into a 2.0 mL microtube (Sarstedt, Nümbrecht, Germany) and spiked with 20μL of internal standard solution, containing 2 ng of d3-THC and d3-11-OH-THC and 10 ng d3-THC-COOH. For blank samples, 20μL of methanol was added instead.
Proteins were precipitated by adding 600 μL of acetonitrile into the microtubes, then mixed by vortexing for 5 min and finally centrifugated for 10 min at 13,000 rpm. The supernatant solutions were transferred into glass vials (1.5 mL, Infochroma, Zug, Switzerland) and evaporated at 50°C under a gentle stream of nitrogen. Eventually, 200μL of an acetonitrile/water/formic acid (60/ 40/0.1; v/v/v) solution were added to each vial and shaken for 1 min until dissolution of the residues was complete. Fifty microliters of the reconstituted solution were injected into the HPLC-MS/MS system. The concentration step was necessary due to the limited sensitivity of the mass spectrometer.
Chromatographic system
The prepared samples were injected onto a SPE column (Mercury Synergy, Polar RP, 20×2.0 mm, Phenomenex, Torrance CA, USA) with a diluting flow during the injection step in order to retain all three analytes on the trapping column. From a 100 μL autosampler loop, the samples were loaded with a 0.5 mL/min flow (acetonitrile/ water/formic acid, 30/70/0.01; v/v/v) onto the trapping column and diluted by a T-union with an aqueous flow of
0.3 mL/min (water + 0.1% formic acid) in order to maximize the loading and trapping step. Pump 5 was used for the dilution of the injection solution. The extraction and transfer over to the analytical column was performed using a linear gradient of aqueous formic acid as mobile phase A (water + 0.1% formic acid) and acetonitrile containing formic acid as mobile phase B (acetonitrile + 0.1% formic acid). The autosampler compartment was set to a temper-ature of 6°C.
Liquid chromatography equipment consisted of two solvent racks SRD-3200, two binary HPLC pumps HPG-3200A, an isocratic pump ISO-3000-SD, a heated column compartment TC-3100 with a built-in 10-port switching valve and an autosampler WPS-3200 TSL (Dionex, Olten SO, Switzerland). An additional column heater (Croco-Cil from Cluzeau Info Labo C.I.L., Courbevoi, France) was used to heat the analytical column. For the analytical separation, a 100×2.0 mm column with 3 μm particles (Luna C8 (II), Phenomenex, Torrance CA, USA) was used. All HPLC components, the valves and the mass spectro-meter were controlled by MDS Sciex Analyst software.
In Table 1, the gradient program for the two high pressure pumps and the diluting pump is illustrated. Both gradients were optimized for best sensitivity, to reduce matrix effects and to separate all interferences from the analyte peaks. An important point was the organic cleaning of the SPE column with mobile phase B from 13 to 14 min which prevents any accumulation inside the SPE column.
Mass spectrometry
A triple-stage quadrupole mass spectrometer with linear ion trap capability (3200 QTrap, Analyst software (version 1.4.1), Applied Biosystems/MDS Sciex, Rotkreuz, Switzerland) was used in selective reaction monitoring (SRM) scan mode for the mass spectrometric detection. Electrospray ionization was performed in positive ion mode for all three analytes and the following instrument parameters for ionization were used: ion source voltage, 5000 V; curtain gas, 25; gas 1, 60; and gas 2, 40 (arbitrary units for the gas settings).
Table 1 Gradient program for all HPLC pumps and events for the switching valve
Time (min) Pumps 1 and 2 (AC: analytical column) Pumps 3 and 4, pump 5 (SPE: trapping column)
Mobile phase B Flow Comments Mobile phase B Flow Flow Pump 5 Switching valve
% μl/min % μl/min μl/min
0.00 30 350 Start MS, start pumps 50 500 300 SPE→ waste
AC→ MS
(loading)
1.00 30 Start gradient 50 500 300 SPE→ AC → MS
(eluting) 1.20 ↓ 50 500 300 1.30 50 20 20 3.00 60 ↓ 8.00 85 9.20 85 9.21 97.5 12.60 97.5 12.70 97.5 100 1000 13.00 97.5 350 100 1000 SPE→ waste AC→ MS (Re-equilibrating) 13.01 30 350 100 1000 14.00 100 1000 14.01 50 1000 14.50 50 1000 14.60 50 500
The positioning of the spray needle was optimized to obtain best signal to noise ratios for the lowest calibration level for THC. Each of the three analytes were measured with two SRM transitions, whereas for the internal stand-ards only one transition was used. For the analyte transitions a dwell time of 50 ms was used while for the three internal standard transitions 25 ms dwell time was applied (resulting in approximately 13 data points per peak). The difference in dwell time was chosen in order to have better ion statistics around the LLOQ. In Table2, the detailed descriptions of the tuning parameters for each compound are shown. All calculations were performed on analyte to internal standard ratio using the MDS Sciex Analyst software. The second transition was used as a qualifier trace in order to confirm presence or absence of the analytes (see Electronic Supplementary Material). All SRM transitions were automatically optimized via software using the quantitative optimization algorithm of the MDS Sciex Analyst software. Ion source parameters were manually adjusted with loop injections by a standard solution containing all three analytes.
System suitability test
In order to observe run-to-run and day-to-day performance variation a system suitability test was carried out before each sequence. The goal of this system suitability test was to ensure the correct functions of the complete HPLC-MS/ MS system, to build up a history of the instrument performance and to monitor the role of all consumables such as solvents, buffers, vials and the used instrumenta-tion. For this purpose, a standard solution (20 μL of a methanolic solution containing 10 ng/mL THC, 20 ng/mL 11-OH-THC and 50 ng/mL THC-COOH) was transferred into a sample vial, then the solvent was evaporated and finally the residue was dissolved in 200 μL of a solution containing acetonitrile/water/formic acid (60/40/0.1; v/v/v). All compounds had to be automatically recognized by the MDS Sciex Analyst software and chromatographic peak shapes, retention times, interferences and signal to noise ratios had to be within a range of predefined values and the Analyst quantification method values for smoothing and bunching factors (retention time for all three analytes
(THC: 8.78 min, 11-OH-THC: 6.58 min, THC-COOH: 6.61 min), retention time window of 30 s, smoothing width three and peak-splitting factor one for all three compounds). Validation
A validation plan was set up according to ISO 17025 and parts of the FDA guidelines for bioanalytical method validation were incorporated [31–33].
Selectivity, linearity, post-preparative stability, freeze/ thaw stability, precision, limits of detection and quantifica-tion and the robustness of the analytical method were determined. The LLOQ was chosen in order to meet the current threshold value (1.5 ng/mL of THC in whole blood) with a reasonable safety margin and a linear range which would cover the expected concentration range and the LLOQs were back calculated by the DIN 32645 procedure as well. Existing results obtained by GC-MS were compared to the newly acquired HPLC-MS/MS data.
Results and discussion Method validation
Selectivity was measured on the analyte-free solvents (for the system suitability test), on analyte-free matrix from six different subjects from the blood donor service and from authentic investigations. These samples were tested for the absence of all three analytes. Used as blank samples or, after addition of internal standard, QC zero samples, no traces of analytes or significant interferences could be detected (seeElectronic Supplementary Material).
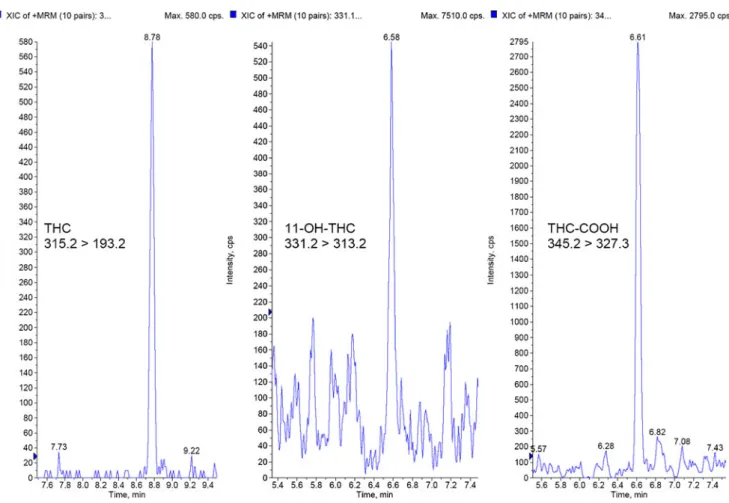
The lowest calibration sample for THC and 11-OH-THC (0.5 ng/mL) as well as for THC-COOH (2.5 ng/mL) achieved acceptable signal to noise ratios during integration (s/n>60 for THC and THC-COOH, s/n>15 for OH-THC). 11-OH-THC showed the lowest sensitivity of all three analytes, but the quantification was still precise and could be quantified without any problems. Typical chromatograms for the limits of quantification are summarized in Fig.1.
Linear ranges from 0.5 to 20 ng/mL for THC and 11-OH-THC and from 2.5 to 100 ng/mL for THC-COOH were
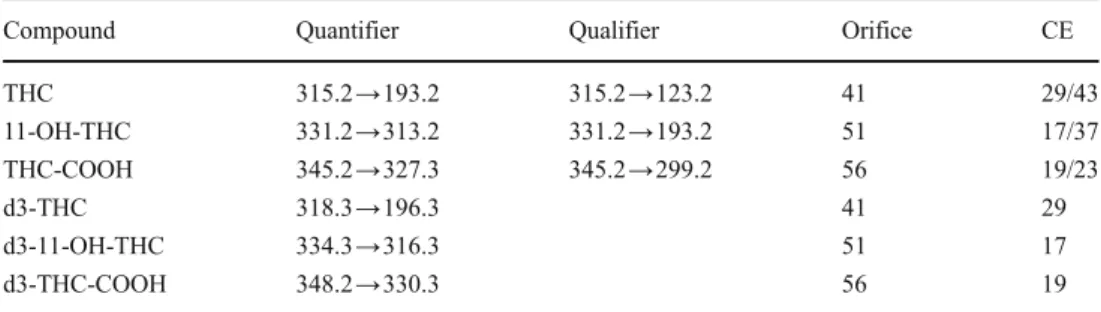
Compound Quantifier Qualifier Orifice CE
THC 315.2→193.2 315.2→123.2 41 29/43 11-OH-THC 331.2→313.2 331.2→193.2 51 17/37 THC-COOH 345.2→327.3 345.2→299.2 56 19/23 d3-THC 318.3→196.3 41 29 d3-11-OH-THC 334.3→316.3 51 17 d3-THC-COOH 348.2→330.3 56 19
Table 2 SRM transitions used for compound quantification and confirmation and optimized parameters for each SRM tran-sition (CE: collision energy)
used in order to achieve correlation coefficients (r) better than 0.9980. The relative narrow ranges were selected, since it was essential to have enough reference points around the legal threshold value whereas measured con-centrations above the highest calibration point are always considered as a positive test result and do not need further verification or re-measurement after dilution.
Each validation sequence contained 14 calibration samples at seven different levels. A first order calibration (y=a × x+b) without weighting factor was applied. During the validation runs from seven calibration samples, corre-lation coefficients were at least 0.9980 for THC, 11-OH-THC and 11-OH-THC-COOH, respectively.
Accuracy and imprecision of the method (during three validation runs prepared on three different days) were tested with four QC levels and the commercially available Medichem drug control standard as an external QC containing 1.4 ng/mL THC, 1.6 ng/mL 11-OH-THC and 32.3 ng/mL THC-COOH. Six replicates of every QC level were measured and the following results were achieved (for three runs): inter-assay accuracy was equal or better than 88.1% for THC, 99.7% for 11-OH-THC and 92.8% for THC-COOH; inter-assay imprecision was equal or better
than 9.8% CV for THC, 10.8% CV for 11-OH-THC and 5.4% CV for THC-COOH.
Inter-personnel comparison was performed on two runs with two laboratory technicians and the coefficients of variation were equal or below 7.45% CV for THC, 6.52% CV for 11-OH-THC and 3.60% CV for THC-COOH.
In addition, the Valistat software (Arvecon GmbH, version 2.0) was used for assessment of the detection limits and quantification limits according to the DIN 32645 standard procedure (area ratio was used for the calcula-tions). The following values were obtained for the detection limits: 0.18 ng/mL for THC, 0.18 ng/mL of 11-OH-THC and 0.85 ng/mL for THC-COOH. For the quantification limits, 0.44 ng/mL for THC, 0.45 ng/mL for 11-OH-THC, and 2.0 ng/mL for THC-COOH were obtained.
Short-term stability was measured based on three replicates of two calibration curves. The first calibration curve was prepared and analyzed directly after spiking while the second calibration curve was prepared and analyzed after 6 h at room temperature. The lowest calibration point showed a decrease of 11% for THC, whereas for all other calibration points the relative devia-tions were smaller than 5% compared to their first values.
Fig. 1 Typical chromatogram for the lowest calibration level of THC, 11-OH-THC and THC-COOH (0.50 ng/mL THC, 0.5 ng/mL 11-OH-THC and 2.5 ng/mL THC-COOH in whole blood)
Re-injection (autosampler) stability was determined with one sequence of authentic samples and six replicates of the Medichem control samples. These samples were analyzed immediately after sample preparation and then kept at 6°C for 6 days. After this period, the run was re-injected and the relative deviation for every authentic sample and for each Medichem control sample was below 15% compared to the first measurement.
Freeze/thaw stability was measured with sets of the lowest and highest calibration sample and the Medichem control samples. Each of the three cycles consisted of 4 h at room temperature at about 20 °C (thaw) and 20 h at about−20 °C (freeze). THC showed a decrease of 15.1% for the lowest calibration point after three cycles, whereas all other samples showed less than 15% deviation compared to their initial values.
Overall recoveries (including on-line SPE and sample preparation) were measured in whole blood samples against pure methanolic solutions and showed average recoveries of 78% for THC, 46% for 11-OH-THC and 52% for THC-COOH, 74% for d3-THC, 47% d3-11-OH-THC and 45% for d3-THC-COOH. Since the sensitivity was sufficient with the current method, no further efforts were made in order to improve the recoveries of the two metabolites.
Matrix effects on all three compounds were tested by infusing a solution containing 10 ng/mL THC, 11-OH-THC and THC-COOH via a T-union and injection of prepared blank blood samples from six different subjects. No signifi-cant changes of the ion intensities were observed for all three compounds during the analytes’ retention times.
Possible carry over was investigated on a sequence with two injections of the highest calibration level followed by three injections of blank samples. No traces of the three compounds were found during these injections (see Electronic Supplementary Material).
Ion ratios between quantifier and qualifier were identi-fied on three validation runs and then implemented for the routine work. For THC, a mean ratio between quantifier and qualifier of 1.67, for 11-OH-THC a mean ratio of 6.0 and for THC-COOH a mean ratio of 1.75 was determined. During the validation, the largest deviation of a single value observed was 18.1% for THC,−20.1% for 11-OH-THC and 5.6% THC-COOH.
The specificity of the internal standard ion traces was tested on six different positive patient samples where THC and both metabolites had previously been mea-sured. For all of these six samples, THC was higher than 32 ng/mL and THC-COOH higher than 58 ng/mL. These samples were prepared and measured as blank samples without adding ISTD. No interferences for the internal standards’ ion traces could be observed compared to the intensities of the internal standards during regular measurement (seeElectronic Supplementary Material).
For synthetic cannabinoids a mixture of JWH-015, JWH-018, JWH-073, JWH-081, JWH-200, JWH-250, WIN 55,212-2, JWH-019 and JWH-020 was spiked into blank blood to a level of 100 ng/mL. Two different samples (blank blood from two different subjects) were measured as blank samples and no interferences with the internal standard ion traces were found (see Electronic Supplementary Material).
For samples above the calibration range the dilution ability was tested with six samples spiked to 100 ng/mL for THC and 11-OH-THC and 500 ng/mL for THC-COOH. After a tenfold dilution with blank blood, the results showed a maximum deviation of 8.1% to their nominal value.
Routine data
During routine analysis six externally purchased quality control samples (from Medichem) are measured within each sequence for accuracy and precision verification. Each run contains typically between 20 to 40 unknown samples which are always measured in duplicate. In 50 runs measured in the last few months (corresponds to about 300 externally purchased quality control samples), the accuracy of each single value for THC was within 15% deviation except for one (reference value of 2.62 ng/mL for the Medichem reference; lowest value measured during the 50 runs: 2.24 ng/mL, highest value measured: 3.08 ng/mL). For 11-OH-THC and for THC-COOH, very few values were outside 15% deviation and no single run during these 50 sequences failed, proving the robustness of the LC-MS/MS method.
Ion ratios between quantifier and qualifier are used as quality control criteria for unequivocal identification of the analyte during routine analysis. Single values with more than 30% deviation from the mean value are investigated or re-analyzed. The intensities of the three internal standards are monitored during data processing for possible sample preparation errors, but are generally within ±15% deviation from the mean value (seeElectronic supplementary material).
Method comparison
The previously used GC-MS method was based on off-line SPE of 1.0 mL of whole blood combined with methylation and a twofold liquid–liquid extraction with octane and reconstitution in ethylacetate (LLOQs were 1.5 ng/mL for THC, 2.0 ng/mL for 11-OH-THC, and 8.0 ng/mL of THC-COOH).
LC-MS/MS reveals two trends: the measured concen-trations of THC are slightly higher when measured with the LC-MS/MS, in average about 16.1% compared to the GC-MS method as illustrated in Table3. Still the results provide good agreement for both measurement techniques for the determination of the THC concentration which is used during the legal process.
For the two metabolites though, lower concentrations were measured when using the LC-MS/MS method compared to the GC-MS method (in average 19.8% for the 11-OH-THC and 62.1% for the THC-COOH). The amount of the glucuronide of the THC-COOH (another major metabolite) present in authentic samples does not contribute to the THC-COOH concentration when using the LC-MS/MS method (this has been tested by using THC-COOH glucuronide which is commercially available from Cerilliant; when samples spiked with THC-COOH glucu-ronide are measured by the LC-MS/MS method no peak appears for the THC-COOH; data not shown).
However, during the sample preparation for the GC-MS method which includes an extraction by SPE with high recovery of THC-COOH glucuronide in the extract, and a subsequent phase-transfer catalyzed methylation step at a high pH value with tetramethylammonium hydroxide solution, a significant portion of the THC-COOH glucuronide present in authentic blood samples was hydrolyzed and therefore
contributed to the measured THC-COOH concentration. Several sources reported comparable results for the hydrolysis of the THC-COOH glucuronide [34–38]. In addition, with LC-MS/MS the glucuronide of THC-COOH is baseline separated (see Electronic Supplementary Material) from THC-COOH and therefore does not contribute to the unconjugated THC-COOH value due to possible in-source fragmentation during the ionization process.
For the differences of the measured 11-OH-THC con-centrations, a similar mechanism can be postulated, but the details were not investigated during this study.
Conclusions
With the introduction of threshold values for commonly abused drugs, Swiss traffic laws are bridging the gap between offenses from driving under the influence of alcohol or drugs. Currently, state courts and traffic
admin-Table 3 Measured concentrations of THC, 11-OH-THC and THC-COOH from 25 authentic DUID cases measured by GC-MS and LC-MS/MS (blq: below limit of quantification) and their relative deviation
Case number THC 11-OH-THC THC-COOH GC-MS [ng/mL] LC-MS/MS [ng/mL] Relative deviation [%] GC-MS [ng/mL] LC-MS/MS [ng/mL] Relative deviation [%] GC-MS [ng/mL] LC-MS/MS [ng/mL] Relative deviation [%] 1 9.2 11 19.6 3.2 2.7 −15.6 86 42 −51.2 2 3.8 4.3 13.2 blq 1.2 − 32 10 −68.8 2 7.4 8.9 20.3 8.6 7.2 −16.3 422 172 −59.2 4 blq blq − blq blq − blq blq − 5 3.1 3.6 16.1 blq 1.2 − 121 39 −67.8 6 blq 1.3 − blq 0.7 − 57 16 −71.9 7 blq 0.6 − blq blq − 5.6 2.7 −51.8 8 7.5 8.1 8.0 3.8 3.3 −13.2 85 37 −56.5 9 1.6 1.7 6.3 blq blq − 17 4.3 −74.7 10 1.2 1.3 8.3 blq 0.6 − 44 19 −56.8 11 1.4 1.7 21.4 blq 0.6 − blq 4.2 − 12 3.6 4.3 19.4 2.0 1.4 −30.0 105 40 −61.9 13 17 20 17.6 4.5 3.4 −24.4 214 58 −72.9 14 blq blq − blq blq − 10 5.9 −41.0 15 blq blq − blq blq − blq 2.6 − 16 4.4 5.2 18.2 blq 1.3 − 71 23 −67.6 17 22 24 9.1 6.7 5.9 −11.9 463 148 −68.0 18 12 13 8.3 5.3 4.5 −15.1 127 66 −48.0 19 1.9 2.2 15.8 blq 0.6 − 33 15 −54.5 20 2.7 3.2 18.5 blq 0.6 − 35 8.9 −74.6 21 2.7 3.2 18.5 blq 0.9 − 95 31 −67.4 22 blq blq − blq blq − 22 7.4 −66.4 23 3.8 4.4 15.8 2.2 1.8 −18.2 74 30 −59.5 24 blq blq − blq blq − blq blq − 25 1.8 2.4 33.3 blq blq − 84 31 −63.1
istrations are receiving blood alcohol results within 24 to 48 h after the samples have arrived in our laboratory. With increasing numbers of cannabis samples to be analyzed, authorities are urging to receive drug concentrations from suspected drivers within a few days as well. With this paper describing our current established method for the measure-ment of THC, a first step into shorter turnaround time from sample collection to reporting the results is made. This study presents a robust method for the determination of cannabinoids in whole blood based on on-line SPE, combined with LC-MS/MS by column switching. The LC-MS/MS method reduces the time needed for sample preparation, sample consumption, measurement time and cycles for preventive maintenance of the instrumentation compared with our earlier GC-MS routine.
Column switching with on-line SPE/enrichment and purification offers several advantages over direct injection onto an analytical column: injection volumes can be adjusted according to the sensitivity of the different mass spectrometers, matrix effects are reduced due to the clean-up step and an increase in robustness is observed as well.
The THC concentrations for authentic cases obtained by GC-MS or by LC-MS/MS were consistent and for the two metabolites the differences could be explained by artifact formation due to the derivatization at basic pH for the GC-MS technique. The current LC-MS/MS method, in routine use since beginning of 2008, has been used to analyze thousands of samples. Furthermore, our laboratory has successfully participated in three European proficiency tests where the results were within a few percent of the reference values.
Nevertheless, more automation and easier sample prep-aration is needed in order to catch up with the increasing demand for cannabis determinations. A critical review of the currently used GC-MS methods is necessary as well, since THC-COOH glucuronide hydrolysis needs to be excluded or total THC-COOH should be determined after mostly quantitative hydrolysis of the glucuronide-conjugate, e.g., by enzymatic or chemical hydrolysis, to obtain repro-ducible results in different laboratories.
Acknowledgments We gratefully acknowledge the contributions of
Matthias Herzog, Brechbühler AG, Zürich, and Stefan Brand, Dionex AG, Olten, and Sidonia Guggisberg, Thomas Wüthrich, Nicole Ochsenbein, and Anita Iannone for their contributions.
References
1. Labat L, Fontaine B, Delzenne C, Doublet A, Marek MC, Tellier D, Tonneau M, Lhermitte M, Frimat P (2008) For Sci Intl 174:90 2. Ronen A, Gershon P, Drobiner H, Rabinovich A, Bar-Hamburger R, Mechoulam R, Cassuto Y, Shinar D (2008) Accid Anal Prev 40:926 3. Mura P, Chatelain C, Dumestre V, Gaulier JM, Ghysel MH, Lacroix C, Kergueris MF, Lhermitte M, Moulsma M, Pepin G, Vincent F, Kintz P (2006) For Sci Intl 160:168
4. Ramaekers JG, Moeller MR, van Ruitenbeek P, Theunissen EL, Schneider E, Kauert G (2006) Drug Alcohol Depend 85:114 5. Appenzeller BMR, Schneider S, Yegles M, Maul A, Wennig R
(2005) For Sci Intl 155:83
6. Huestis MA, Barnes A, Smith ML (2005) Clin Chem 51:2289 7. Ramaekers JG, Berghaus G, van Laar M, Drummer OH (2004)
Drug Alcohol Depend 73:109
8. Drummer OH, Gerostamoulos J, Batziris H, Chu M, Caplehorn JRM, Robertson MD, Swann P (2003) For Sci Intl 134:154 9. Ramirez-Fernandez M, De Boeck G, Wood M, Lopez-Rivadulla
M, Samyn N (2008) J Chrom B 875:465
10. Grauwiler SB, Scholer A, Dreweb J (2007) J Chrom B 850:515 11. Jung J, Kempf J, Mahler H, Weinmann W (2007) J Mass
Spectrom 42:354
12. Nadulski T, Pragst F (2007) J Chrom B 846:78
13. Pizzolato TM, Lopez de Alda MJ, Barcelo D (2007) Trends Anal Chem 26:609
14. Quintela O, Andrenyak DM, Hoggan AM, Crouch DJ (2007) J Anal Toxicol 31:157
15. Teixeira H, Verstraete A, Proenca P, Corte-Real F, Monsanto P, Vieira DN (2007) For Sci Intl 170:148
16. Thomas A, Widmer C, Hopfgartner G, Staub C (2007) J Pharm Biomed Anal 45:495
17. Laloup M, Ramirez Fernandez MM, Wood M, De Boeck G, Maes V, Samyn N (2006) For Sci Intl 161:175
18. Maralikova B, Weinmann W (2004) J Mass Spectrom 39:526 19. Uhl M, Sachs H (2004) For Sci Intl 145:143
20. Gustafson RA, Moolchan ET, Barnes A, Levine B, Huestis MA (2003) J Chrom B 798:145
21. Musshoff F, Lachenmeier DW, Kroener L, Madea B (2003) For Sci Intl 133:32
22. Breindahl T, Andreasen K (1999) J Chrom B 732:155 23. Staub C (1999) J Chrom B 733:119
24. Milman G, Barnes AJ, Lowe RH, Huestis MA (2010) J Chrom A
1217–1513
25. Goodwin RS, Gustafson RA, Barnes A, Nebro W, Moolchan ET, Huestis MA (2006) Ther Drug Monit 28:545
26. Nadulski T, Sporkert F, Schnelle M, Stadelmann AM, Roser P, Schefter T, Pragst F (2005) J Anal Toxicol 29:782
27. Musshoff F, Madea B (2006) Ther Drug Monit 28:155
28. Abraham TT, Lowe RH, Pirnay SO, Darwin WD, Huestis MA (2007) J Anal Toxicol 31:477
29. Huestis MA, Scheidweiler KB, Saito T, Fortner N, Abraham T, Gustafson RA, Smith ML (2008) Forensic Sci Int 174:173 30. Giroud C, Ménétrey A, Augsburger M, Buclin T, Sanchez-Mazas
P, Mangin P (2001) For Sci Intl 123:150
31. Guidance for Industry, Bioanalytical Method Validation, U.S. Department of Health and Human Services, Food and Drug Administration, Center for Drug Evaluation and Research (CDER), Center for Veterinary Medicine (CVM) from May 2001
32. Peters FT, Maurer HH (2002) Accred Qual Assur 7:441 33. Peters FT, Drummer OH, Musshoff F (2007) Forensic Sci Int
165:216
34. Skopp G, Poetsch L, Mauden M, Richter B (2002) For Sci Intl 126:17
35. Skopp G, Pötsch L, Mauden M, Richter B, Aderjan R, Mattern R (1999) Rechtsmedizin 10:21
36. Skopp G, Poetsch L (2002) Clin Chem 48:301
37. Weinmann W, Freisleben S, Auwärter V (2009)“1,1 ng/mL THC im
Serum—§24a StVG—Einstellung des Widerspruchverfahrens“. In:
Verkehrsmedizin—Neueste Erkenntnisse im gesamten Spektrum.
Ed. Rolf Hennighausen, Rainer Mattern, Verlag Kirschbaum, Bonn,
Germany, p. 53–55
38. Weinmann W, Vogt S, Goerke R, Mueller C, Bromberger A (2000) For Sci Intl 113:381