HAL Id: hal-01990086
https://hal.archives-ouvertes.fr/hal-01990086
Submitted on 28 Oct 2019
HAL is a multi-disciplinary open access
archive for the deposit and dissemination of
sci-entific research documents, whether they are
pub-lished or not. The documents may come from
teaching and research institutions in France or
abroad, or from public or private research centers.
L’archive ouverte pluridisciplinaire HAL, est
destinée au dépôt et à la diffusion de documents
scientifiques de niveau recherche, publiés ou non,
émanant des établissements d’enseignement et de
recherche français ou étrangers, des laboratoires
publics ou privés.
To cite this version:
Gabriel Samson, Fabrice Deby, Jean-Luc Garciaz, Jean-Louis Perrin. Monitoring DIAMOND device
for corrosion state evaluation of reinforced concrete structures. MATEC Web of Conferences, EDP
sciences, 2018, 199, pp.04007. �10.1051/matecconf/201819904007�. �hal-01990086�
Monitoring DIAMOND device for corrosion state evaluation of
reinforced concrete structures
Gabriel Samson1, Fabrice Deby*,1, Jean-Luc Garciaz2, Jean-Louis Perrin2
1 LMDC, INSAT/UPS Génie Civil, 135 Avenue de Rangueil, 31077 Toulouse cedex 04, France 2 LERM SETEC, 23 Rue de la Madeleine, 13631 Arles cedex, France
Abstract. The corrosion of steel rebars is a major issue with respect to the durability of reinforced
concrete structure. Several corrosion evaluation methods exist: half-cell potential, concrete resistivity or linear polarization resistance (LPR) measurement. However, these techniques are employed at a given moment and are not suitable for continuous corrosion evaluation. This works belongs to the DIAMOND project which aims to produce a new corrosion state measurement monitoring device. The monitoring probe consists on a cylindrical probe. A ring shape counter-electrode CE is plated on the probe side. At the centre of the CE, a reference electrode (RE) is placed for potential measurement. The device is embedded in concrete at 25 mm of the inspected rebar. The instantaneous ohmic drop observed at the beginning of the polarization measurement is only linked with the concrete resistance which depends on concrete cover and resistivity. A numerical model was developed on Comsol® to create abacuses graph that link concrete resistivity and concrete resistance. Thus, the ohmic drop measure at the beginning of the polarization can now be used to determine regularly concrete average resistivity between the monitoring probe and steel rebar. Two other series of abacus graphs are then introduced in order to determine the polarization resistance of the rebar in front of the monitoring probe (the point of interest (PI)). Two monitoring probes were placed in two types of concrete (one sound concrete and one concrete with chloride). Corrosion potential, concrete resistivity and rebar corrosion rate were monitored over around 200 days. The experimental results obtained with the monitoring probe are finally compared to the results obtained with the surface DIAMOND probe (introduced in the ICCRRR 2018 paper “Alternative methodology for linear polarization resistance assessment of reinforced concrete structure [1]”).
1 Introduction
The corrosion rate of rebar embedded in concrete can significantly vary with time because of external moisture conditions modification. Following the corrosion state of reinforced concrete structure regularly over a long period seems to be a more accurate approach than a one-time measurement. The DIAMOND project [2] developed two types of probes (monitoring and surface) and associate measurement methodologies to simultaneously evaluate three representative parameters of corrosion state, the corrosion potential Ecorr, the concrete resistivity ρ and the
corrosion rate icorr. This paper focusses on the monitoring
probe. The surface probe is presented in another paper in this conference [1].
The measurement method is based on galvanostatic pulse measurement. This technique is employed since around 30 years to determine the corrosion rate of the rebar/concrete interface and the measurement procedure can be found in many papers [3–9]. However, simultaneous measurement of the three previously quoted corrosion state representative parameters (Ecorr, ρ and icorr)
cannot be found in literature. The simultaneous acquisition of these three parameters at regular intervals
over a long period of time would help the non-destructive evaluation of the reinforced concrete structures.
The monitoring DIAMOND probe will be first presented. Then, the measurement methodology is introduced for both resistivity and corrosion rate assessment. The measurement is then numerically modelled using COMSOL® software. The results are presented in abacus graphs where three parameters are taken into account: concrete cover and resistivity, rebar diameter. The numerical simulations enable both resistivity and corrosion rate assessment. Experiments on two types of concrete (sound concrete and concrete prepared with chlorides) are then performed. The obtained results are finally compared with the results given by the surface probe [1].
2 Materials and experimental setup
2.1 DIAMOND monitoring probe
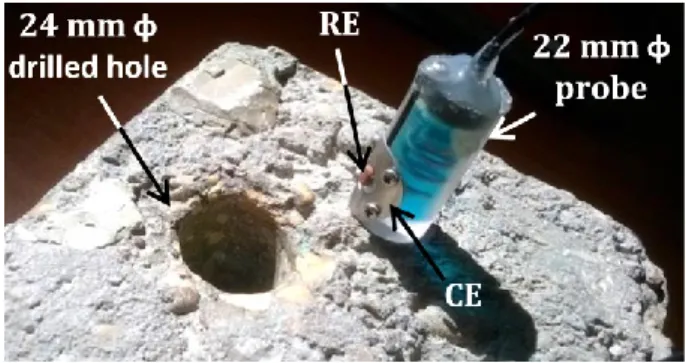
The photo of the DIAMOND monitoring probe is presented in Fig. 1. The probe is a 22 mm cylinder. A ring shape counter electrode (CE) is attached on the probe side. The CE has a 8 mm internal diameter and 22 mm external
MATEC Web of Conferences 199, 04007 (2018) https://doi.org/10.1051/matecconf/201819904007 ICCRRR 2018
surface. The electrical contact between the probe and the concrete is performed using a mortar without shrinkage. The potential is measured on the centre of the CE, on a small circular surface (5 mm diameter) with a Cu/CuSO4
reference electrode (RE). The centre of the RE is placed at 25 mm from the nearest surface of the rebar. An electrical connection between the rebar and the probe is performed. The injected current JP is controlled by a
galvanostat developed in our laboratory (JP = 10 µA). It
was calibrated with an Iso-tech multimeter. In the near future, the probe will be linked to a wireless and self-powered miniaturized monitoring CAPTAE® system to provide corrosion state data (corrosion potential, concrete resistivity and rebar corrosion rate) on a long-term cycle (2 to 5 years).
Fig. 1. DIAMOND monitoring probe.
2.2 Concrete slab specimens
One concrete slab containing two types of concrete was cast (Fig. 2). The concrete slab (800 x 210 x 150 mm³) was prepared with CEM I cement and a very high water/cement ratio of 1.05. The quality of the produced concrete was voluntarily bad in order to promote corrosion and fast moisture balancing. Half of the slab was prepared with chloride in order to activate the corrosion process. The slab contains two crossing rebars (Ø = 10 mm) and six perpendicular rebar. In each concrete, there are 3 rebars of diameter 8, 10 and 12 mm which are respectively placed at 18, 25 and 45 mm under the concrete surface. The samples were cast and the tests began 8 weeks after their production. The slabs are placed outside in Arles, France.
Fig. 2. Concrete slab geometry. Concrete covers are 18, 25 and
40 mm.
with chloride and faces the 10 mm diameter rebar (concrete cover is 25 mm - M2 on Fig. 2). The point located on the rebar/concrete interface that faces the RE of the probe is called the point of interest (PI) and is presented on the modelled geometry in Fig. 3. These two rebars will also be investigated with the DIAMOND surface probe which is introduced in a second paper presented at ICCRRR 2018 [1].
2.3 Resistivity measurement methodology
The rebar diameter D and concrete cover c can be evaluated by non-destructive technique [10]. The polarization of rebar is a transient phenomenon. The rebar / concrete interface can be modelled by a Randles equivalent circuit [3] which associated the polarization resistance RP and the capacitance C. This representation
is presented in one dimension. In reality, it should take into account the three-dimensional nature of the problem. The rebar is polarized using a galvanostatic method. The instantaneous ohmic drop ∆EΩ observed at the beginning
of the polarization is only linked with the concrete resistance RΩ which depends on concrete cover, rebar
diameter and resistivity:
∆EΩ = RΩ.JP (1)
A geometrical factor k linking the concrete resistivity to the concrete resistance has to be determined:
ρ = k.RΩ (2)
Several configurations were numerically modelled in order to model most of the cases that could be encountered on-site. Concrete covers ranged from 30 to 120 mm and rebar diameter ranged from 6 to 32 mm. The distance between the rebar and the probe was kept at 25 mm.
2.4 Linear polarization resistance measurement methodology
The steady-state response is then used to determine the linear polarization resistance of the rebar/concrete interface. On steady-state, the relation between potential shift (E - Ecorr) and the current density i flowing through
the interface is governed by the Butler - Volmer equation: 𝑖 = 𝑖𝑐𝑜𝑟𝑟(𝑒
𝐸−𝐸𝑐𝑜𝑟𝑟
𝑏𝑎 ln(10)− 𝑒
𝐸−𝐸𝑐𝑜𝑟𝑟
𝑏𝑐 ln(10)) (3)
The parameters are given in Table 1.
Table 1. Butler-Volmer parameters implemented in the model.
Parameters Unit Values
Ecorr V/Ref - 0.42
bA V/dec 0.3
bC V/dec 0.125
At the PI, the surface linear polarization resistance RP,s
[Ω.m²] is the ratio between the polarization of the rebar (Δ𝐸𝑃= 𝐸 − 𝐸𝑐𝑜𝑟𝑟) and the current density jPI.
𝑅𝑃,𝑠 = Δ𝐸𝑃
𝑗𝑃𝐼 (4)
The corrosion rate icorr is then determined with the
Stern-Geary equation: 𝑖𝑐𝑜𝑟𝑟=
𝐵
𝑅𝑃,𝑠 (5)
where B is a constant that depends Tafel slopes bA and
bC [11,12]:
𝐵 = 𝑏𝐴𝑏𝐶
ln(10)(𝑏𝐴+ 𝑏𝐶) (6)
B constant differs from different systems and is difficult to evaluate on-site. It is generally fixed at 26 and 52 mV for active and passive area respectively [13]. In this study the Tafel slopes are fixed and correspond to typical values measured for medium corrosion. In this study, B = 38 mV.
3 Finite element model
Only a half of the system was modelled because of the symmetry of the problem. The current JP was injected
through the CE and was equal to 10 µA for all numerical experiments. The RE was a cylinder in contact with the sealing mortar and the CE was a disc with a hole in it to enable RE contact with the sealing mortar (Fig. 3). The distance between the RE and the rebar was 25 mm. RE and CE resistivity was 10-5 Ω.m. The 2 mm width contact
mortar resistivity was equal to the concrete resistivity. Different rebar diameters were modelled (6, 10, 16 and 32 mm). Concrete cover ranged between 30 and 120 mm.
Fig. 3. Modelled geometry for D = 20 mm and c = 50 mm.
A very small electric resistance (0.00001 Ω) was implemented on the rebar/concrete interface to model the polarization resistance short-cut at the beginning of the polarization. To model the steady-state of the polarization of the rebar, the Butler-Volmer equation (Table 1) was implemented on the entire rebar surface.
Tetrahedral elements were used for discretization. The maximum element size was fixed at 0.5 mm. The mesh was refined around the probe, the rebar surface and the 𝑦⃗ axis. The 𝑦⃗ axis was the axis passing through the centre of the RE and the PI of the rebar. It is represented by a red line in Fig. 3.
4 Numerical results
4.1 Concrete cover resistivity abacus graph
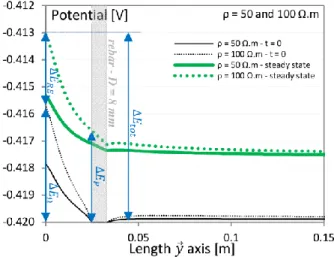
The initial potential Ecorr of the rebar is - 0.42 V/Ref. At
the beginning of the polarization, the instantaneous ohmic drop ΔEΩ can be measured by the RE and is used to
determine the concrete cover resistivity. In order to visualize the influence of concrete resistivity on the instantaneous ohmic drop, Fig. 4 is introduced. It represents the evolution of the potential along the 𝑦⃗ axis (axis presented in Fig. 3). The instantaneous ohmic drop can be observed on the two small thickness curves.
Fig. 4. Potential evolution on the 𝒚⃗⃗⃗ axis for two concrete resistivity (50 and 100 Ω.m). Rebar diameter is 8 mm and concrete cover is 50 mm. The instantaneous ohmic drop ΔEΩ (t MATEC Web of Conferences 199, 04007 (2018) https://doi.org/10.1051/matecconf/201819904007 ICCRRR 2018
the polarization, the potential at the rebar concrete interface remains equal to the corrosion potential (Ecorr = - 0.42 V/Ref). This type of simulation was
repeated for several concrete cover / rebar diameter in order to determine the geometrical factor (Fig. 5), linking the concrete resistivity to the concrete resistance.
Fig. 5. Geometrical factor k depending on rebar diameter and
concrete cover.
As it was expected, the geometrical factor mostly depends on the rebar diameter and is not significantly influence by the concrete cover because the probe is embedded in the concrete, just in front of the rebar. This abacus graph will be used to experimentally measure the concrete resistivity evolution between the probe and the rebar.
4.2 Corrosion rate abacus graph
To determine the surface linear polarization resistance RP,s, both rebar polarization ΔEP and current density at the
PI jPI must be determined and both depend on several
parameters of the problem (injected current, rebar diameter, concrete cover). Fig. 4 (high thickness curves) presents the evolution of the potential along the y⃗⃗ axis on steady-state. The rebar is polarized (ΔEP ≠ 0). Due to the
three dimensional nature of the problem, the rebar polarization ΔEP is different from potential switch
(ΔEtot - ΔEΩ) observed on the surface between the
beginning and the stabilized state of the polarization (ΔEP ≠ ΔEP,RE).
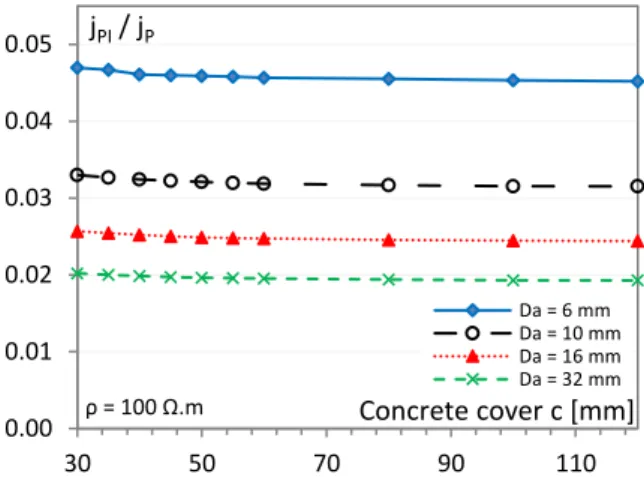
These types of simulation are made for a wide range of all the previously quoted parameters and summarized on several abacus graphs. For the sake of clarity, only the abacus graph obtained for 100 Ω.m resistivity are presented but the numerical simulations were performed for 12 different resistivity ranging from 20 to 2000 Ω.m. The first abacus graph is used to determine the current density at the PI and is presented on Fig. 6.
The current density received at the PI significantly depends on the rebar diameter (Fig. 6). When the rebar
the jPI/jP ratio.
Fig. 6. Ratio between the current density at the PI jPI and the injected current density jP depending on concrete cover for a 100 Ω.m resistivity and four different rebardiameters.
Fig. 7. Ratio between the polarization at the PI ΔEP and the polarization on the surface ΔEP,RE depending on concrete cover for a 100 Ω.m resistivity and 5 different rebar diameters.
The ratio between the polarization at the PI ΔEP on the
rebar and the potential shift ΔEP,RE measured at the RE is
introduced in Fig. 7. As observed in the previous abacus graph (Fig. 6), concrete cover does not influence this ratio. However, a significant influence of the rebar is again noticed. Contrary to the previous abacus graph, the denominator of the ratio is not constant and is also influenced by the parameters of the study. The ratio is maximum for big rebar diameter because the polarization measured on the RE ΔEP,RE significantly decreases when
the rebar diameter increases.
5 Experimental results
0.056 0.057 0.058 0.059 0.060 0.061 0.062 0.063 30 50 70 90 110 Da = 6 mm Da = 10 mm Da = 16 mm Da = 32 mm Concrete cover c [mm] Geometrical factor k [m] ρ = 100 Ω.m 0.00 0.01 0.02 0.03 0.04 0.05 30 50 70 90 110 Da = 6 mm Da = 10 mm Da = 16 mm Da = 32 mm Concrete cover c [mm] jPI/ jP ρ = 100 Ω.m 1.0 1.1 1.2 1.3 1.4 1.5 1.6 1.7 1.8 1.9 2.0 30 50 70 90 110 Da = 6 mm Da = 10 mm Da = 16 mm Da = 32 mm Concrete cover c [mm] ΔEP/ ΔEP,REρ = 100 Ω.m
Without polarization, the potential measured by the RE is the corrosion potential Ecorr of the rebar/concrete
interface. According to the measured values, a corrosion risk can be established [13].
Fig. 8. Corrosion potentials evolution.
The corrosion potentials measured on the rebar placed in sound concrete (unfilled markers) and on concrete with chloride (filled markers) with the two DIAMOND probes (monitoring (square markers) and surface (circle markers)) are presented in Fig. 8. The two probes gave similar corrosion potentials. In sound concrete the corrosion potential remains high (around - 100 mV/Ref) which indicates a moderate risk of corrosion. The rebar placed in the concrete prepared with chloride presented lower corrosion potentials (around - 480 mV/Ref) which indicates a high risk of corrosion.
The resistivity measurements are introduced on Fig. 9 and Fig. 10. Fig. 9 focussed on the measurements performed on the rebar placed in sound concrete. Both surface and monitoring probes gave resistivity value in the same order of magnitude (around 120 Ω.m in average). The obtained values significantly varied with time because the slab was placed outside. With this bad quality concrete and small concrete cover the resistivity of the concrete cover highly depends on the external weather conditions.
Fig. 9. Concrete resistivity evolution for the slab without
chlorides.
The resistivity values obtained on the concrete prepared with chlorides are presented in Fig. 10. The resistivity values measured are logically lower than the values measured on sound concrete. The resistivity measured with the monitoring probe were around 80 Ω.m while the concrete cover resistivity were lower (around 40 Ω.m in average).
Fig. 10. Concrete resistivity evolution for the slab with
chlorides.
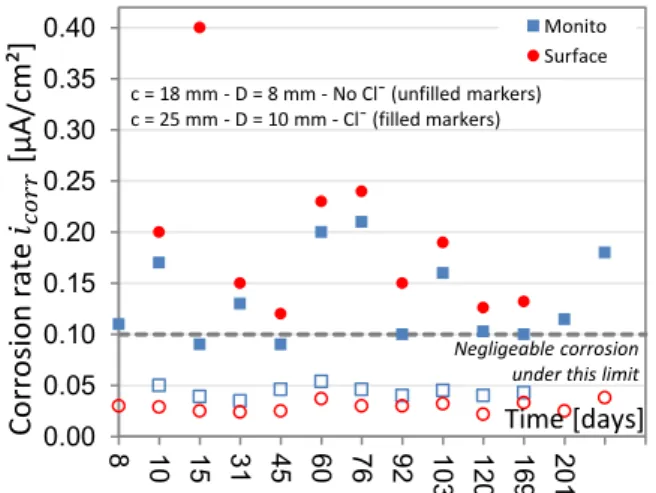
The corrosion rates measured are then presented in Fig. 11. For sound concrete, both monitoring and surface probes gave similar corrosion rate values (around 0.04 µA/cm2 in average) which indicate a negligible
corrosion rate according to. These very small corrosion rate values are in agreement with the high corrosion potentials observed (Fig. 8).
Fig. 11. Corrosion rate evolution.
Higher corrosion rates were measured on the rebar embedded in the concrete with chloride (Fig. 11 - filled markers). These corrosion rate values are more variable than the values observed in sound concrete which indicate that the corrosion rate is influenced by the external climatic conditions when the corrosion is active.
-600 -500 -400 -300 -200 -100 0 100 8 10 15 31 45 60 76 92 103 120 169 201 Monito Surface c = 18 mm - D = 8 mm - No Cl¯ (unfilled markers) c = 25 mm - D = 10 mm - Cl¯ (filled markers) Time [days] Corro sion p o ten tia l 𝐸 𝑐𝑜𝑟 𝑟 [m V] 0 50 100 150 200 250 8 10 15 31 45 60 76 92 1 03 120 169 201 211 Monito Surface c = 18 mm - D = 8 mm - No Cl¯ unfilled markers) Time [days] Re sis tiv ity ρ [Ω .m ] 0 50 100 150 200 250 8 10 15 31 45 60 76 92 1 03 120 169 201 211 Monito Surface c = 25 mm - D = 10 mm - Cl¯ (filled markers) Time [days] Re sis tiv ity ρ [Ω .m ] 0.00 0.05 0.10 0.15 0.20 0.25 0.30 0.35 0.40 8 10 15 31 45 60 76 92 1 03 120 169 201 Monito Surface c = 18 mm - D = 8 mm - No Cl¯ (unfilled markers) c = 25 mm - D = 10 mm - Cl¯ (filled markers) Time [days]
Co
rro
sio
n
rate
𝑖
𝑐𝑜𝑟𝑟[µA/
cm
²]
Negligeable corrosion under this limitMATEC Web of Conferences 199, 04007 (2018) https://doi.org/10.1051/matecconf/201819904007 ICCRRR 2018
structures. The DIAMOND monitoring was introduced and the measurements principles were presented. Numerical simulations of the probe were realized in order to convert the information collected by the probe into corrosion state information of the rebar. These numerical investigations indicated that the measurements are significantly influenced by concrete resistivity and rebar diameter. The rebar was polarized with a galvanostatic method (constant injected current of 10 µA). The collected signal was then analyzed using abacus graphs built with the numerical simulations. The instantaneous ohmic drop was used to determine the concrete resistivity between the probe and the rebar while the steady-state response was used to determine the corrosion rate. The corrosion rate results are then compared with the measurements performed with the surface DIAMOND probe which was presented in another article in ICCRRR 2018 [1]. Good results agreements were observed between these two probes. Further investigations are required to take into account the rebar framework density which will modify the current distribution.
References
1. G. Samson, F. Deby, J.-L. Garciaz, J.-L. Perrin, ICCRRR, Cape Town, (2018).
2. DIAMOND project, Proj. Diam. - Diagn. Corros. Béton Armé - Sonde Captae. (2017). https://www.projet-diamond.com
3. C.J. Newton, J.M. Sykes, Corros. Sci. 28 (1988) 1051– 1074.
4. B. Elsener, O. Klinghoffer, T. Frolund, E. Rislund, Y. Schiegg, H. Böhni, Repair of Concrete Structures conférence, Norway, (1997).
5. P.V. Nygaard, Non-destructive elecrochemical monitoring of reinforcement corrosion, PhD thesis, Technical University of Denmark, (2009).
6. P.V. Nygaard, M.R. Geiker, B. Elsener, Mater. Struct. 42 (2009) 1059–1076.
7. P.V. Nygaard, M.R. Geiker, Mater. Corros. 63 (2012) 200–214.
8. C. Andrade, C. Alonso, Constr. Build. Mater. 15 (2001) 141–145.
9. C. Andrade, C. Alonso, Mater. Struct. 37 (2004) 623– 643.
10. G. Klysz, J.-P. Balayssac, S. Laurens, NDT E Int. 37 (2004) 221–227.
11. A. Clément, S. Laurens, G. Arliguie, F. Deby, Eur. J. Environ. Civ. Eng. 16 (2012) 491–504.
12. A. Poursaee, Cem. Concr. Res. 40 (2010) 1451–1458. 13. RILEM TC 154, (2004).