Publisher’s version / Version de l'éditeur:
Vous avez des questions? Nous pouvons vous aider. Pour communiquer directement avec un auteur, consultez la première page de la revue dans laquelle son article a été publié afin de trouver ses coordonnées. Si vous n’arrivez pas à les repérer, communiquez avec nous à PublicationsArchive-ArchivesPublications@nrc-cnrc.gc.ca.
Questions? Contact the NRC Publications Archive team at
PublicationsArchive-ArchivesPublications@nrc-cnrc.gc.ca. If you wish to email the authors directly, please see the first page of the publication for their contact information.
https://publications-cnrc.canada.ca/fra/droits
L’accès à ce site Web et l’utilisation de son contenu sont assujettis aux conditions présentées dans le site
LISEZ CES CONDITIONS ATTENTIVEMENT AVANT D’UTILISER CE SITE WEB.
Proceedings of the Fourth International Offshore Mechanics and Arctic
Engineering Symposium, 2, pp. 209-219, 1985-02-10
READ THESE TERMS AND CONDITIONS CAREFULLY BEFORE USING THIS WEBSITE. https://nrc-publications.canada.ca/eng/copyright
NRC Publications Archive Record / Notice des Archives des publications du CNRC :
https://nrc-publications.canada.ca/eng/view/object/?id=ecb0e0e4-1031-4ae5-9fec-bef73c5fbf7b
https://publications-cnrc.canada.ca/fra/voir/objet/?id=ecb0e0e4-1031-4ae5-9fec-bef73c5fbf7b
NRC Publications Archive
Archives des publications du CNRC
This publication could be one of several versions: author’s original, accepted manuscript or the publisher’s version. / La version de cette publication peut être l’une des suivantes : la version prépublication de l’auteur, la version acceptée du manuscrit ou la version de l’éditeur.
Access and use of this website and the material on it are subject to the Terms and Conditions set forth at
Confined strength and deformation of second-year columnar-grained
sea ice in Mould Bay
- -
Ser
TH1
N21d
no.
1286
C.
2
National Research
Conseil national
B W
1
Council Canada
de recherches Canada
CONFINED STRENGTH AND DEFORMATION OF SECOND-YEAR
COLUMNAR-GRAINED SEA ICE I N MOULD BAY
by
N.K. Sinha
IANALYZED
\1
I~ 1 s ~ ' ~
T & ~ u E
m~ifi.
i \*+.-,;.\.'.---
Reprinted from
\
, - - - = =!A"-
Proceedings of the Fourth International Offshore
Mechanics and Arctic Engineering Symposium, ASME
Dallas, Texas, February 10
-
15, 1985
Volume II, p. 209 - 219
DBR Paper No. 1286
Division of Building Research
On a proc'ed6 dans l a r 6 g i o n extr6me n o r d de l l A r c t i q u e
3
d e s
e s s a i s i n s i t u de compression s o u s G t r e i n t e l a t ' e r a l e , s u r de l a
g l a c e de mer
3
g r a i n s c o l u m n a i r e s de deuxierne ann6e de t e x t u r e
e t
s t r u c t u r e o r t h o t r o p i q u e s .
La
c h a r g e e t l a c o n t r a i n t e
l a t 6 r a l e o n t 6 t 6 a p p l i q u 6 e s dans un p l a n p e r p e n d i c u l a i r e au
g r a n d a x e d e s g r a i n s c o l u m n a i r e s .
Les c h a r g e s a x i a l e s e t de
c o n t r a i n t e l a t z r a l e on Gt6 rnesurGes en m6me temps que l e s
d 6 f o r m a t i o n s a x i a l e s e t l a t g r a l e s .
En imposant une 6 t r e i n t e
l a t G r a l e , on augmente c o n s i d 6 r a b l e m e n t l a r 6 s i s t a n c e mGcanique,
mais
on
r z d u i t
de
f a ~ o n s i g n i f i c a t i v e l e c o e f f i c i e n t
de
s e n s i b i l i t ' e de l a r ' e s i s t a n c e .
Ona c o n s t a t 6 que l a r 6 s i s t a n c e
d e c e t t e g l a c e de mer en p r 6 s e n c e d ' u n e 6 t r e i n t e l a t 6 r a l e 6 t a i t
comparable
3
c e l l e d t 6 c h a n t i l l o n s de g l a c e d ' e a u douce
3
g r a i n s
c o l u m n a i r e s f a b r i q u 6 e en l a b o r a t o i r e
e t soumise aux e s s a i s dans
d e s
c o n d i t i o n s i d s a l e s .
L t 6 t u d e a d6montr6 q u ' i l
S t a i t
p o s s i b l e d ' e f f e c t u e r i n s i t u d e s 'etudes f i a b l e s e t 6 l a b o r 6 e s d e
l a r s s i s t a n c e .
CONFINED STRENGTH AND DEFORMATION OF SECOND-YEAR COLUMNAR-GRAINED SEA ICE I N MOULD BAY
ABSTRACT
N. K. Sinha
Division of Building Research National Research Council of Canada
Ottawa, Ontario. Canada
Second-year columnar-grained sea ice with orthotropic texture and fabric has been tested in the field in the High Arctic under confined compressive loading conditions. Both load and confinement were applied in the plane at right angles to the long axis of the columnar grains. Axial and confining loads were measured along with the measurements of axial and lateral strains. The confinement increases the strength considerably but significantly decreases the rate sensitivity of strength. The confined strength of this sea ice has been found to be comparable to the confined strength of laboratory-made fresh water columnar-grained ice tested under ideal conditions. The investigation showed that reliable and fairly sophisticated strength studies can also be carried out in the field.
INTRODUCTION
Mould Bay, Prince Patrick Island, N.W.T., Canada proved to be an ideal study site for investigations related to the aging of Arctic sea ice (Sinha, 1983a; 1984; Bolt and Digby, 1984; Troy et al, 1984; Digby, 1984). The ice cover that formed in the 1981-82 growth season survived the summer melt season of 1982 and remained essentially intact in the bay, then went through a second growth season in the winter o_f 1982-83. Detailed documentation of the physical, chemical and microwave properties of the ice was carried out four times: in October 1981, in June-July 1982, in April-by 1983 and in March-April 1984. The weather conditions, ice thickness and snow
thickness were monitored on an almost continuous basis. The High Arctic Weather Station (76ON; 119"20'W) situated on the eastern shore of Mould Bay was used as the base camp for a Canadian multi-departmental joint investigation known as the Badarsat Project.
During the field trip of April-May 1983,
observations were made on rate sensitivity of uniaxial unconfined and confined compressive strength and deformation of columnar-grained ice in the bay. This paper describes results obtained on the confined
compressive strength of the ice with both load and confinement applied in the lane of the ice cover. i.e., perpendicular to the columns. The paper also brings out the numerous problems that were encountered during field tests.
ICE CEARACTERISTICS
Mould Bay, which is about 30 km long and more than 10
km
wide at some locations, was covered with an extremely uniform flat sheet of new ice during the 1981-82 growth season. Detailed descriptions of the young sea ice cover of October 1981, including a SLAR (Side Looking Airborne Radar) image, has been given in Sinha (1984). The thickness of the ice cover during the 3rd week of October 1981 was 0.4*
0.05 m. Examination of the ice at the various stationsestablished along an east-west experimental line showed a predominantly columnar-grained structure except for the ice cover near the eastern shore that consisted almost entirely of congealed, frazil slush type ice. This ice cover stayed intact and grew to a total thickness of 2.0f 0.20 m at the end of the growth season. Reexamination in June-July 1982 revealed that the ice was columnar-grained through the entire depth of the ice cover. During the summer of 1982
considerable melting of the ice cover occurred, and several leads formed across the bay. Eowever, the ice cover as a whole survived, except near the shore lines, and entered the new growth period of 1982-83.
Measurements carried out during the April-May 1983 trip revealed that the thickness of the second-year ice on top of the new ice was less than a metre.
For the tests to be reported here, ice was obtained from Station $3, about 2 km from the eastern shore. The total ice thickness at this site was 1.87 m on April 9, 1983. Samples were obtained during
previous strength tests on young ice at essentially the same location in October 1981 (Sinha, 1984) and on. mature first-year ice in June-July (Sinha, 1983a). Vertical cores of 76 mm diameter and full depth of the ice cover were obtained for microstructural and salinity analysis. Large blocks of ice cut with a chain saw were obtained for strength tests. The air
temperature d u r i n g t h i s t r i p ranged from -46OC t o -20°C. I c e samples were u s u a l l y wrapped with i n s u l a t i o n and shock-abeorbing m a t e r i a l s soon a f t e r recovery t o prevent damage from sudden temperature changes d u r i n g t h e r e t u r n t r i p t o t h e base camp.
The d e n s i t y p r o f i l e given by curve 'a' of Figure 1 was obtained by s l i c i n g t h e 0.1 m wide and 0.04 m t h i c k v e r t i c a l block shown i n t h e photograph. Although t h e t o p l a y e r of t h e i c e was very porous, t h e d e n s i t y increased r a p i d l y w i t h depth. For t h i s reason t h e t o p 0.05 m of t h e i c e was discarded when specimens f o r s t r e n g t h t e s t s were prepared. Curve 'b' shows t h e d e n s i t y obtained from t h e mass and volume of a s e t of samples used f o r determining t h e s t r e n g t h . The average d e n s i t y of t h e i c e (obtained from 16 specimens t e s t e d ) was found t o be 910.3 f 4.1 k p m3 ( a i r volume of 8.2 2 4.5 XO) a t -10°C; t h e h i g h e s t and t h e lowest were 915.9 kg- m3 and 905.0 k p m3 r e s p e c t i v e l y . The a i r volume was estimated u s i n g 917.8 kpm* a s t h e d e n s i t y of pure i c e a t -10°C.
The i c e was columnar-grained through i t s e n t i r e depth, i n c l u d i n g t h e o l d icelnew i c e i n t e r f a c e , t h e mean c-axis of t h e g r a i n s tending t o be i n t h e
h o r i z o n t a l plane (?So), p a r a l l e l t o t h e s u r f a c e of t h e i c e cover (Figure 2). The mean c-axis of t h e g r a i n s i n t h e h o r i z o n t a l plane ( s e e Figure 2 ) tended t o be p a r a l l e l (215") t o t h e a x i s of t h e c h a ~ e l o r t h e bay, s i m i l a r t o previous observations i n Mould Bay (Sinha, 1983a; 1984). This type of anisptropy i n t h e f a b r i c of c o l u m n a r g r a i n e d i c e i s q u i t e common (Weeks and Gow 1978; 1980; Sinha, 1983b; Nakawo and Sinha, 1984). The p r e s e n t o b s e r v a t i o n s i n d i c a t e t h a t t h e aging processes t h a t l e d t o t h e complete d e s a l i n a t i o n i n t h e o l d i c e d i d not a f f e c t t h e t e x t u r e and t h e f a b r i c of t h e ice. I n f a c t , even t h e a i r p o r o s i t y i s comparable t o t h a t obtained d i r e c t l y by Nakawo (1983) i n f i r s t y e a r i c e grown under s i m i l a r growth r a t e a s t h i s i c e cover. The i c e cover d i d not appear t o r o t a t e i n t h e bay d u r i n g t h e melt season more than t h e experimental u n c e r t a i n t y ( 5 t o l o 0 ) of marking t h e o r i e n t a t i o n of t h e a x i s of t h e bay on a block of ice.
Figure 2b shows t h a t i t i s d i f f i c u l t t o d e f i n e a g r a i n , l e t alone determine a r e p r e s e n t a t i v e g r a i n s i z e . The i c e could b e s t be described i n terms of f a m i l i e s of sub-grains l i n e d up with t h e i r c-axis o r i e n t e d i n a g e n e r a l d i r e c t i o n . The bubbles a r e very i r r e g t i l a r i n shape (Figure 1 ) and they a r e present a t t h e sub-grain boundaries a s shown i n Figure 2c. The sub-grain boundaries i n t h e micrographs were developed by a microtoming and e t c h i n g technique described e a r l i e r (Sinha, 1977). The m i c r o s t r u c t u r a l examinations were performed i n t h e f i e l d soon a f t e r recovery of t h e samples.
Since t h e i c e was o r t h o t r o p i c i n t e x t u r e a s w e l l a s i n f a b r i c , t h e coordinates
5
and5
were chosen i n t h e plane of t h e i c e cover ( h o r i z o n t a l plane) andy
p a r a l l e l t o t h e a x i s of the columnar g r a i n s ( i n t h e v e r t i c a l plane). Furthermore i t was decided, f o r s i m p l i c i t y , t o make x, p a r a l l e l t o t h e mean c-axis o r[0001] a x i s o r i e n t a t i o n of t h e g r a i n s . Rectangular specimens f o r t e s t i n g were prepared with t h e i r major axes ( a l o n g which load was a l s o a p p l i e d ) a t a n g l e s a a n d y with xl and
%
r e s p e c t i v e l y . Consequently o r i e n t a t i o n of t h e a x i a l load w i t h r e s p e c t t o t h e i c e cover, hence t h e c-axis, i s described by t h e angles a a n d y . The p r e s e n t r e p o r t concerns onlyh o r i z o n t a l l y - o r i e n t e d samples (y = 90").
EXPERIMENTAL KETHODS
The t e s t s were conducted i n a mobile t r a i l e r a t - 1 0 f 0.5"C. Surface temperatures of t h e specimens
FIG. 1 V e r t i c a l d e n s i t y and s a l i n i t y p r o f i l e i n second-year s e a i c e a t S t a t i o n 3 i n Mould Bay, A p r i l 1983.
were measured both before and a f t e r t e s t i n g , using a t h e r m i s t o r system.
T e s t s were c a r r i e d o u t on l a r g e p r i s m a t i c samples with dimensions of 50 x 101 x 250 mm, t h e i r long dimensions p a r a l l e l t o t h e s u r f a c e of t h e i c e cover (y a 90'). Two types of specimens were prepared w i t h
a = 0' a n d a = 45". A p o r t a b l e band saw k e p t i n s i d e t h e cold room a t -10°C was used t o prepare t h e samples. The specimen s u r f a c e s were f i n i s h e d by hand w i t h medium grade sandpaper on a f l a t surface. The top and bottom end s u r f a c e s (50 x 101 mm) and t h e two s i d e f a c e s (50 x 250 mm) were prepared manually, a s c a r e f u l l y a s p o s s i b l e t o make c e r t a i n t h a t they were f l a t and a t r i g h t a n g l e s t o t h e 101 x 250 faces. F i n a l f i n i s h was given by wiping with a t i s s u e paper s l i g h t l y moistened w i t h alcohol. Finished specimens were weighed i n s i d e t h e cold room, w i t h a balance capable of measuring t o a n accuracy of 0.01 gm, and t h e i r dimensions measured with a v e r n i e r c a l i p e r s . On t h e average, t h e
specimens' f i n a l dimensions d i d not vary from t h e d e s i r e d s i z e by more than 0.2 mm. (The b e s t was 0.05 mm but t h e worst was 0.45 mm.) Each specimen was photographed and s t o r e d s e p a r a t e l y i n a p l a s t i c bag from which t h e a i r was sucked o u t a s much as possible.
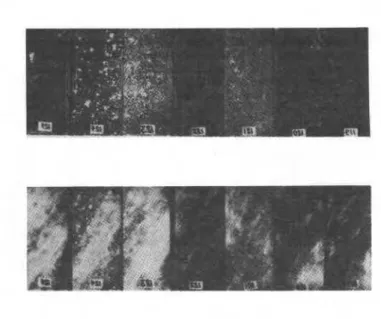
The t e s t specimens were prepared from t h r e e l a r g e blocks, approximately 2 0 0 % 400 mm i n t h e h o r i z o n t a l plane and about 800 Imn deep, covering t h e f u l l depth of t h e second-year ice. A f t e r d i s c a r d i n g t h e t o p porous 50 mm of t h e i c e and t h e new i c e a t t h e bottom, each block provided s u f f i c i e n t depth f o r seven specimens. Although c r y s t a l l o g r a p h i c a l l y t h e samples from t h e same block were very s i m i l a r , t h e bubble s t r u c t u r e s v a r i e d g r e a t l y because of layering. This i s i l l u s t r a t e d by t h e photographs of f i n i s h e d specimens numbered 119 t o 125 presented i n Figure 3. Each photograph is of t h e t o p h o r i z o n t a l s u r f a c e of t h e samples w i t h r e s p e c t t o t h e i r o r i g i n a l p o s i t i o n i n t h e i c e cover. Because of
FIG. 2c Optical micrograph of an etched horizontal section showing the oriented subgrains and cross-sections of irregularly-shaped air bubbles.
PIG. 2a Vertical section showing columnar grains.
the layer variation in bubble concentration, the density varied from sample to sample. The seven samples presented in Figure 3 were oriented with a = 45" and their densities are given by curve 'b' in
Figure 1. Note the crack orientations after the test.
A
comercia1 test machine (Soiltest CT-405) with a design load capacity of 50 kN was used to perform the tests (Figure4).
'It is a conventional screw-driven machine capable of Pelivering a constant actuator displacement rate, xl., up to 7 x 10⁻² mm 8-1, or a nominal strain rate, E = kl/g, up to 2.8 xlo*
6-Ifor a specimen length,
kl,
of 250 mm. Each specimen was tested between a pair of 25 mm thick polished aluminum subplatens having planer dimensions of 60 x 100 mm with load applied in the5
direction across the 50 x 101 mm faces. The top subplatene reacted against the test frame through a calibrated load cell. The bottom subplaten was supported by a polished 150 mm steel platen, normally used for unconfined tests, attached to the actuator. Note that the subplatens are 1 mm shorter than the specimen width. This provided a 0.5 mm clearance on either side between the subplatens and the confining platens. The stress, ul, wasestimated from the axial loads and the areas of the end surfaces of the specimens. Axial specimen deformation was measured with a pair of specially designed gauges, of 150 mm in gauge length (Sinha, 19811, mounted directly on the central areas of the two 101 x 250 mm faces of the specimen.
A
specially-designed subpress (Figure 4) was used to a ~ ~ l v- -
-
confinement across the 5 0 x 250 mn faces. i.e. a l m g the5
direction. This was accomplished by a pair of 25 mm thick aluminum platens. One of these PIG. 2b Horizontal thin section at a depth of 368 mm platens was fixed to the subpress frame, consisting offrom the surface. The arrow indicates the six stainless steel solid rods of 32 mm diameter. The
lateral direction during testing.
A
pair ofdisplacement gauges were mounted between the two side platens to record the lateral deformation. Output from the two load Cells and the four displacement gauges was recorded separately using strip chart recorders and a magnetic tape with a digital data logging system capable of working at subzero temperatures. The chart recorders were kept in heated and well insulated boxes that also housed the load cell electronics and the power supply for the DCDTs (direct current displacement transducer) of the displacement gauges. Calibration of these gauges was checked after every few tests to
maximum load ievel would exceed the machine's-design capacia :Onominal strain rates greater than J FIG. 3
A
set of specimens witha-
4S0 andy = 90' 1 x 10 though it is capable of operating at aphotographed before (top raw) and after (bottom noninal strain rate of 2.8 x lo* s-l (Sinha, 1984).
row) the tests. Based on previous experience (Sinha, l383a) it was
decided not to exceed the machine ca~acity by more than
FIG. 4 Test machine and the confining frame photographed during a test in the field.
diameter threaded stainless steel rod and reacted against the frame through a calibrated load cell and a threaded locking mechanism. This arrangement was essential for moving the platen back and forth for final adjustments to ensure a good initial contact with the 50 x 250 an faces, contact being ensured by a preload of about 0.05 MNoR?. The subpress was designed to keep the side platens parallel to each other during testing. In order to ensure that the lateral
deformation was symmetric about the axis of loading, the entire subpress was installed on a carriage, as can be seen in Figure 4, cepable of moving freely in the
about 150%, in other words a total load livei of 75 kN. The operating range was decreased to a maximum nominal rate of about 5 x lo* s4
.
The machine started slipping and failing to turn the loading screw when the total load exceeded about 35 kN for rates less than 5 x lod s-I.
This problem had not been experienced previously and examination showed that it was caused by the test machine's design. Experimental rates were therefore limited by these boundaries and all the failures were noted to be of the upper yield type as defined and discussed in detail in Sinha (1981).An example of axial stress, ul, and the corresponding strain, E
,
for a confined test at a nominal rate of 4.4 x lb* 8-1 is shown in Figures 5a and 5b respectively. In this case the specimen was unloaded soon after reaching the upper yield or failure stress, a f, of 14.8 m m * at a failure time, tf, of 315 seconas. Note that the total load on the specimen exceeded the design capacity of the machine halfway to failure time. It can be seen that the strain rate in the specimen increased rapidly for about 110 seconds and thereafter increased very slowly, practically constant and equal to the nominal rate. This can be seen from the broken line corresponding to theconstant,
2,.
The major transition in the strain rate occurred after the load level exceeded about half the design capacity of the machine. The average axial strain rate to failure,2
-
E lf Itf, where E lf is the axial strain at upper yieidf was comparable butsomewhat less (10%) than
2
,.
This observation sharply contrasts with the measurements carried out on ice in uniaxial unconfined loading under truly constant cross-head rates (Sinha, 1981; 1984). For constant cross-head rates, the average strain rates were found to be a fraction of the nominal rate. However, measurements by the author (unpublished) duringclosed-loop controlled constant strain rate experiments with the controlling gauge mounted directly on the specioen, indicated that the cross-head rate should indeed decrease, instead of being constant, during the pre-upper-yield period to maintain a constant
deformation rate in the specimen. This observation indicates, therefore, that the machine could not maintain a constant cross-head rate during the later part of the test in Figure 5. No measurements of the
W L D M Y SECO#D YEAR SEA ICE
I
-*.
o=cP.l=w
-
U l f UNCOMFINED TEST NO. 12860 120 180 240 300 360
TIME, s
FIG. 5a Stress history for a confined and an unconfined test at the same cross-head displacement rate.
I
MOULD BAY SECOND YEAR SEA ICE-10%.
a
= oO, y =so0
P
,
= 4.4 x '01 r-1-
CONFINED TEST NO. 118STaAlN PATH IF RATE WAS
0 60 120 180 240 300 360
TIME, s
FIG. 5b Strain history for these tests.
FIG. 5c Front and side views of specimen No. 118 before (left) and after (right) test. Note the cracks in the front view and the irregularities in the side view after test. cross-head rates during these tests were made to substantiate this statement, but a previous test eeries (Sinha, 1983a) with this machine involving high loads on vertically oriented (y = 0) samples of first-year ice from the same location lends some support.
The example shown in Figure 5 represents the worst case in the present series. The purpose of presenting this experiment is to bring out some common problems, as dicussed above, that may be overlooked. Moreover, it also demonstrates a critical experimental problem involving confinement, which is comon (Blanchet and Hamza, 1983; Timco and Frederking, 1983). This concerns the quality of specimen preparation and is indicated by the al
-
t curve exhibiting a hump at a b u t 70 ueconds. This hunp vas thought to be cauaed by imperfections in the specimen geometry causing il~perfect contact batwean the specimen side8 and theconfining platens at the beginning of the test.
Examination of the pre-test aimensions of the specimen of Figure 5 showd that it had the worst dimensional variations of all the specimens teeted in this seriee.
The width of this sample near the top and the bottom was 101.50 mm and 101.55 mm respectively but was 101.10 m in the central area. It is therefore highly possible that the quality of confinement was leas than desired, particularly in the central area, in the beginning and the loading was more like an unconfined situation until the lateral deformation in the specimen resulted in better contact. To test this hypothesis, a comparison was made with the uunonftned loading results obtained on a second-year sea ice specimen of similar orientation, from Station 63, at the s a w nominal rate.
It can be seen in Figures 5a and Sb that both the unconfined and the confined tests essentfally followed the aaae stresa or defonnstion hietory during the initial loading period for about 30 seconds. Note the timing and the stress level of the upper yield point in the unconfined tests and of the atreas hump in the confined test. It should perhape be mentioned here that the strain rate continually varied during the prrfailure time In the unconfined test and that the average strain rate to the upper yield point is about one third o f the nominal rate similar to previous
observatione in laboratory teete (Sinha, 1981). The differences in the failure stresees and etrains in the
two tests are also particularly noticeable. The maximum stress in the confined test is about three times the corresponding stress in unconfined tests but the failure strain in the former is almost one order of magnitude larger than in the latter.
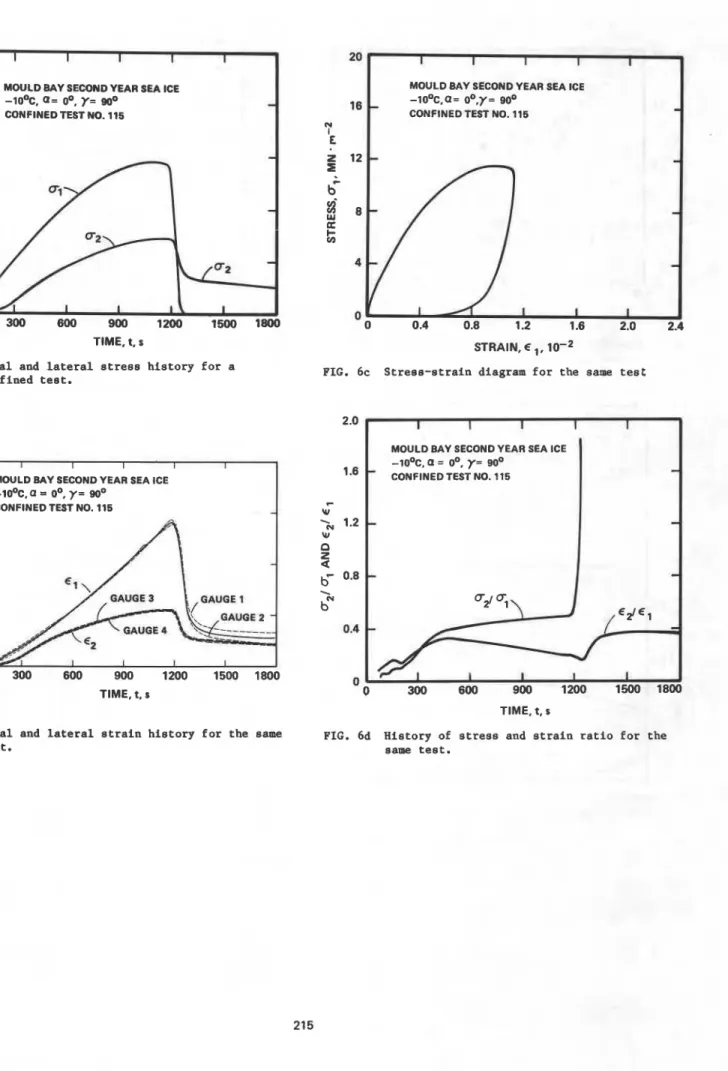
Figure 6 presents a complete set of results of a test carried out at a nominal rate of 1.7 x lo* s-I. In contrast to the previous example, the strain rate varied continuously through the entire test, yielding an average rate equal to about half of
dn.
Results shown in Piguree 5 and 6 demonstrate that2
cannot be used for any serious investigation, althougf: it is still practiced commonly. It is planned to present elsewhere a detailed study on the subject of nominal strain rates and the corresponding actual strain rates under confined and unconfined tests on first year, second year and multi-year ice samples. The stress and strain responses measured during unloading and after complete removal of the axial load (Figure 6) are particularly interesting. Note the quick recovery of the axial strain soon after unloading in the axial direction and the emergence of a residual lateral stress which then relaxed very slowly.FAILURE STRESS AND TIME
Figure 7 showa that o lf increases with the
decrease in tf and that the value of a for the specimen has no effect on this dependence. The dependence of u l f on tf may be given by
'
0 p o
J
where to is the unit or reference time (a 1 s) and uo is the unit or reference stress (= 1MN.m4).
Regression analysis of all the results gave C = 2.16 x 1@ and 0 = 3.31 with a correlation
coefficient of 0.81. The numerical value of the stress exponent 0 obtained here is greater than the
corresponding value, 2.48, obtained under unconfined loading conditions (a = On, y = 90') for the young sea ice cover at the same location in October 1981 using the same test machine (Sinha, 1984) and a value of 2.57 obtained for unconfined tests on mature first-year ice in the eastern Arctic (Sinha, 1983b) using a very small machine and horizontal samples (y = 90') witha = 0' and 90'.
STRESS-RATE DEPENDENCE
Since strength of ice is sensitive to rate of loading, and since load, hence stress for small strain, and time can be measured easily and accurately without much additional effort, it was shown (Sinha, 1981;
1983a; 1983b; 1984) that the simplest evaluation of the rate sensitivity of strength is obtained by the average stress rate, defined as
where =
'
2
is the unit stress rate t( 3 1 m m * +:
1.
Substituting tf/to from (1) in (2) and rearranging gives
with the values of C and 0 , determined earlier. The results are shown in Figure 8.
The dependence of the unconfined upper yield stress on average stress rate for the same ice in Mould Bay when it was only one month old and had a salinity of 5x0, tested with the same machine and orientation, y = 90°, a
-
0' (Sinha, 1984) is also shown in Figure 8along with unconfined results obtained on transversely isotropic, fresh water columnar-grained, S-2 ice with load applied, under constant cross-head rates, at right angles to the axis of the columns. These results show clearly the effect of confinement on the rate
sensitivity of strength as measured by the stresslate exponent. Note the significant difference between the stress-rate exponent (0.23) for the confined tests on secon+year ice and for the unconfined tests (0.30) on pure fresh water (distilled) ice. Note also that there is practically no difference between the stress rate exponent (0.30) for the fresh water ice and young sea ice (0.29). The presence of brine does not appear to
affect the rate sensitivity but the loading boundary (
condition does.
If S-2 ice is used as the basis for comparison, then Figure 8 shows that the confined strength of second-year sea ice is 3.5 times greater than the unconfined strength of pure ice, when the stress rate is 1 x
lo1
MN. m7 s 1,
which is about the middle of the experimental range of loading rates.STRAIN-RATE DEPENDENCE
For the present test series, the average strain rate method was deemed preferable (as discussed in Sinha, 1982; 1983b). The dependence of axial upper yield stress, o l
,
on the average axial sttain rate,d
laf-
r lf/tj, wfiere Eibis
the strain at upper yield,is shown n igure 9. ain the anglea for the specimen appears to have no effect on strength. The strain rate dependence may be represented by
where
2
is the unit or reference strain rate(= 1 Regression analysis of all the results gave
P = 81.9 and p
-
0.18 k 0.03 with a correlation coefficient of 0.84.The line of best fit given by Equation (4) is shown in Figure 9 along with that for the unconfined results obtained in October 1981 (Sinha, 1984). It also showe two sets of unconfined results on laboratory-made columnargrained S-2 ice made from distilled water. These sets, because of the purity of the ice and test conditions, could be used as the benchmark for the present study. One set was obtained with a conventional machine with constant cross-head
ratee and analyzed on the basis of
2
laf (Sinha, 1981) and the other set obtained with a closed-loop machine at 'truly' constant strain rates with the controlling displacement gauge mounted directly on the specimens (Sinha, 1982) and failure strain less than about 1 x I @ . As in the case of stress-rate analysis, it can be seen here that the rate sensitivity given by the strain rate exponent is essentially the same for both saline and fresh water ice for unconfined tests but is significantly lower in the case of confined tests.MOULD BAY SECOND YEAR SEA ICE
-roOc, a =
oO,
y = 900 IE CONFINED TEST NO. 115
TIME, t. s
FIG. 6a Axial and l a t e r a l s t r e s s history for a confined t e s t .
MOULD BAY SECOND YEAR SEA ICE
11
-iooc,
a = 00, y =so0
N
c.2t
CONFINEDTEST NO. 116;u
W
TIME, t, s
MOULD BAY SECOND YEAR SEA ICE
16
-
- l o O ~ . a = oO,y= 900CONFINED TEST NO. 115
-
N I E 2 1 2 -
z
-
-
-
I I 1 0 0.4 0.8 1.2 1.6 2.0 2.4 STRAIN, E l,FIG. 6c Stress-strain diagram for the same t e s t
MOULD BAY SECOND YEAR SEA ICE
-ioOc, a = oO, y = go0
-
CONFINED TEST NO. 115-
-
-
-
-
300 600 900 1200 1500 1800
TIME, t, s
FIG. 6b Axial and lateral strain history for the same FIG. 6d History of s t r e s s and strain ratio for the
1 s
103
104
FAILURE TIME. tf, sFIG. 7 Dependence of upper a x i a l y i e l d o r f a i l u r e s t r e s s on f a i l u r e time.
I
-...
-
11.7 1 &1)0.30, FRESH WATER S-2 ICE, UNCONFINED, (SINHA, 1981)
.---
4.6 ( &lrf)0'Z9, MOULD BAY YOUNG ICE, Q = 0'.Y = @.UNCONFINED, (SINHA. 1884)
-
28.5bl.f0=
WHIS STUDY)CONFINED, MOULD m y
SECOND YEAR, -loOc a =oO, y = @
4 = 450, y = 900
_
...-...
C - .10-3 10-2 10-1
AVERAGE STRESS RATE, blaf, s-1
FIG. 8 Dependence of upper a x i a l . y i e l d o r f a i l u r e s t r e s s on average s t r e s s r a t e .
I
-.-.-
83.4 t I? JO." IFREDERIING. 1977). S-2, CONFINEDI
I
----
4
fSl~ltA, 1 w . S - 2 , UNCONFINEDI
---
45 ( QO-, MOULD BAY YOUNG SEA ICE, a = oO.y = @, UNCONFINED (SINHA. 1984)
-
el
3ZMO-'8
mts STUDY 1CONFINED TEST. - 1 0 ' ~ a = o O , y = @
AVERAGE STRAIN RATE,
zlilr,
5 - l !I
FIG. 9 Dependence of a x i a l upper y i e l d o r f a i l u r e s t r e s s on average s t r a i n r a t e .
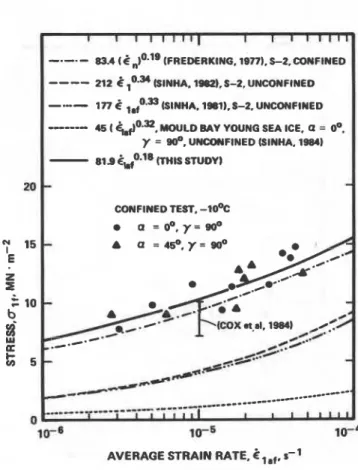
I n t h e middle of t h e experimental range of s t r a i n r a t e s , a t 1 x lo4 s-I
,
t h e r a t i o of t h e confined t o t h e unconfined s t r e n t h is 2.5. T h i s r a t i o decreases t o 1.8 a t 1 v lo4 s5 and i n c r e a s e s t o 3.6 a t 1 x lo6. These r a t i o s a r e s i g n i f i c a n t l y lower than t h e values i n d i c a t e d by t h e s t r e s s - r a t e a n a l y s i s described e a r l i e r using t h e same d a t a a s i n t h e c a s e of t h e benchmark.There a r e no published d a t a t h a t can be compared d i r e c t l y . without any ambiguity, with t h e confined t e s t r e s u l t s obtained here. The c l o s e s t information i s t h a t obtained on laboratory-made f r e s h water t r a n s v e r s e l y - i s o t r o p i c S-2 i c e a t -lO°C under constant cross-head r a t e s by Frederking (1977). who analysed t h e r e s u l t s on t h e b a s i s of nominal s t r a i n r a t e s r a t h e r t h a n t h e r a t e a c t u a l l y measured, and by Cox e t a 1 (1984) on
multi-year s e a i c e . These d a t a a r e shown i n Figure 9 and i n d i c a t e t h a t t h e S-2 i c e i s weaker than t h e p r e s e n t s e a i c e . Excellent agreement between t h e two exponents of s t r a i n r a t e (Frederking's and t h e c u r r e n t study), however, i n d i c a t e 6 t h a t t h e ahape of t h e
a
-
t
c u r v e f o r S-2 i c e i s e a s e n t i a l l y t h e sameas
rttz
f o r t h e o l d s e a ice. E a r l i e r i n t h i s paper t was ahown t h a t the average s t r a i n r a t e under confined condition8 i s less than:,, though not as m c has i n the caee of unconfined t e s t s . A comparable phenomenon must a l s o have occurred d u r i n g t h e confined t e s t s on f r e s h water i c e . Unconfined experiments c a r r i e d o u t exhaustively on S-2 i c e by Sinha (1981). using t h e same t e s t machine and specimen s i z e a s i n t h e confined t e s t s by Frederking, showed t h a t t h e specimen s t r a i n r a t e s were only 40% of
hn.
Frederking's r e s u l t a n t curve, i f analysed on t h e b a s i s of a c t u a lstrain rates, would therefore have shifted to the lower rates on Figure 9. It is impossible to say, without
any measurements, but any such shift would make a (Y
better numerical agreement between the two sets of I
confined test data. This discussion emphasises again E 16 the need to make strain measurements directly on
specimens during tests, rather than carrying out the
Z
.canalysis on the basis of
2,.
b'
.r 12
STRESS
AND
STRAINAT
FAILURE3
LT
Failure strain, 0
f,
is equal toi
tf by I- U)definition and it can ie shown from ~ q u a 2 o n s (1) and (4) that
L J
which on substitution of the values of C, P, p,
e
and 5-2,UNCONFINED
a, gives
I
Equation (5b) is compared with the experimental results in Figure 10. For convenience, unconfined results obtained on pure S-2 ice subjected to a closed-loop controlled constant strain rate (Sinha, 1982) are also shown for comparison. Significant differences between the two sets of results can be seen. Particularly noticeable is the divergence of the two curves as the failure stress or the strain rate and hence the cracking activity increases. It can be shown furthermore u s i q Equations (1) and (4) that
which on substitution of C, P, p, 8 and
i0
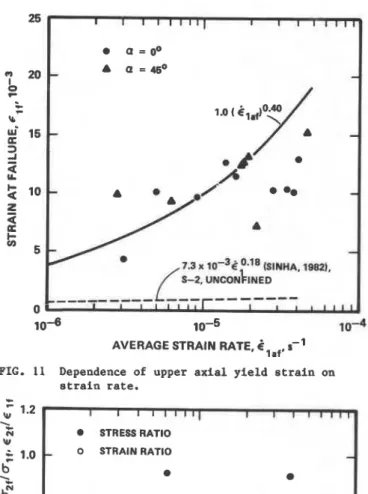
givesExperimental observations on the dependence of axial upper yield strain on average strain rate is compared with Equation (6b) in Figure 11. Observations on pure S-2 ice under truly constant strain rate is also reproduced in Figure 11 for comparison. In general it takes a strain that is nearly ten times larger in confinement than in unconfined conditions to reach upper yield point. It can be seen that the rate sensitivity of confined failure strain is mu:h greater than that of unconfined strains. The e l f
-
claf curve approaches rapidly the curve for unconfined tests as the rate decreases and therefore as the cracking activity decreases.When tests were conducted under confinement, the lateral or confining stress increased almost
proportionately with axial stress during the initial loading period, for example up to about 450 s in Figure 6d. As the axial load increased further with time, the lateral load increased with lower rate. It was noted in all the observations that long and narrow cracks first form with their widths parallel to the direction of the axial load and their long directions parallel to the length of the columnar grains, i.e., parallel to
q
axis. This observation is similar to what was noted in unconfined creep tests (Gold, 1972) and strength tests (Sinha, 1982) on fresh water columnargrained S-2 ice. The primary reason for the formation of this type of crack is the two-dimensional nature of deformation in columnargrained ice whenFIG. 10 Relationship between axial failure stress and the corresponding failure strain.
loaded at right angles to the length of the columns. With the continuation of loading, however, the material is forced to deform along the length of the c o l ~ , and cracks also start forming at right angles to the columns. Similar observations have also been made in fresh water S-2 ice (Frederking, 1977) during confined tests. This additional mode of deformation introduces a new mechanism of accommodation and lowers the rate of increase in the lateral stress level. Although this subject will be discussed in detail elsewhere, it is appropriate to mention here that the bifurcation in Figure 10, the divergence in Figure 11 and lower rate sensitivity of a l f may be associated to this mode of deformation. It should be mentioned here that Iiirayama et a1 (1975) also noted the formation of horizontal cracks in fresh water 5-2 ice during indentation tests but not until the-maximum load was developed.
Figure 12 shows the observed ratio of the lateral stress and the axial stress at upper yield as a function of average strain rate. It also shows the ratio of the lateral strain and axial strain at oaxipum axial load. The results are rather scattered and, although there appears to be a trend, the effect of strain rate on either the stress ratio or strain ratio cannot be definitely determined. I)n the average the lateral stress has been found to be 71
*
14% of the axial failure stress. The average strain ratio is 0.33 k 0.12. The latter quantity, in fact, gives a measure of the degree of confinement and hence the compliance of the confining frame. Coincidentally this ratio is close to Poisson's ratio of purepolycrystalline ice. Therefore the results obtained here may be applicable to many real life situations where the confinement is provided by the bulk of the ice itself.
CONCLUSIONS
10-6 10-5
AVERAGE STRAIN RATE,
1
af, s-lFIG. 11 Dependence of upper axial yield strain on strain rate. r
;
1.2 \ E w ? I 1 1 1 1 1 1 ~ 1 I 1 1 1 1 1 1 STRESS RATIO 0 STRAIN RATIO-
.
.
-
.
. .
0.71 f 0.14m
4 0 . a-
0 a.
0 0om
_+ 0.12-
7
'
'
-
-
n -o-
0e
0-
I I I 1 1 1 1 1 1 I I I I ~ I I LAVERAGE STRAIN RATE, Claf, s-l
Fully desalinated second-year columnar-grained sea ice with orthotropic texture and fabric has been tested in the field in the High Arctic under confined
compressive loading conditions over a wide range of nominally constant cross-head rates at a constant temperature of -lO°C. Both stress rate and (measured) strain rate analysis showed that the axial upper yield stress is not affected by the orientation of the load axis with respect to the major crystallographic axis of the grains, where axes of both load and confinement are in the plane at right angles to the long axis of the columnar grains. When compared with the unconfined strength of laboratory-made fresh water
columnargrained ice (as a benchmark), both analyses show that the confinement increases the strength considerably but'significantly decreases the rate sensitivity of strength. Both analyses show that the ratio of the confined to the unconfined strength is rate sensitive but the stress rate analysis results in significantly higher ratio than the strain rate analysis. The latter, and more preferable, analysis yielded a ratio of 3.6 to 1.8 in the range of
1 x 10% si to 1 x lo* s l . Rate sensitivity of the axial failure strain increases considerably by
confinement, and the axial failure strains under confinement are about ten times greater than the corresponding values for the unconfined tests. The ratio of the lateral strain at the time of upper yield strain varies significantly, with the average value of 0.33 2 0.12. The corresponding stress ratio is 0.712 0.14. The most startling observation is that the confined strength of this sea ice is the same as that of fresh water laboratory-made ice tested under almost ideal conditions. This investigation shows that high quality tests can also be performed under field conditions although the test conditions were far from ideal.
ACKNOWLEDGEMENTS
The author is grateful to R.O. Rameeier for the opportunity to participate in the Radarsat Mould Bay Experiment 111 and for financial support by Atmospheric "-.vironment Service of Environment Canada. He wishes also to express his sincere thanks to C. Bjerkelund, D. Hagen, D. Lapp and L.B. Solar for their assistance in the field and to R. Jerome for his assistance in all the phases of this work including the designing of the subpress. The author particularly acknowledges his wife's full support of this field work even though the birth of their daughter was imminent.
This paper is a contribution from the Division of Building Research, National Research Council of Canada, and is published with the approval of the Director of the Division.
FIG. 12 Strain rate dependence of confining to axial stress ratio and confining to axial strain ratio at upper yield.
REFERENCES
Blanchet, D. and H. Hamza (1983) Plane-strain colpressive strength of first-year Beaufort Sea ice. Proc. 7th POAC 83, Helsinki, Finland, V. 3, p. 84-96.
Cox, G.F.N., J.A. RichterMenge, W.F. Weeks, M. Mellor and 8. Bosworth (1984) Mechanical Properties of Multi-year Sea Ice, Phase I: Test Results, U.S. Army CRREL Report 84-9.
Digby, S.A. (1984) Remote sensing of drained ice areas around breathing holes of ice-inhabiting seals. Canadian Journal of Zoology, 62, p. 1011-14. Frederking, R.M.W. (1977) Plane-strain compressive
strength of columnar-grained and granularsnow ice. J. Glaciology, 18 (801, p.,505-516. Gold, L.W. (1972) The failure process in
columnar-grained ice. National Research Council of Canada, DBR Paper No. 369 (Ph.D. Thesis, McGill University, Montreal).
Hirayama, K., J. Schwarz and H.C. Wu (1975) Ice forces on vertical piles: Indentation and penetration. Proc. 3rd Int. Symp. on Ice Problems, (Int. Assn. Hydraulic Research), Hanover, N.H., p. 429-441. Holt, B. and S.A. Digby (1984) Processes and imagery of
fast first-year sea ice during the melt season. To be published in J.G.R.
Nakawo,
M.
(1983) Measurements on Air Porosity of Sea Ice. Annals of Glaciology,V.
4, p. 204-208. Nakawo, M. and N.K. Sinha (1984) A note on brine layerspacing of first-year sea ice. Atmosphere-Ocean,
V.
22, No. 2, p. 193-206.Sinha, N.K. (1977) Dislocation in ice as revealed by etching. Phil. Mag.,
V.
36, No. 6, p. 1385-1404.Sinha, N.K. (1981) Rate sensitivity of compressive strength of columnar-grained ice. Experimental Mechanics,
V.
21, No. 5, p. 209-218.Sinha, N.K. (1982) Constant strain- and stress-rate compressive strength of columnargrained ice. J. Mat. Science,
V.
17, No. 3, p. 785-802.Sinha, N.K. (1983a) Field tests on rate sensitivity of vertical strength and deformation of first-year columnargrained sea ice. Proc. 7th POAC 83, V. 1, p. 231-242, Technical Research Centre of Finland, He lsinki
,
Finland.Sinha, N.K. (1983b) Field Test 1 of compressive strength of first-year sea ice. Annals of Glaciology, 4, p. 253-259.
Sinha, N.K. (1984) Uniaxial compressive strength of first-year and multi-year sea ice. Can. J. Civ. Eng.,
V.
11, No. 1, p. 82-91.Timco, G.W. and R. Frederking (1983) Confined Compressive Strength of Sea Ice. Proc. 7th POAC 83, Helsinki, Finland,
V.
1, p. 243-253. Troy, B.E. Jr., J.P. Hollinger, R.O. Ramseier,K.W. Asms, M.F. Hartman and C.C. Luther (1984) Microwave emission from High Arctic sea ice during freeze-up. To be published in J.G.R.
Weeks, W.F. and A.J. Cow (1978) Preferred crystal orientations in the fast ice along the margins of the Arctic Ocean. Journal of Geophysical
Research, 83(C10), p. 5105-5121.
Weeks, W.F. and A.J. Gow (1980) Crystal alignment in the fast ice of Arctic Alaska. Journal of Geophysical Research, 85(C2), p. 1137-1146.
reprbrted from
P m s w U w p d t W - O f f r k o r r ~ k r d
-&@m,&,qsym#dwm-v*il
wmr:
Jkr S. armg(Beak Plo.
W n a m I
THE AMERICAN SOCIETY