Choice Modeling with Observed and Unobserved
Information Search
by
Yifei Xie
B.Sc., Technion
-
Israel Institute of Technology (2017)
Submitted to the Department of Civil and Environmental Engineering
in partial fulfillment of the requirements for the degree of
Master of Science in Transportation
at the
MASSACHUSETTS INSTITUTE OF TECHNOLOGY
June 2019
Massachusetts Institute of Technology 2019. All rights reserved.
Author
...
Signature redacted
Department of Civil and Environmental Engineering
May 17, 2019
Certified by...Signature
redacted
Moshe E. Ben-Akiva
Edmund K. Turner Professor in Civil Engineering
Thesis Supervisor
Signature redacted
Accepted by ...
...
-'I~eidi
Nepf
Donald and Martha Harleman Professor of Civil and Environmental
MASSACHUSETTS INSTITUTE
Engineering
OF TE-CHNQLgy- niern
Chair, Graduate Program Committee
JUL 10 2019
Choice Modeling with Observed and Unobserved Information
Search
by
Yifei Xie
Submitted to the Department of Civil and Environmental Engineering on May 17, 2019, in partial fulfillment of the
requirements for the degree of Master of Science in Transportation
Abstract
This thesis contributes to the continuous effort of enhancing discrete choice models with richer behavior representations by explicitly modeling the information search process leading up to a choice. Information search includes information acquisition as well as information processing, the respective observability of which often raises challenges in the modeling. The observability of information acquisition is contingent on the context of the choice situation and data collection, while information processing is a mental process that is by nature latent to the modelers.
First part of the thesis considers the specific case of information search under the context of smart mobility services. Leveraged on clickstream data, the information acquisition in this case is observable. With the assumption that the acquired informa-tion would be fully processed, a modeling framework is proposed to directly model the observed information search decision, and integrate it with other relevant decisions in smart mobility usage including subscription, menu choice and opt-out choice. The framework is illustrated through Tripod, a mobility service which provides on-demand incentives for sustainable travel behaviors.
The second part of the thesis considers the case where the decision-maker might not process all the acquired information. A search action model is proposed to fully acknowledge the latency of the information processing behavior and hence account for its influence on the final choice. This model assumes that the decision-maker has acquired the information and only considers the information processing behavior. As an extension to standard random utility maximization (RUM) models, the framework is especially relevant for modern travel behavior modeling where real-time travel in-formation is often readily available but not always considered in decision-making. A preliminary Monte Carlo experiment is conducted to validate model identification and estimation.
Thesis Supervisor: Moshe E. Ben-Akiva
Acknowledgments
Firstly, I would like to thank my advisor Prof. Moshe Ben-Akiva for guiding me through the research world of discrete choice analysis and demand modeling while giving me the freedom to choose and follow my research interest.
I would like to thank the postdoctoral associates, research scientists and other professors who I had the pleasure to work with. These include including Prof. Carlos Lima de Azevedo, Dr. Arun Prakash Akkinepally, Prof. Bilge Atasoy, Prof. Angelo Guevara, Dr. Jimi Oke, Dr. Ravi Seshadri and many others.
I would like to thank my friends and colleagues at the ITS lab and fellow students in the MST program. These include Mazen Danaf, Siyu Chen, Youssef Medhat Aboutaleb, Eytan Gross, Peiyu Jing, Yundi Zhang, Haizheng Zhang, Xiang Song, Isabel Viegas de Lima, Narindra Peaks and many others. I honestly enjoyed every discussion we had about research and beyond.
I would like to thank the co-authors of Xie et al. (2018), Xie et al. (2019b) and Xie et al. (2019c). This thesis is mainly based on these research projects that we've accomplished together.
I would like to thank Prof. Tomer Toledo at the Technion with whom I worked with prior to MIT. Tomer led me into the world of research and sparkled my interest
in discrete choice modeling and transportation.
Last but not the least, great thanks go to my parents who have always been so supportive of all the decisions I made. Their education made me who I am today.
Contents
1 Introduction 13
2 Observed Information Search: the Case of Smart Mobility Services 19
2.1 The rise of smart mobility services . . . . 19
2.2 Overall framework . . . . 22
2.2.1 Framework formulation . . . . 22
2.2.2 Logsum calculation . . . . 25
2.2.3 Data requirement . . . . 25
2.3 Case study: Tripod . . . . 26
2.3.1 Background . . . . 26
2.3.2 Data collection . . . . 26
2.3.3 Sample characteristics . . . . 32
2.3.4 Model specifications and estimation results . . . . 33
2.3.5 D iscussion . . . . 42
3 Unobserved Information Search: the Search Action Model 47 3.1 Model formulation . . . . 48
3.1.1 The general information search process . . . . 48
3.1.2 Econometric modeling: the observed case . . . . 51
3.1.3 Econometric modeling: the unobserved case . . . . 63
3.1.4 Estim ation . . . . 64
3.2 Monte Carlo Experiment . . . . 65
3.2.2 Parameter recovery . . . . 67
3.2.3 Comparison with logit mixture . . . . 67
List of Figures
1-1 Process and context leading to a choice (Ben-Akiva et al., 2012) . . . 14
2-1 Tree representation of mobility service usage with two-way dependencies 23 2-2 User interface of the Tripod app . . . . 27
2-3 Pre-survey interface . . . . 28
2-4 Revealed-preferences interface . . . . 29
2-5 Stated-preferences interface . . . . 31
2-6 Sample characteristics . . . . 33
2-7 Value of schedule delay . . . . 44
2-8 Value of token (incentive) . . . . 45
2-9 Hypothesis explaining the perception of token . . . . 46
3-1 The process of information search . . . . 49
3-2 Examples of search protocols . . . . 51
3-3 Formulated search protocol . . . . 53
3-4 What the model should describe . . . . 54
List of Tables
2.1 Variables in the subscription model . . . . 35
2.2 Parameter estimates of the subscription model . . . . 36
2.3 Variables in the service access model . . . . 37
2.4 Parameter estimates of the service access model . . . . 38
2.5 Variables in the menu product choice model . . . . 39
2.6 Parameter estimates of the menu product choice model . . . . 40
2.7 Variables in the regular choice model . . . . 41
2.8 Parameter estimates of the regular choice model . . . . 42
2.9 Value of travel tim e . . . . 43
3.1 Monte Carlo experiment: parameter distributions . . . . 66
3.2 Monte Carlo experiment: the search action model . . . . 68
3.3 Monte Carlo experiment: logit mixture . . . . 69
Chapter 1
Introduction
In modeling choice behavior1 , operational utility-based econometric models have been widely accepted and applied in research and practice for over half a century. Albeit their success, there exists accumulating behavior evidence showing that these models fail at certain circumstances (McFadden et al., 1999). While some search for alterna-tive decision theories (e.g. Tversky, 1972; Kahneman and Tversky, 1979; Loomes and Sugden, 1982; Busemeyer and Townsend, 1993), another stream of research focuses on improving the explaining power of utility-based models by incorporating the process and context often left out by basic models which only consider simple mappings from the attributes presented in the data to the choice (McFadden et al., 1999; McFadden, 2000; Ben-Akiva et al., 2012). Ben-Akiva et al. (2012) has summarized the context and process leading to a choice as in Figure 1-1, suggesting that the inclusion of cor-responding components and mechanisms would enhance choice models and address known violations of rationality assumptions. Successful examples include Brock and Durlauf (2003) which incorporates social interactions into multinomial logit, and Ben-Akiva (2010) which accounts for the latent planning process in choice-making. One of the key advantages of these works is that they improve the model at a relatively minimal cost in terms of interpretability and tractability. Following this stream of research, this thesis aims at the incorporation of the information search process into
'For an introduction to discrete choice analysis, the readers are referred to the textbooks Ben-Akiva and Lerman (1985); Train (2009).
choice modeling in an operational and yet theoretically sound manner.
Context Process
Opportunities,
Family: Constraints,
Tight Social Network Information
Attitudes, Affect, Friends: Perceptions/Beliefs Loose Social Network
Choice
Plan Market
Preferences
Figure 1-1: Process and context leading to a choice (Ben-Akiva et al., 2012)
Information search and how it affects decision-making have been closely examined in different fields and under various context. To name a few examples, see Stigler
(1961) and Caplin and Dean (2011) in Econometrics; Kleinmuntz and Schkade (1993) and Hausmann and Ldge (2008) in Psychology; Moorthy et al. (1997) and Luce (2015)
in Consumer Research; Vogt and Fesenmaier (1998) and Gursoy (2019) in Tourism Research. In the following introduction, I shall briefly introduce the components of and motivations for information search, followed by a review of relevant quantitative treatment in travel behavior as this thesis centers around transportation applications. Information search consists of two components: internal search where the person retrieves information stored in his/her memory, and external search where the person seeks information from the environment (Hulland and Kleinmuntz, 1994; Lynch Jr and Srull, 1982). The time and effort spent in these two components depend on the choice context, including factors such as the cost of acquiring external information, time pressure, incentives to produce an accurate response and the amount of previous
experience (Payne et al., 1993; Hulland and Kleinmuntz, 1994). A significant volume of research investigates the internal search behavior under experimental settings to understand its process and determinants (e.g. Biehal and Chakravarti, 1982; Nedun-gadi, 1990). These works are fundamental for understanding how people retrieves, collects and processes information from memory, however gaps remained for holistic and quantitative integration of the findings into applicable models. The majority of literature on quantitative treatment of information search focuses on the external search since it is easier to observe and validate. In this thesis, I shall focus on the modeling of external search behavior while assumptions are placed on the outcome of internal search.
Motivations for external information search include discovering unknown alter-natives and assessing attributes of known alteralter-natives (Chorus et al., 2006a). The former case and its implication on decision-making have been examined extensively to account for that consumers don't necessarily look for and hence not be aware of all the alternatives in real markets (e.g. Stigler, 1961; Moorthy et al., 1997; Caplin and Dean, 2011). Optimal search strategies and selection rules have been developed under this context. External information search for attribute assessment have been examined predominantly in the travel behavior modeling as its relevancy in familiar choice situations with uncertain attributes such as in a mode choice.
In transportation applications, the importance of modeling information search and its implication have been particularly recognized as the advancements in Advanced Traveller Information Services (ATIS) which make accurate and real-time travel infor-mation increasingly accessible (Chorus et al., 2006b). I shall introduce a few research efforts in a chronological order. Ben-Akiva et al. (1991) formulated the travel time information acquisition and processing behavior of motorist under the influence of real-time traveler information services, and how to integrate it into dynamic network models. Arentze and Timmermans (2005) conceptualized travel's positive utility as a means to gain information about their environment and/or to seek variety or nov-elty2. Taking risk aversion into account, De Palma and Picard (2006) studied the
2
effect of travel time information provision in route choice on equilibrium travel time.
Chorus et al. (2006a) and Chorus et al. (2008) modeled information acquisition be-havior through its benefit represented by decision strategy-specific expected regret.
Chorus and Timmermans (2008), Chorus et al. (2010) and Chorus et al. (2013) mod-eled information search through expected utility theory, where the perceived benefit of information is specified as the expected maximum utility of the choice set after acquiring the information. They consider both the information search for discov-ering previously unknown alternatives and attribute assessment. Gao et al. (2011) proposed a latent class model to account for the unobserved information search on route choice, however it only considers search of a single attribute which is the travel time. Toledo and Sharif (2019) specifically studied the effect of the type and content of information drivers are provided with on their travel time expectations and man-aged lane choices. Ding-Mastera et al. (2019) developed a latent-class routing policy model which considers that the travelers could look ahead to incorporate real-time information that was not yet available at the time of decision.
As external information search includes information acquisition and information processing, the above-mentioned econometric literature mainly considers the infor-mation acquisition process with the implicit assumption that the acquired informa-tion would be fully processed. On the other hand, psychologists have established experimental evidence regarding how people process the acquired information (e.g. Montgomery and Svenson, 1976), which will be further introduced in chapter 3.
It is worth noticing that the implications of information search are sometimes explained by alternative theories. Most models for attribute non-attendance describe the cause of it as decision makers' zero sensitivities towards corresponding attributes (Collins et al., 2013). Decision Field Theory models the decision process as shift-ing of attentions between attributes driven by cognitive mechanisms to reflect the information processing behavior (Busemeyer and Townsend, 1993; Roe et al., 2001; Berkowitsch et al., 2014; Forstmann et al., 2016; Hancock et al., 2018).
by choosing uncertain alternative at stake to learn about how to make better choice in future similar
situations), not the commonly considered case where the search refer to acquiring information from other sources.
To conclude the existing works on information search and travel behavior, we could see that efforts have been put into explaining and modeling behaviors under specific contexts. However, the information search behavior under the context of smart mobil-ity services has not been scrutinized. In addition, to the best of my knowledge, there isn't any general econometric model which explicitly takes the information processing behavior into consideration.
In this thesis, I fill the above-mentioned gaps by considering two cases of modeling information search. The second chapter is to leverage on observed information search revealed by clickstream' data under the specific context of smart mobility services. The modeling framework explicitly consider the sequential and yet inter-connected decision-making stages specific to smart mobility service usage, including the service subscription, information search (service access), menu product choice and opt-out choice. Different models are connected by feeding logsums. I argue that the proposed modeling framework is essential for accounting the impacts of real-time on-demand system's dynamics on traveler behaviors and capturing consumer heterogeneity, thus being greatly relevant for integration in multi-modal dynamic simulators. See an application in Danaf et al. (2019c) for simulation of recommendation systems for example. The methodology is applied to a case study of an innovative personal-ized on-demand real-time system Tripod4 which incentivizes travelers to select more sustainable travel options. The data for model estimation is collected through a smartphone-based context-aware stated preference survey. The proposed methodol-ogy is flexible to be applied to model other smart mobility services such as ride-hailing services and the emerging MaaS (Mobility as a service).
The third chapter considers the case where the decision-maker might not process all the acquired information. A search action model is proposed to fully acknowledge the latency of the information processing behavior and hence account for its influence on final choice. This model assumes that the decision-maker has acquired the infor-mation and mainly considers the inforinfor-mation processing behavior, which is in contrast
3
refers to the click path of the users on an mobility app, or generally the click path of apps on smartphones
4
with the previous literature that predominantly considers the information acquisition behavior. As an extension to standard random utility maximization (RUM) models, the framework is useful for various choice modeling scenarios, especially for modern travel behavior modeling where real-time travel information is often readily available but not always considered in decision-making. A preliminary Monte Carlo experiment is conducted to validate model identification and estimation.
Chapter 2
Observed Information Search: the
Case of Smart Mobility Services
This chapter discusses a modeling framework accounting for the observed information search decisions under the specific context of smart mobility and its integration with other decisions in smart mobility usage.
The chapter is organized as follows. I shall first give the general background of smart mobility services and the existing literature on their choice modeling. In the second part, a modeling framework accounting for the information search and other relevant decisions is presented, followed by an elaboration of the data required for estimation. Lastly, a case study on Tripod is presented.
2.1
The rise of smart mobility services
In recent years, emerging new mobility services, including ride-hailing, ride-sharing, bike-sharing, and carsharing systems have gained popularity worldwide. Uber, which operates in 700 cities across 6 continents, has served over 10 billion trips as of 2018 September since its first appearance in 2012 (Chai, 2019). Five billion of these trips happened between the September of 2017 and the September of 2018. DiDi Chuxing, despite its safety scandals, delivered 48.8 billion kilometers of trips in 2018, which is more than 5 Earth-to-Neptune round-trips (Zhang, 2019). The French-born
peer-to-peer carpooling digital platform BlaBlaCar claims to have 60 million members in 22 countries and serves over 18 million travelers every quarter (BlaBlaCar, 2019). The attempts to design, test and implement MaaS (Mobility as a service) platforms which vend travel packages integrated from different service providers have also emerged in the last 5 years.
The success and the still growing interest in these new mobility solutions are largely due to the advancement of Information and Communications Technologies (ICTs) in that these services usually enable on-demand, efficient, convenient and per-sonalized usage through mobile applications. These mobility services usually require users to (i) subscribe (register) to a given service, (ii) request a service menu with product option(s) through a mobile application and (iii) select the preferred product. I refer to this broad group of mobility services as smart mobility services. Commonly, the relevant data is recorded by service operators to understand user behavior, which provides an natural opportunity for treatment of information search behavior in this specific context.
When designing a new transportation service/mode, predicting its demand and its sensitivity with respect to service attributes is critical. Currently, the state-of-the-art approaches rely on disaggregate behavioral modeling and activity-based models (ABM) (McFadden, 1974; Ben-Akiva and Lerman, 1985; Rasouli and Timmermans, 2014; de Lima et al., 2018). Since smart mobility services are often dynamically tailored to different individual preferences and contexts (e.g. time-of-day, supply de-mand matching), disaggregate behavioral models are essential for the accommodation of their complex dynamics and hence enable the quantification of user benefits and overall transportation impacts (such as congestion and other externalities). Con-structing and understanding these models thus are of great interest to researchers, practitioners and service providers. As such, behavioral enhancements to these disag-gregate models such as the incorporation of information search could generate tangible benefit.
Current research on the behavior side of smart mobility services mainly focuses on exploring the behavioral insights qualitatively based on aggregate analysis of surveys
(e.g. Rayle et al., 2016; Clewlow, 2016). As indicated by Jittrapirom et al. (2017), models for MaaS or other smart mobility services have been limited so far, partially due to that these services are emerging at marvelous speeds.
To the best of my knowledge, discrete choice models for smart mobility service have been focusing only on either the subscription choice or the product choice. In both cases, usually the information search decision (i.e., whether opening the app) and its impact are not considered. To name a few efforts put in these two streams, Ghose and Han (2014) investigated the demand (number of downloads) of apps through a 3-level nested logit with individual taste heterogeneity and nests based on app attributes. Zoepf and Keith (2016) estimated a logit mixture with taste heterogeneity to evaluate how carsharing users value each attribute displayed in a product menu. Dias et al. (2017) used a bivariate ordered probit model for the use of ride-hailing and car-sharing services in terms of weekly usage frequencies. Matyas and Kamargianni (2018) investigated subscription preferences towards various product bundles in a MaaS setting by logit mixtures with taste heterogeneity. Choudhury et al. (2018) used nested logit to model the mode choice between smart mobility solutions and existing modes, along with other choice dimensions. Seshadri et al. (2019) used logit mixture to model the mode choice between existing modes and autonomous mobility on-demand service in Singapore.
While the above-mentioned papers are useful to draw behavioral insights from a specific episode of the decision process, they all missed at least one important component of the described decision process. All the papers do not consider the information search (menu access). The majority of the papers do not consider either subscription or its relation to menu choice. All the papers fail to capture at least part of the connections between the decision-episodes. These incomplete and segmented treatments could potentially result in biased conclusions and hamper the engagement of the models in simulations in that assumptions on the un-modeled decision stages would have to be made (e.g. if one has only modeled the mode choice decision, he/she would have to assume a penetration rate for subscription in simulation). With these being said, there is a reason of such lack of treatment as relevant clickstream data
revealing sub-decisions are commonly treated as business secrets by the operators and hence kept away from the researchers and the public. In this chapter, I shall also introduce how to circumvent this practical issue by the state-of-the-art context-aware SP experiment.
There are two unique actions in smart mobility services usage: subscription and menu access. The subscription could be treated in a similar fashion as car-ownership and transit card purchase (e.g. Pinjari et al., 2011; Le Vine et al., 2014; Plevka et al., 2018), whereas the menu access action is driven by an unique information search decision. As the individual has to access the menu before choosing the product, the goal of search is mainly for alternative generation. The treatment of this information search behavior would allow us to capture the behaviors of travelers who checked the service menu but opted out and who didn't bother checking the menu because they expect unattractive options would have been offered. These behaviors are especially relevant for services which set up their service menu dynamically in real-time.
This chapter fills the aforementioned gap by developing an integrative frame-work which explicitly considers the information search decision and all other decision-making stages of smart mobility service usage, including the real-time and dynamic aspects of such service. Inter-individual heterogeneity is captured through logit mix-tures with distributed taste coefficients. The modeling framework could be either used as a stand-alone or embedded within common ABM frameworks.
2.2
Overall framework
2.2.1
Framework formulation
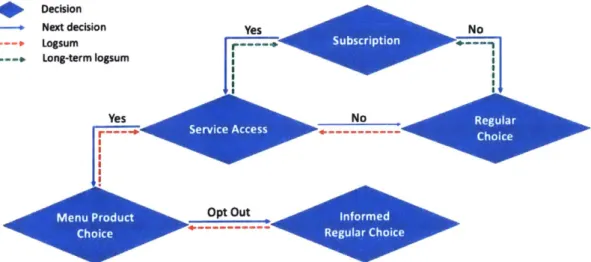
To properly incorporate the information search decision, we need to first summa-rize the relevant decision-making process in smart mobility service usage. This is summarized in Figure 2-1.
First of all, a person needs to decide whether to subscribe to a given service. This choice is represented by the subscription model. It typically involves downloading the
Decision
- Next decision Yes No
--- p Logsum r----.0 %-4
---. Long-term logsum
Yes No
Opt
OutFigure 2-1: Tree representation of mobility service usage with two-way dependencies
app (if app-based) and registering. With the goal to model the behavior in service
usage, the subscription here refers to people who actually consider to use the service
on a regular basis. If a traveler has not subscribed to the mobility service of interest,
then upon travel, he/she makes a regular choice, i.e., the choice set excludes options
offered by this service.
For a subscriber, the first decision prior to trip-making is whether to access the
service and view the offered products at all, which is represented by the service access
model (i.e. whether to search for information regarding smart mobility alternatives).
Here I do not consider the case where the subscriber accesses the menu just to acquire
real-time travel information, as in that case the subscriber should have resorted
spe-cialized services such as Google Maps. This assumption would have to be modified
for MaaS-alike service apps which might serve both as a service request portal and
as a real-time information provider. The access decision might be influenced by the
trip context (e.g. trip purpose, traveling party) and the user's past experience with
the service. Sometimes travelers don't consider using a service as they expect the
operator would offer unattractive terms (for example travelers might expect higher
price in rush hours) and therefore do not check the menu
-
while what is offered in
the menu might actually be attractive. The explicit modeling of service access model
captures this behavior.
Figure 2-1 represents the choice situation of a subscriber who has not accessed the service and that of the non-subscribers by the same model, however, it doesn't mean that these two types of travelers should behave identically. This potential behavioral difference could be incorporated into the model specification by segmentation.
If the user decides to access the service, a service menu would be presented and the user would evaluate the products through a menu product choice model (see an example of a product menu in Figure 2-2). If the user likes one of the products in the menu, he/she would select it and execute the trip. The user may also reject the entire menu (opt-out) and choose some alternative other than the mobility service at stake. For subscribers, the choice situation after opt-out (informed regular choice in Figure 2-1) is different from the one without opening the app (regular choice in Figure 1) in that the options offered by on-demand mobility services usually also provide users with real-time information (e.g., availability of alternatives, travel time estimates). The impact of real-time travel information is specifically discussed in Ben-Akiva et al. (1991) and Mahmassani and Liu (1999). For example, if a traveler checks a car-based ride-hailing app prior to travel during a congested period and opts out, she/he may be more likely to select non-road modes.
Based on the sequential nature of the above-described decision process, higher level choices influence lower level ones. However, lower levels have significant impacts on the upper levels as well. When a traveler makes the subscription decision, the major consideration is whether the mobility service is attractive, which is reflected through the experience and perceived benefits of using the corresponding mobility service, including the app. Furthermore, whether to access the service for a given trip depends on users' perceptions of the attractiveness of the menu (gain of information search) given the context of the trip, the attributes of the potential service products and the user's sensitivities towards them. To capture this bottom-up dependency, a multi-level nesting structure is proposed. The logsums feedings between levels provide measurements of attractiveness of the lower levels, and their coefficients show the corresponding sensitivities.
on-demand mobility service: (1) a subscription model, (2) a service access model, (3) a menu product choice model, (4) an informed regular choice model for those who opts out, (5) a regular choice model for uninformed users and non-subscribers.
2.2.2
Logsum calculation
The logsum passing directions are illustrated in Figure 2-1 by dashed lines. By definition, logsum represents the expected maximum utility from the corresponding lower level. We want to stress two logsum computations that require additional attention. First, the logsum from the menu product choice model to service access model should depend on the users' prior beliefs (what they expect to see), rather than what would be truly offered. An example of how this is handled in the context of the case study could be found in subsection 2.3.4. Second, the long-term logsum (green dashed lines in Figure 2-1) should be computed based on corresponding lower level models applied to multiple trip contexts pertinent to the traveler and weighed according to their frequency and/or importance.
2.2.3
Data requirement
To estimate the modeling framework we described, a dataset which covers the com-plete decision sequence is desired. While the menu product choice and subscription choice are straight-forward to elicit, the service access choice is intricate. If revealed preference (RP) data is used, besides the trips and the choice that are common to most RP datasets, it has to contain information regarding service access decisions. These could be acquired by tracking the respondents' smartphones (clickstream data collection) or by including related questions (e.g., "Did you access Uber App for this trip?") in the RP survey. While the first one requires additional efforts in the data collection (which might be very challenging based on the current status of the indus-try), the second may cause under-reporting of the access-then-opt-out behavior. On the other hand, if stated preference (SP) data is used, service access process needs to be presented and the corresponding clickstream needs to be recorded. In
subsec-tion 2.3.2, we describe how we addressed this by smartphone-based SP in the context of Tripod.
2.3
Case study: Tripod
2.3.1
Background
Tripod is an app-based on-demand system with the goal of achieving system-wide energy savings by providing information and incentives to travelers (Azevedo et al., 2018). It doesn't provide a mobility service per se but offers incentives for more energy efficient travel options through a personalized real-time travel menu. The travel decisions of interest are mode, route, departure time, trip-making and driving style. In response to any changes in any of the above dimensions, users receive incentives in the form of tokens that can then be redeemed in a market place for a variety of goods and services. Like in the above-mentioned decision process, a Tripod user has to subscribe to the app and decide whether to request a Tripod menu before each trip. The menu is presented to the user (see Figure 2-2) with information about the recommended options and their tokens. The tokens for each alternative are calculated based on the energy savings from the expected choice without Tripod and the menu is personalized according to the user's preferences, characteristics and network attributes (Song et al., 2018; Danaf et al., 2019b). The user may select an option from the menu and use the Tripod app to navigate to the destination or opt out. In the first case, the app monitors the travel of the user and rewards her/him at the end of the trip if the guidance was followed.
2.3.2
Data collection
In this section we describe the data collection for Tripod, which is based on the methodology proposed by Danaf et al. (2019a).
The core data collection platform is the smartphone-based Future Mobility Sensing (FMS) platform (Cottrill et al., 2013; Zhao et al., 2015; Seshadri et al., 2019). It
ih45 0,00 0;
SAC . mins 45 Takens
W II.U5t~
*
~
) .90 mrileS 45 Tokels >. I S Smiles 39 Tokens 16 rains 0.13641iSommei6 30 S miles 2 Tokens
16 min 0 26 Gi
0 . * 6 30 riles 0 Tokens
so'--O-0 o-e
iur F2 U ttayhe
Muiseua bf Plg
C~ ady Trip SIummary sorr* Takenei 0 uve 0 Distence
Figure 2-2: User interface of the
Tufat 0~
~
iN Harvard u"aow1y 9.Miac 9w~naag #AuM& Bostco 16 nlii 02 6 Galloons 5 30 miles 0 Toke.nsTripod app
overcomes the main limitations associated with the traditional "paper-and-pencil" or
purely web-based questionnaires, such as under-reporting of trips, inaccurate time and
location information, high cost, and lack of detailed route information (Zhao et al.,
2015). FMS typically collects high quality RP data. In this study, a context-aware SP
was integrated into FMS for preferences towards Tripod. Pre- and post-surveys (also
integrated within the app) elicit information on socio-demographics and long-term
preferences and perceptions respectively.
Data collection was carried out in the Boston-Cambridge region and its vicinity
where 1940 observations from 202 participants were obtained, out of which 154
par-ticipants have finished the required 14 days of responses and exited the survey at
the time of model estimation (July 2018). Each respondent who had provided 14
days of RP data and completed the corresponding SP was rewarded with a 100-dollar
Amazon gift card
1.
'In the same data collection effort, SP surveys were also generated for another mobility survey (Atasoy et al. 2018). The 14 surveys required for each respondent are a mixture of the two (randomly presented with a higher frequency of Tripod appearance).
Pre-survey data
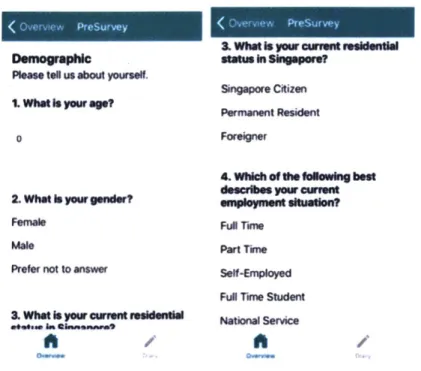
Upon downloading the app and registering, respondents were asked to fill out the
pre-survey. They were asked about their socio-demographics, such as age, gender,
working status, income, car ownership, bike ownership, and how frequently they use
different transportation modes. This information is not only used in the estimation,
but also for setting constraint and availabilities in SP profile generation. An example
2of the survey interface is shown in Figure 2-3.
Plea tell us about yourself. 1. Whet yo wwage?
3. What is your rent residential
usa i Singapore? Singapore Citizen Pernwnt Reskdent Foreigner 0 2. Whet Isyou Fernale Mee Prefer not to an .Whet Is yw OWiN
A. Wieh olefewing beet
descrIbm yaw currnt
FA Tune Part Thne sWW Sof-&npkoyed
FtA Tune Student
Furaesi: esu Nationierfice
Figure 2-3: Pre-survey interface
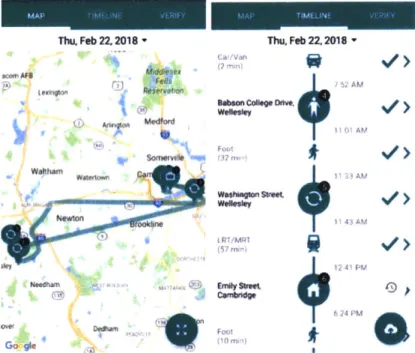
Revealed preferences data
After completing the pre-survey, RP data was collected in the form of trip and
ac-tivity diaries. The app collects location data (GPS, WiFi, GSM) on a continuous
basis. The data is processed in the backend for stop detection and inference for trip
mode and activity type. The app interface presents partially filled activity diaries
and reminds the respondents to validate their trip and activity diaries at the end of
each day. For activities, the data included activity purpose, location, start and end
2
from a pilot in Singapore
times. For trips, the origin, destination, travel mode, arrival and departure times
were obtained. Figure 2-4 shows an example of trip/activity diary validation. More
details are available in Cottrill et al. (2013); Zhao et al. (2015).
Thu. Feb 2Z 2018 W.m i Ae te~igWii
S~frW
P
MWdhom W " W. u Thu, Feb 22.2018"51
.' AMBow
ON
O
*i
43 AW. 0 6 43AM (57 Mir 12m) PFigure 2-4: Revealed-preferences interface
Stated preferences data
Upon validating their diaries, respondents were presented with daily SP questions.
For each validated day, a trip is randomly selected and the respondent is asked about
his/her choice if the trip had to be repeated under a hypothetical scenario (Figure
2-5).
The context-aware SP we adopted is different from the conventional SP's in that
the context of the experiments, although being still hypothetical, is coming from
the accurately collected RP data. Furthermore, the respondent-specific information
collected in advance through the pre-survey, such as, vehicle ownership, usage of
car/bike sharing services, etc. is used in the SP survey generation process as
con-straints. Google Maps API is used on the fly in order to obtain the travel times
and distances associated with different modes corresponding to the specific trip. As
Vt>
a result, we expect our SP to be closer to the true decision-making scenarios and hence able to elicit more realistic responses compared to alternative state-of-the-art SP approaches (Danaf et al., 2019a).
Each SP choice task is presented through a "profile", defined as a menu that in-cludes all travel alternatives available to the respondent (along with their attributes), with the addition of a Tripod menu including options provided by Tripod (see example in Figure 2-5).
The set of alternatives might include non-motorized modes (walking, biking, and bike-sharing), private motorized modes (car and carpooling), on-demand modes (e.g. Uber/UberPool, Lyft/Lyft Line, carsharing, and taxi), and transit (with walk, bike, or car access). The attributes of these alternatives are presented in Danaf et al. (2019a). Each of these sets are shown in a separate tab, alongside the tab for Tripod menu (Figure 2-5). Furthermore, respondents are presented with ranges that reflect
uncertainty in the attributes such as travel time and waiting time.
The Tripod menu presents a subset of the existing alternatives with changes across multiple dimensions that generate energy savings, e.g., the departure time may be delayed (between 15 and 90 minutes), a different route or driving in an eco-friendly way may be presented. Information on energy savings (relative to the RP choice) and tokens assigned to alternatives are also presented. Energy consumption values are obtained from TripEnergy (Needell et al., 2016). Only alternatives with positive energy savings could be included in this menu.
Upon accessing the SP for the first time, respondents are presented with a "mar-ketplace" showing the items that can be purchased with tokens (Figure 2-5). The redemption value of tokens is fixed for each individual. The marketplace is accessible to the respondents throughout the SP.
SP Profiles are generated based on a random design and validated using valid-ity checks that eliminate dominant and inferior alternatives or unrealistic attribute
combinations. The profile generation algorithm was validated using Monte-Carlo
Somerville Watertown Ca Boston ton c& ca Br e C3) ion RE A V"Iti
p dm@2tSGooIc Temof u"W
Con.. def the jouffney y"'u w ocnlly n' Idt
! om Vterans Of Foreign Ware Parkway. Brookline (Home) a! 201M04/3 13:44 PM
: Education (Education) 2018/04/03 14:20 PM by driving
* To view your acovites of the week viSAI
Dashboard
CUlPWlItw . total Travel loe
4I 30-35min 0m1 7.22 . 6m1 20-25mbn 2mmn 1.50 USolgallen 4.25 1SO 1.00 USo USER
0
I otal ravel hme
23- 32 in 0m eow trip I II ISO 6-10mi 9.03 MI 17-22min
I
t. a us.b
ToW Travel Tim 44min,It;,
Figure 2-5: Stated-preferences interface
1
Post-survey data
Upon completing two weeks of data collection, respondents are presented with the post-survey, which collects feedback on the potential use of Tripod if it existed in real life, attitudes and perceptions towards energy consumption, environment, mobile apps and technology in general. As an example, respondents rate statements like "I would use Tripod if it were available today" on a 5-point Likert scale (see subsection 2.3.4 for more details).
2.3.3
Sample characteristics
After data cleaning, sessions completed within 10 seconds were excluded (likely cor-respond to random selections), as well as profiles corcor-responding to trips with very long distances (e.g. flights and inter-city trips). As a result, 1155 surveys from 183 individuals are used in the analysis. Figure 2-6 shows the sample distributions of em-ployment status, number of household vehicles, age and household income compared to the population distributions in the survey region based on American Community Survey (ACS). For employment status distribution in the population, we only consid-ered population 16 years old and over because younger population is not considconsid-ered as the market of Tripod (limited discretion and not allowed to drive). Since the survey is smartphone-based, the sample is biased towards young respondents as expected. In addition, household income group 50k to 99k (annual) are slightly over-sampled.
70% 50% sample 60% Boston Census 50% 40% Cambridge Census S? 40% 2 30% U 30% 0)20% 20% 10% 0% 0%
Worker Student Unemployed Other 0 1 2 3 4 or more
Employment Status Number of Household Vehicle
50% 35% 30% 40% 25% 10%0
~30%
cc0 Cu/~15%
U) 20% 10% 10% 5%- .'Age Annual Household Income
Figure 2-6: Sample characteristics
2.3.4
Model specifications and estimation results
In this section, we apply the model structure proposed in section 2.2 to the case of Tripod. Each model component is formulated and estimated with the data described in subsection 2.3.2. In the SP setting, we present attributes (such as travel time and cost) of all the alternatives to the respondents and expect them to assume the values are real. As a result, the regular choice model which should be based on expected attributes under uninformed conditions cannot be estimated using the SP data. To circumvent this difficulty, we estimated the informed regular choice model and used it as the regular choice model in the logsum calculations for model estimation as an approximation. We refer to this model as regular choice model in the rest of the chapter. Due to the limited sample size, the behavior of subscribers and non-subscribers are not differentiated in the regular choice model.
The models are estimated sequentially from the bottom in the following order: regular choice model, menu product choice, service access model and subscription model. This allows us to compute the logsums of the lower levels which is required
for the estimations of higher-level models.
We estimated the set of models by BIOGEME (Bierlaire, 2003). The models with inter-individual heterogeneity were estimated with maximum simulated likelihood. Halton draws (Halton, 1960) were used and the number of draws was decided based on the stationarity of the parameters. The advantages of using Halton draws are shown in simulation studies by Train (2000).
When estimating the models, I had the options of either estimating the model in willingness-to-pay space (normalizing cost parameter) or in preference space (nor-malizing scale of the error term) (see Train and Weeks, 2005). Although the two are theoretically equivalent, willingness-to-pay space usually gives more realistic distri-butions of willingness-to-pay's based on commonly assumed distridistri-butions of random parameters in logit mixture (Ben-Akiva et al., 2019). However, due the sample size, estimations in willingness-to-pay space fails to converge under selected specifications empirically. Consequently the models are estimated in preference space.
Subscription model
The subscription model is formulated as a hybrid choice model. Equation 2.1 and Equation 2.2 show the structural equations for the latent variables "app-lover" and "environmentalist". Equation 2.3 and Equation 2.4 show the measurement equations of the latent variables with their corresponding questions specified in Table 2.1. Equa-tion 2.5 shows the utility of app subscripEqua-tion.
A = ASCA + 3
BSXBS + I3TNCXTNC + UAZ
(2.1)
E = ASCE +/ 3VEH(XVEH > 1) + 3
HIXHI + O~EZ
(2.2)
iAn
=
aAn + /AnA+ (
for n=1,2,3 (2.3)iEn = aEn +
'EnE + c
for n
=1, 2,3
(2.4)
Usubscribe = ASCsub + IBAA + EE + /3 subIsub + /31nsubInsub + 6 (2.5)
The responses to the indicators of measurement equations (Equation 2.3 and Equa-tion 2.4) and whether to subscribe (EquaEqua-tion 2.5) are in 5-point Likert scales ranging
Variable Type Description
A latent App-lover
E latent Environmentalist
XBS binary whether a member of (using) any bikeshare service
XTNC binary whether a member of (using) any ride-hailing app XVEH vehicle number of household vehicles
XHI binary whether annual household income > 100k
z error term i.i.d standard normal distribution
E error term i.i.d extreme value type I distribution
iE1 indicator "I am aware of the energy impact of my daily travel"
iE2 indicator "I am interested in knowing how much energy I can save
in my commute"
iE3 indicator "I would like to share my energy savings with friends
and family"
iA1 indicator "I am a regular customer of eCommerce services"
iA2 indicator "I am interested in the latest technological advancements"
A3 indicator "I am interested in mobility apps" Usubscribe utility for subscribing Tripod
Isub logsum from the service access model
Insub logsum from the regular choice model
Table 2.1: Variables in the subscription model
from "strongly disagree" to "strongly agree". As the error terms in these equations are specified to follow the extreme value type I distribution, the models of the responses are in forms of ordinal logit. Due to the limited sample size and the answers being framed as symmetric, we assumed the to-be-estimated threshold values to be sym-metric. The ones for the whether-to-subscribe question are shown as an example in Equation 2.6. The thresholds for each question of each latent variable are estimated separately. In section 4.2, the estimated thresholds are subscripted according to the measurement equations' subscripts.
strongly disagree
if
- OC < Usubscribe < -s,1 - ,2disagree if - s,1 - 4s,2 < Usubscribe < - 6 ,1
Response = neither agree nor disagree if - s,1 < Usubscribe < s,1
agree if 41 < Usubscribe < s,1 + 4s,2
strongly agree if s,1 + 6s,2 < Usubscribe < oC
(2.6)
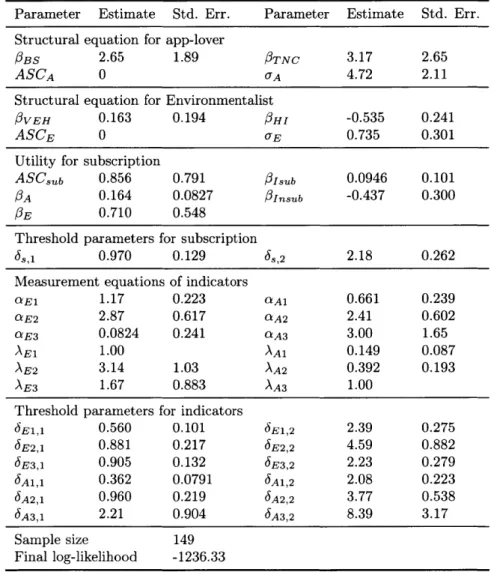
The estimation results are shown in Table 2.2. All the signs of parameters in the measurement equations of the latent variables are as expected. In the structural
equa-tion for app-lover, the signs of parameters are as expected whereas in the structural equation for environmentalist, /VEH is positive with a small magnitude relative to the standard error. This could possibly be explained by car-owners are more aware of energy consumption in their travel as it directly relates
in the model is done according to Daly et al. (2012).
to the fuel cost. Normalization
Parameter Estimate Std. Err. Parameter Estimate Std. Err. Structural equation for app-lover
BS 2.65 1.89 OTNC 3.17 2.65
ASCA 0 UA 4.72 2.11
Structural equation for Environmentalist
/VEH 0.163 0.194 1HI -0.535 0.241
ASCE 0 UE 0.735 0.301
Utility for subscription
ASCsub 0.856 0.791 3
Isub 0.0946 0.101 OA 0.164 0.0827 #3 nsub -0.437 0.300
OE 0.710 0.548
Threshold parameters for subscription
6s,1 0.970 0.129 s,2 2.18 0.262
Measurement equations of indicators
aE1 1.17 0.223 aA1 0.661 0.239 aE2 2.87 0.617 CA2 2.41 0.602 aE3 0.0824 0.241 aA3 3.00 1.65 AE1 1.00 AA1 0.149 0.087 AE2 3.14 1.03 AA2 0.392 0.193 AE3 1.67 0.883 AA3 1.00
Threshold parameters for indicators
6 E1,1 0.560 0.101 6 E1,2 2.39 0.275 6E2,1 0.881 0.217 6E2,2 4.59 0.882 6 E3,1 0.905 0.132 6E3,2 2.23 0.279 6A1,1 0.362 0.0791 6 A1,2 2.08 0.223 6 A2,1 0.960 0.219 6A2,2 3.77 0.538 6 A3,1 2.21 0.904 6 A3,2 8.39 3.17 Sample size 149 Final log-likelihood -1236.33
Table 2.2: Parameter estimates of the subscription model
Service access model
The service access model is formulated as a logit mixture with inter-individual het-erogeneity. The utility of accessing and not accessing are shown in Equation 2.7 and
Equation 2.8, with variables explained in Table 2.3.
Unac = ASCnac + !1nacIRC + 6
(2.7)
Uac =
ASCac
+
eT ERXTER + f3IacIMC + 6(2.8)
Variable Type/Unit Description Inter-individual distribution
of corresponding parameter
Unac utility for not accessing Tripod N/A
Uac utility for accessing Tripod N/A
IRC logsum from the regular choice fixed
IMC logsum from the menu product fixed
XTER US cent/token token exchange rate truncated log-normal distribution
Table 2.3: Variables in the service access model
As mentioned in section 2.2, the logsum entering Equation 2.7 should be based on what the respondents expect to see rather than what is truly offered. Tripod's person-alization algorithm limits the number of offered alternatives (currently to 5). Based on past experience, a respondent might be expecting a different set of alternatives from the one that is generated from the personalization algorithm for a trip. In this case, he/she would still access the service in the first place. Thus, in our estimation we included all the possible alternatives (the ones with energy-savings and hence positive incentives) from Tripod before the personalization for logsum calculation rather than what would truly appear on the single trip-specific menu. This provides us with an optimistic approximation of respondents' expectations. Ideally a behavioral expec-tation model would be necessary to couple with the logsum transfer. This modeling and data collection effort is however left for future work. The same practice should be carried out accordingly when applying the estimated model in simulation.
In estimation, the action of clicking on the Tripod tab in a SP is recorded and considered as a service access action. To clearly identify the click action on Tripod tab, the surveys where the default tab (the tab shown when respondent opened the page, randomly assigned in survey generation) is Tripod had to be excluded. In addition, we noticed that in 30% of the surveys the respondents viewed only 1 tab. To nudge the respondents to make the choice of which tab to click, we recommend
that future studies which attempts to elicit this action do not provide a default tab so that the respondent has to make a choice of which tab to click before selecting the final option. The estimation result is shown in Table 2.4.
Parameter Population Mean Std. Err. Population SD Std. Err.
ASCnac 0 0.00713 0.0141 ASCac -1 1.12 0 OTER -1.82 1.1 2.93 1.38 /Inac 0.578 0.229 Orac 0.201 0.201 Sample size 369 Null log-likelihood -255.771 Final log-likelihood -219.805
Table 2.4: Parameter estimates of the service access model
Menu product choice model
Equation 2.9 shows the utility specification for an option in the menu while Equa-tion 2.10 shows it for the opt-out opEqua-tion. The travel time is divided into in-vehicle travel time, out-of-vehicle travel time and non-motorized travel time. To capture re-spondents' perceptions of the value of the tokens, we include the tokens as monetary value ($) converted by the token exchange rate that had been randomly assigned to the respondents upon their registration of the survey (the rate is implicitly indicated to them by the price of goods in the marketplace, see Figure 2-5). The variables are explained in Table 2.5. The distribution of the parameters of travel time and cost are segmented by full-time workers and other populations (different means and standard deviations).
Umenu option = -eIIV tIvTT - eOovTtov TT- e ONMMtNMM - e p+
/inertiaDRP + E /mD, + e1r - e Odelaylog(tdelay + 1) + (2.9)
m M
Variable Type/Unit Description Inter-individual distribution of corresponding parameter
Umenu option utility for a menu option N/A
UOt utility for opting out N/A
IRC logsum from the regular choice fixed
tIVTT minute in-vehicle travel time log-normal distribution tOVTT minute out-of-vehicle travel time log-normal distribution tNMM minute non-motorized travel time log-normal distribution p US dollar cost log-normal distribution r US dollar reward log-normal distribution
tdelay minute schedule delay log-normal distribution
DRP binary dummy for whether the normal distribution
mode of SP option is the same as the RP mode
Di, m E M3 binary mode dummies. normal distribution
Table 2.5: Variables in the menu product choice model
In model estimation, Due to the sample size, the standard deviations of the travel time coefficients' logarithms are fixed to be the same across population segments. The estimation results are shown in Table 2.6.
3
M includes walk, bike, bikeshare, car and carpool, Uber and Uberpool, taxi, and public transit accessed by walk, bike and car
Parameter Population Mean Std. Err. Population SD Std. Err.
3p full-time worker -2.13 0.369 0.825 0.245
Op other -2.05 0.481 0.0917 0.514
#r
full-time worker -2.03 0.769 0.798 0.471#r other -1.94 0.900 0.354 0.359
I3IVTT full-time worker -2.96 0.469 0.578 0.238
/IvTT other -3.46 0.734 0.578 0.238
IOVTT full-time worker -3.05 0.475 0.337 0.333
/OVTT other -2.52 0.43 0.337 0.333 /NMM full-time worker -2.42 0.158 0.00734 0.236 ONMM other -2.40 0.234 0.00734 0.236 #delay -1.99 1.09 1.31 1.67 /3 nertia 1.14 0.25 0.403 2.51 #bike 5.63 1.29 2.35 0.821 OPT 4.66 1.21 0 #car 4.86 1.15 1.45 0.620 Obikeshare 4.37 1.24 2.62 0.624 Otaxi 5.25 1.27 1.17 1.15 Ouber 6.22 1.21 0.946 1.14 3 walk 6.95 1.31 0.147 0.669 ASCut 0 2.29 0.523 0Iout 0.905 0.355 Sample size 455 Null log-likelihood -796.831 Final log-likelihood -601.226
Regular choice model
As shown in Equation 2.11 and Table 2.7 the utility specification of a regular alter-native is similar to a menu option, only without token and the possibility of schedule delay.
Ureguiar option = - eOvITTtIvTT - eI3oVTTtOVTT - eNMMtNMM - e p+ /inertiaDRP +
E
mDm+
CmEM
(2.11)
Variable Type/Unit Description Inter-individual distribution
of corresponding parameter
Ureguiar option utility for a regular option N/A
tIVTT minute in-vehicle travel time log-normal distribution
tOVTT minute out-of-vehicle travel time log-normal distribution tNMM minute non-motorized travel time log-normal distribution
p US dollar cost log-normal distribution
DRP binary dummy for whether the normal distribution
mode of SP option is the same as the RP mode
Dm, m E M4 binary mode dummies. normal distribution
Table 2.7: Variables in the regular choice model The estimation results are shown in Table 2.8.
4