Choosing Transportation Alternatives for Highly Perishable Goods: A Case Study on Nuclear Medicine
by
Xiaowen Yang BA Economics (1993)
University of International Business and Economics, Beijing (China) Master of Business Administration (2003)
Wake Forest University
Submitted to the Engineering Systems Division in Partial Fulfillment of the Requirements for the Degree of
Master of Engineering in Logistics Massachusetts Institute of Technology
lay 2006 © 2006 Xiaowen Yang.
All rights reserved.
The author hereby grants M.I.T. permission to reproduce and to distribute publicly paper and ARCHIN electronic copies of this thesis document in whole or in part.
Signature of Author ...
Center for Transportation and Logistics Engineering Systems Division
07 y 3006
C ertified by ... .../
Dr. Chris Caplice Executive Director, Master of Engineeifng in Logistics Program Thesis SupervisorA//
A ccepted by ...
/ /(/
V'
Yossi SheffiProfessorf Civ& Environmental Engineering Professor of Engineering Systems Director, Center for Transportation and Logistics
MASSACHUSETTS INSTIfTEj OF TECHNOLOGY
JUN 26 2006
Choosing Transportation Alternatives for Highly Perishable Goods: A Case Study of Nuclear Medicines
By Xiaowen Yang
Abstract
The transport of highly perishable goods, in particular nuclear medicine, is subject to stringent regulations. Carefully designed transport selection criteria considering available alternatives, product attributes, decay analysis, and shipping constraints may reduce the total costs. This thesis recommends a new approach to making alternative selections, leading to total cost reductions.
This project was conducted with three goals in mind in partnership with a Fortune 500 healthcare company. First, it serves to develop a deeper understanding of the transport of nuclear medicine. Second, it serves to analyze whether current decision making processes
can be adjusted to lower the total cost. Third, it serves to improve transportation decisions about nuclear medicine.
The results demonstrate that the current operation of the partner company can be improved by ceasing to over-estimate and over-compensate decay costs by using more high-rate alternatives than needed. By minimizing total costs, the company can reduce its transportation costs by 5-10%. Note also that minimizing transportation costs alone can achieve total cost reductions, similar to minimizing total costs, although both scenarios recommend different alternative selection mixes. The embedded reason is that decay costs and transportation costs cancel out each other.
Thesis Supervisor: Dr. Chris Caplice
Executive Director, Master of Engineering in Logistics Program Massachusetts Institute of Technology
Acknowledgements
I would like to thank my advisor Chris Caplice for his guidance and the invaluable insights into the project. Without his challenges and provocations, the end result would not have been achieved.
I would also like to thank many employees from my partner company who took the time to share their ideas and insights. Specifically I would like to thank Richard Potts, Chris Ringwald, Mike Engdale, Tom McCormack, and Mike Witty for answering all of my questions and providing valuable feedback, and Peter Sturtevant and Charles Gianci for providing senior management support to this project.
I would also like to thank my friends and classmates for their encouragement. Special thanks to Bill Hass and Marilyn Levine for helping me to structure my thinking and improve my writing. Chandler See, Tan Peng Kung and Louis Bourassa, thank you for your valuable inputs as well.
Finally and most importantly, I would like to thank my family for their patience and support; everything I accomplish reflects their great faith in me.
Table of Contents
1 Introduction ...7
2 Literature Review ... 9
3 Current Operations ... 13
3.1 Product Categories ... 14
3.2 Profiling of Order Data...18
3.3 ABC Custom ers ... 21
3.3.1 Custom er Order Frequency ... 21
3.3.2 Custom er Categories ... 22
3.3.3 A Sample Customer Inventory Practice ... 23
3.4 M anufacturing Planning ... 24
3.5 Transportation Arrangem ent ... 26
3.5.1 Review of Four Alternatives ... 26
3.5.2 "Ship to City" Categorization ... 29
3.5.3 Current Transportation Selection ... 30
4 Analysis ... 32
4.1 M ethodology ... 32
4.2 Sample data selection ... 36
4.3 Base Case Analysis ... 37
4.3.1 Orlando ... 37
4.3.2 M emphis ... 39
4.4 Optim ized Selection Analysis ... 41
4.4.1 Orlando Optim ized Results ... 41
4.4.2 M emphis Optim ized Results ... 44
4.5 Sensitivity Analysis using Optimization Model ... 47
4.5.1 Delivery deadline ... 48
4.5.2 Acceptable Radioactivity Level ... 49
4.5.3 Transit Tim e Estim ation ... 50
5 Conclusions ... 52
5.1 Findings and Recommendations ... 52
5.2 Future Research ... 54
List of Tables
Table I Coefficient of Variance by Order Quantity on Weekday ... 19
Table 2 Coefficient of Variance by Weight of orders on Weekday ... 19
Table 3 Sample Order Placement Deadline ... 25
Table 4 An Example Cyclotron Daily Production Timeline ... 26
Table 5 Sample Mo-99 Generator Daily Production Timeline ... 26
Table 6 Cost Drivers and Constraints ... 27
Table 7 Alternative Mix for Generator and Non-Generator Products (Oct. 2004 to Jun. 2005) ... 31
Table 8 Transportation Alternative Rate Structure ... 33
Table 9 Transportation Alternative Transit Hour Estimation ... 33
Table 10 Order Characteristics for Orlando and Memphis (Oct. 2004 to Jun. 2005) ... 37
Table 11 Transport Alternative Selection May 2005, Orlando ... 38
Table 12 Transport Alternative Selection May 2005, Memphis ... 40
Table 13 Transportation Alternative Mix under Three Scenarios May 2005, Orlando.. 43
Table 14 Weight Carried by Different Alternatives Mix May 2005, Orlando ... 43
Table 15 Transportation Alternative Selection using Optimization Model May 2005, Memphis ... 45
List of Figures
Figure I Hourly Decay Rate Analysis ... 17
Figure 2 Decay Cost Analysis ... 17
Figure 3 Order Breakdowns by Type (Oct. 2004 to Jun. 2005) ... 19
Figure 4 Number of Orders by weight Range (Oct. 2004 to Jun. 2005) ... 20
Figure 5 Customer Order Frequency (Oct. 2004 to Jun. 2005) ... 22
Figure 6 Order Quantity Analysis by different customer group (Oct. 2004 to Jun. 2005)22 Figure 7 Diagram of transportation Alternatives ... 27
Figure 8 Cities breakdown by geographical location ... 29
Figure 9 Number of Orders Shipped via Different Alternatives (Oct. 2004 to Jun. 2005) ... o oooooo....o... 30
Figure 10 Order Breakdown by Type May 2005, Orlando ... 38
Figure 11 Order Breakdown by Type May 2005, Memphis ... 39
Figure 12 Transportation Cost under Baseline Scenario and Optimization Scenario ... 42
Figure 13 Transportation Costs Comparison under Three Scenarios ... 44
Figure 14 Transportation Cost Ratio May 2005, Memphis ... 45
Figure 15 Transportation Cost Comparison under Three Scenarios May 2005, Memphis ... 46
Figure 16 Cost Breakdown using two delivery deadline May 2005, Orlando ... 48
Figure 17 Cost Comparison for different radioactivity level ... 49
1 Introduction
Nuclear medicine is unique in two ways: it is hazardous, and it decays quickly. Because it is hazardous, there are strict requirements governing its production and transportation. And because nuclear medicine decays quickly-in some cases, the shelf life is only two days-timely delivery is critical.
While the transportation of nuclear medicine is complex, the scope of this study is limited to the impact of decay costs on the selection of transportation alternatives. The research, conducted in collaboration with the ABC Company and its factory site in St. Louis, examines the selection of alternatives involving cyclotron-produced nuclear medicine and reactor-produced nuclear medicine, to two selected cities with the company's customer base. How are transportation decisions for this medicine currently made?
It has been assumed that high-speed delivery and minimization of transportation costs are the best transportation criteria. However, this view fails to consider how radioactive decay' affects the manufacturer's cost. Should the Company base its decision about transportation alternatives on the total cost2, or should the company give special weight to one component of the total cost, transportation costs? This is the question we study here with respect to the unique property of nuclear medicine, its rapid rate of decay.
I Radioactive decay is the process in which an unstable (radioactive) nucleus emits radiation and changes to a more stable isotope or element. A number of different particles can be emitted by decay. The most typical are alpha or beta particles. A definition by the U.S. Environmental Protection Agency.
Thus, the purpose of this research is threefold. First, it serves to develop a deeper
understanding of the transport of nuclear medicine. Second, it serves to analyze whether
the current decision making processes can be adjusted to better reflect the total cost.
Third, it recommends alternative criteria for making transportation decisions about
nuclear medicine products.
The thesis is organized as follows: Chapter 2 reviews the previous research on relevant
topics. Chapter 3 gives a brief background of nuclear medicine and its common
transportation practices, and provides an introduction to the partner company, focusing
on product attributes, order placement, customer characteristics, and transportation
arrangement. Chapter 4 details the modeling approach and evaluates the results using an
optimization model. Finally, Chapter 5 presents our conclusions and recommendations.
2 Literature Review
The project focuses on transportation alternatives for perishable radioactive products, which decay at an hourly rate ranging roughly from 1% to 5%. In other words, the
expiration date after manufacturing ranges from 3 days to 2 months.
The choice of transportation mode requires evaluating transportation alternatives in light of existing constraints, while satisfying service requirements and minimizing costs. The
costs are two: the decay cost, because the material is perishable, and the transportation
cost. Our project studies the relationship between these two costs and focuses upon the
impact of the decay rate, distance, delivery time, transport index limit of a radioactive
material3, production scheduling, and production capacities. The relationships are
complex because they involve trade-offs in desired outcomes, and therefore need to be
prioritized.
We first consider how the literature categorizes perishable products in an effort to find
products that have similarities in perishability to radioactive products. Then, we consider
the literature with a view towards finding applicable criteria for selecting transportation alternatives for these other products that may work with radioactive products. Finally, we
turn to directly consider transportation mode choices.
3 Transport Index (TI) of a radioactive material. It is defined by the U.S. Nuclear Regulatory
Commission as a single number assigned to a package containing radioactive material, and as the maximum dose rate at m from the external surface of the package.
How are perishable products categorized? Nahmias (1982) classifies perishable products
into two categories: fixed lifetime and random lifetime products. Products that have a
fixed lifetime will decay at a fixed rate. The radioactive products we are researching have
a fixed decay rate, therefore we do not consider random lifetime product assumptions.
Federgruen, Prastacos and Zipkin (1986) present an allocation model for common
perishable products such as blood, food and drugs, distributed from one distribution center to many locations. Unlike many models that focus on shortage cost and obsolete cost, their model takes the transportation cost into consideration and is thus relevant to
our work. In their model, they assume that shortages will be resolved by emergency
delivery. We will replace low-rate transport modes with high-rate modes to meet
customer required time constraints. This mode shift achieves the same result as does
emergency delivery and has a similar effect on total cost.
Newspapers are another example of perishable products. Hunter and Van Buer (1996)
summarize these features of production and distribution of newspaper: limited production
and distribution time allowed no existing inventory and highly connected production and
distribution system. To solve the newspaper delivery problem, Hunter and Van Buer
divide locations into product zones, use vehicle routing method to find the routes that
satisfy the delivery time and transportation capacity requirement, and then trace back to
the time when newspaper production must to be finished. Our project will divide
customers into two groups based on distance from manufacturing factory: customers
discusses relationships between required delivery time, production capacity and production scheduling.
Radioactive products are considered hazardous materials. Usually end-users have a strict requirement for a narrow arrival time-window. Chang, Nozick, and Turnquist (2005) discuss the mean and variances of uncertain attributes along the paths that arrive at a given node within a specific time window. The authors also summarize three central characteristics of hazmat shipment. These characteristics can also be applied to our routing and distribution of radioactive products. They are multiple criteria held by different stakeholders, time-of-day in mode route evaluation, and uncertain values of attributes in the routing decisions.
Cullinane and Toy (2000) apply content analysis methodology to freight mode choice. Content analysis is a set of research tools to determine key themes of written
communications. Using content analysis method, the authors conclude that five factor categories used most frequently in mode selection are: freight rate, speed, transit time reliability, characteristics of the goods and service level. Three out of five factors are used in our analysis.
Liberatore and Miller (1995) introduce the Analytic Hierarchy Process (AHP)
methodology in carrier and mode selection. AHP system incorporates both quantitative factors and qualitative factors, which is the methodology we will use in our sensitivity analysis. The common quantitative factors are freight cost and inventory carrying cost.
The common qualitative factors are perceived quality of customer service, cargo capacity
limitation and shipment tracking and tracing capabilities.
This chapter reviews the previous work on the perishable goods and its transport
alternative selection. However, no solution can be applied directly to the question we
study because the problem requires many tradeoffs. In chapter 3, we will review current
operations of the ABC Company. We will compare baseline results with optimized
3 Current Operations
The ABC Company is the industry leader in manufacturing and distribution of medical devices, surgical products, imaging goods, pharmaceuticals and retail products. Nuclear medicine is one of its main product lines. Because of the decay property of nuclear medicine, the ABC plant manufactures and ships medicine on a daily basis to its
customers. The transportation budget for the ABC Company is approximately $300 million; nuclear medicine accounts for approximately 7% of this budget. Therefore, any transportation cost reduction will affect bottom-line profits of the ABC Company. Furthermore, understanding how decay costs affect transportation decisions will allow the company to better control its supply chain of nuclear medicine.
This thesis was completed in a partnership with a healthcare company. The name of the company will be omitted from associated thesis documents and selected numerical figures will be disguised. Throughout the thesis document, the company will be referred as the ABC Company. The company's factory will be referred as the ABC factory, and the ABC's self-owned pharmacies will be referred to self-owned pharmacies.
In this chapter, we will introduce nuclear medicine categories, order characteristics, customers, manufacturing planning, and most importantly, current transportation
alternative selection process, of the ABC Company. We will analyze whether the current transportation alternative selection is optimal or not in Chapter 4.
3.1 Product Categories
To understand the transportation of nuclear medicine, we need to know what nuclear
medicine is and how its unique properties, short shelf-life and radioactivity4, affect
transportation decisions. We will also discuss the nuclear medicine carried by the ABC
Company.
Nuclear medicine is a substance that is attracted to specific organs, bones or tissues. It is introduced into the patient's body by injection, swallowing or inhalation. As the nuclear medicine travels through the body, it produces radioactive emissions. The gamma camera
detects this emission and then records the information. Unlike X-rays and CT tests, the
procedure of nuclear medicine can document function as well as structure, thereby
allowing doctors to detect diseases earlier. Nuclear medicine can be classified into bulk-level medicine and unit-dose bulk-level medicine. Bulk-bulk-level medicine is produced at factory
sites and delivered to nuclear pharmacies, which prepare patient-specific unit-dose
medicine for hospital administration. The transportation problem we study here is limited
to bulk level medicine transportation from the factory site to pharmacies only.
Nuclear medicine decays at a regular rate. As soon as medicine is manufactured, its radioactive decay begins. The radioactive decay is closely related to production costs. To guarantee that pharmacies receive medicine with a certain radioactivity levels, a tradeoff
4 Radioactivity is spontaneous transformation of the nucleus of an atom; this resulting in a new element, generally with the emission of alpha or beta particles often accompanied by gamma rays. A definition by the U.S. Environmental Protection Agency.
between transportation costs and decay costs has to be made. Manufacturers can either produce medicine with higher radioactivity levels or use quicker delivery alternatives.
How does radioactive decay affect the expiration date of medicine? For example, some medicine decays at 5% per hour. If the medicine can't be used by hospitals within three days, it becomes useless. Some nuclear medicine decays at a much lower rate and allows an expiration date for as long as two months.
Nuclear medicine is radioactive, thus its transportation is subject to strict regulations by the US Department of Transportation, the US Environmental Protection Agency, the Occupational Safety and Health Administration and various state agencies. All carriers involved in the transportation process are trained in the safe handling of these materials from radiological and ergonomic standpoints. Four alternatives used in the transport of nuclear medicine are charter airlines, commercial airlines, ground couriers and FedEx Express. Out of four available alternatives, commercial airline carriers set a very strict limit on the transport index of a radioactive material to stipulate the maximum
radioactivity each flight can carry.
The ABC Company carries a broad line of nuclear medicine, which can be divided into two groups: reactor-produced nuclear medicine and cyclotron-produced nuclear medicine. Cyclotron-produced medicine uses high voltages and electrical fields to accelerate
hydrogen atoms through a vacuum chamber. When these hydrogen atoms collide with a target substance, they produce radioisotopes. Compared with nuclear reactions performed in a reactor, cyclotron reactions have less predictable radioactive materials output. We
will review characteristics of these two product categories and discuss how these characteristics affect the transportation decision.
The most commonly used reactor-produced nuclear medicine is the Molybdenum-99 generator, or radionuclide generators, which is widely used in the diagnosis of brain,
heart, lung, kidney and liver diseases. The weight of generators is much higher compared to that of other medicine of their sizes. For example, one 1.0 Ci generator weighs 48 lbs and one 19 Ci generator weighs 68 lbs. Due to the high density, transportation
alternatives that favor high density products should be considered, i.e. charter airline service and ground courier service. The hourly decay rate for the Molybdenum-99m generator is 1%, giving the medicine a longer expiration date than other nuclear products.
Some widely used cyclotron-produced medicines are Gallium-67, Thallium-201 and lodine-123. Gallium-67 is used mainly in the detection of soft tissue tumors and
infections. Thallium-201 is used in detecting heart disease. Iodine-123 is used in imaging the thyroid gland and diagnosing stroke, heart disease and some cancer. These medicines are kept in lead-safes during the transit. The gross weight per unit varies a little from 1.5 lbs to 2.65 lbs. Although these items are all produced using cyclotron reactions, they have quite different hourly decay rates. Iodine-123 decays at 5% per hour, while Gallium-67 and Thallium-201 decay at approximately 1% per hour.
5 A radionuclide generator is a device which permits ready separation of a daughter radionuclide from its parent. In generator systems of practical importance the parent has a relatively long half-life compared with the daughter, and the device (often referred as a "cow") permits repeated elutions ("milkings") at suitable intervals. Generators make possible the routine use of certain short-lived radionuclides at locations remote from centres of radionuclide production. A Definition by the International Atomic Energy Agency.
Compared with cyclotron-produced medicine, reactor-produced medicine has more
predictable output and a longer expiration time, reactor-produced medicine tends to be
produced to stock, it is stored either in the factory or in pharmacies. Some
cyclotron-produced medicine that decays at a high rate tends to be cyclotron-produced to stock; other
medicine tends to be produced to order.
How will decay rate affects the product radioactivity and decay cost? Suppose that
radioactivity is 100% at time of production. If the hourly decay rate is 1%, then 48 hours
later, radioactivity remaining will be 62%. But with a 5% decay rate it will be just 9%
(see Figure 1). The radioactivity levels are closely related to product standard costs (see Figure 2). If the product standard cost is $28, the decay costs will vary greatly depending
on the hourly decay rate.
Decay Rate Indicator
100% -6 0%-'40% ...- 40% ~~T '' ...'~~.' -.. ' .. Decay Rae; 5% per hour 20% '-0 3 6 9 12 15 1821 24 27 30 33 36 39 42 45 48
Transit Time (in hours)
Figure 1 Hourly Decay Rate Analysis Decay Cost Indicator
30.00 -- - .-... ..-...--- .. .---Deca-y-Rate t 5% per hour
20.00 ,
.-15.0 - .-' : .... 9:i'~' , ,
- ' .-: . ,,15.00 ' . , . '.:. . 'Decay - KaLt 1% per hour
10.00 _ .,e_
-,
.~- . . . .;
5.00 .; . ~ .; - . - ' 1 4 7 10 13 16 19 22 25 28 31 34 37 40 43 46 49
Transit Time (in hours)
To guarantee that pharmacies will receive the medicine with an acceptable level of radioactivity, manufacturers can either produce medicine with higher radioactivity or shorten the transit time. Disregarding both of these alternatives makes shipping nuclear medicine similar to shipping ice without putting it into a cooler. For nuclear medicine, shorter transit time can be achieved by switching to transport alternatives with a higher rate. In other words, it is necessary to make a tradeoff between transportation costs and decay costs.
In this paper, we treat nuclear pharmacies as customers. All pharmacies allocate their orders to both the ABC Company and its three main competitors to maintain a second source of supply.
3.2 Profiling of Order Data
All orders are divided into standing orders or demand orders. Standing orders are orders placed by pharmacies weeks or months in advance. Demand orders are placed by
pharmacies with short notice, usually for next day delivery. Figure 3 illustrates that 45% of all orders within the nine month time period are standing orders, while by weight, 73% are standing orders. Clearly, regular standing orders are heavier than regular demand orders.
Order Breakdown
Figure 3 Order Breakdowns by Type (Oct. 2004 to Jun. 2005)
Table 1 and 2 illustrate that the coefficient of variance for order quantity and weight on the day of week. By quantity and weight, both standing orders and demand orders have high variability. However, standing orders are placed far in advance, thus their
manufacturing and transportation can be planned ahead. Demand orders, on the contrary, were received with short notice and required quick response in both production and transport arrangement.
Order Type Demand Order Standing Order
Day of Avg. Std order CV Order Avg. Std order CV Order
Week Order # # Qty Order # # Qty
Total 435 160 37% 392 151 39% Sunday 404 110 27% 432 151 35% Monday 494 138 28% 429 142 33% Tuesday 528 133 25% 411 146 35% Wednesday 514 126 25% 403 142 35% Thursday 455 166 36% 382 152 40% Friday 435 160 37% 392 150 38%
Table 1 Coefficient of Variance by Order Quantity on Weekday
Order Type Demand Order Standing Order
Day of Avg. Wgt. Std Wgt. CV Order Avg. Std Wgt. CV Wgt. Week (lb) (lb) Qty Wgt. (lb) (lb) (lb) Total 4,188 2,314 55% 7,750 6,208 80% Sunday 3,642 3,225 89% 6,356 5,758 91% Monday 4,498 2,992 67% 7,545 6,248 83% Tuesday 4,637 2,758 59% 7,059 6,055 86% Wednesday 4,558 2,551 56% 7,468 5,893 79% Thursday 4,104 2,483 61% 6,964 5,854 84% Friday 4,187 2,314 55% 7,749 6,208 80% Table 2 Coefficient of Variance by Weight of orders on Weekday
100% 80% 60% 40% 20% 0% I Standing e 1 Demand
No.of Orders Weight
Note also that number of orders and weight of orders on Monday through Wednesday are relatively high compared to those on other weekdays. This finding is consistent to the fact that most nuclear medicine tests and procedures are scheduled in advance. As nuclear medicine procedures generally are not performed on weekends (Saturday and Sundays), orders on Thursdays tends to be small in quantity and low in volume.
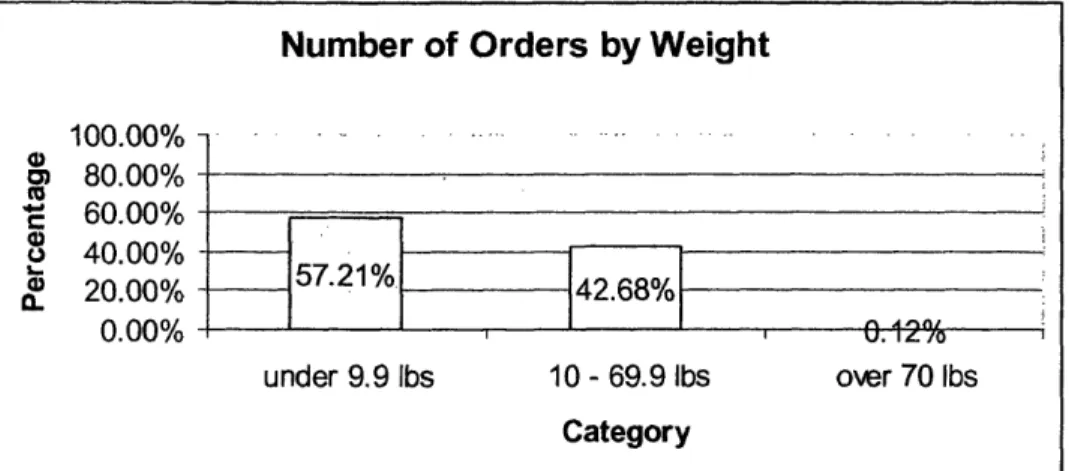
It is the current practice of manufacturers of nuclear medicine to produce and transport medicine on a daily basis. As a result, shipment volumes for most orders are small. Figure 3 shows that weight for 99.88% orders is less than 70lbs and more than half of all orders are less than 10 lbs.
Figure 4 Number of Orders by weight Range (Oct. 2004 to Jun. 2005)
Further study shows that 10% of all orders are radionuclide generators, which must be shipped individually due to its high radioactivity levels. The weight of orders for
generator ranges from 50 lbs to 70 lbs. Other non-generator medicine weighs from I lb to 20 lbs at a unit level.
Number of Orders by Weight
-_o -1n IUU.UU"/o 0 g 80.00% · 60.00% 0 40.00% I 20.00% 0.00% under 9.9 lbs 10 - 69.9 lbs over 70 lbs Category
An interview with a nuclear pharmacy manager reveals that the pharmacy receives the medicine four times a week, a practice that explains some of patterns exhibited in Table I and 2.
To sum up, the orders are low in weight, different types of orders (i.e. standing orders and demand orders) exhibit different order patterns and variability, and inventory on
medicines with long expiration dates are selectively kept at pharmacy sites. These findings will be addressed in our transportation alternative selection process.
3.3 ABC Customers
In this section, we will examine order frequency, order pattern and inventory practice of customers. We will recommend how to achieve cost reductions based on these features in an effective way in later chapters.
3.3.1 Customer Order Frequency
The shipment data shows that the ABC Company shipped nuclear medicine to just under 800 distinct "ship to names" in nine months. A "ship to name" is considered a destination. Out of the total group, 12% received only one order.
Customer Order Frequency o~ 80% I-
_
80%
17 5 al 60% c l 40%0
°
20%
0 2- 0% 0. a. 0) LI high medium FrequencyFigure 5 Customer Order Frequency (Oct. 2004 to Jun. 2005)
We classified each destination to be high, medium or low user group based on frequency of delivery. High frequency group placed more than 5 orders per week within the nine
month time period, medium frequency group placed 1 to 5 orders per week, and low
frequency group placed less than 1 order per week. Two locations from high frequency
group are selected as our analysis basis.
3.3.2 Customer Categories
The ABC Company delivers to its self-owned pharmacies and other pharmacies. Two
categories have different order patterns.
Pharmacy Type Analysis
800001:
1 ..
?'',... ....
:...7... "i....2"
--- .....7
z Self-owned Pharmacies Other Pharmacies
Categories
Figure 6 Order Quantity Analysis by different customer group (Oct. 2004 to Jun. 2005) low 6 60000 -' 40000
.,
20000 ---TS 0 O -order , S-order I ..535The above figure shows that ABC self-owned pharmacies and other pharmacies exhibit quite different order patterns. Out of total 182,770 orders shipped out by the ABC Company, demand order to standing order ratio is 1.2 to 1. The ABC self-owned pharmacies placed 63,313 orders, with demand order to standing order ratio is
approximately 2 to 1. Other pharmacies ordered 119,457 orders, with demand order to standing order ratio is approximately 0.9 to 1.
The above indicates that ABC self-owned pharmacies order a higher percentage of demand order than regular pharmacies.
3.3.3 A Sample Customer Inventory Practice
Usually nuclear medicine procedures are scheduled in advance. This practice gives pharmacies time to prepare for patient-specific unit-dose medicine. The inventory
practice adopted by pharmacies affect their order patterns, therefore should be considered in transportation alternative selection.
When nuclear medicine is received by pharmacies, it is first assayed to determine its remained radioactivity level. The expiration date, post calibration, varies from 24 hours to 2 months. For items with a long expiration date, pharmacies will keep a certain level of inventory. For items with a rather short expiration date post calibration, for I-123 expires 24 hours after calibration, pharmacies order with ABC factory at the time of need.
One self-owned pharmacy that serves approximately 30 hospitals or clinics, keeps
different inventory levels on some nuclear medicine products. For generators that decay
at 1% and are used widely in the hospital administration, the pharmacy receives them 3-4
times a week and keeps a regular inventory for two weeks, for Iodine-123 that decays at
5%, the pharmacy keeps no inventory, and for all other items, the pharmacies keeps one
week inventory.
3.4 Manufacturing
Planning
The factory has one dedicated planner for cyclotron-produced items and one dedicated
planner for reactor-produced medicine. They use Excel as a major tool and base their
plans on orders on both historical data and marketing forecasting data.
As planners know standing orders in advance, they need to include demand orders that
are placed with factory on the same day of shipment to proceed with planning process.
All demand orders are input in the system on the same day they are received. The ABC
Company commits to ship the orders out the same day if the orders are placed with the
factory before required deadline, otherwise they will be shipped on the following day.
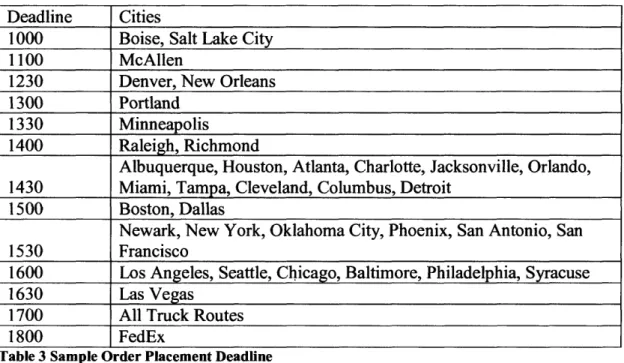
Considering different shipment schedule and available alternatives, the ABC Company
sets a detailed order placement deadline. The follow is a sample deadline used by the
Deadline Cities
1000 Boise, Salt Lake City 1100 McAllen
1230 Denver, New Orleans
1300 Portland 1330 Minneapolis
1400 Raleigh, Richmond
Albuquerque, Houston, Atlanta, Charlotte, Jacksonville, Orlando, 1430 Miami, Tampa, Cleveland, Columbus, Detroit
1500 Boston, Dallas
Newark, New York, Oklahoma City, Phoenix, San Antonio, San 1530 Francisco
1600 Los Angeles, Seattle, Chicago, Baltimore, Philadelphia, Syracuse 1630 Las Vegas
1700 All Truck Routes
1800 FedEx
Table 3 Sample Order Placement Deadline
As radioisotopes that are generated by reactor-produced reaction vary from day to day,
the planner needs to know how much radioactivity is available on that specific day. The
planner converts the radioactivity information into an actual production plan. The planner
will recommend the product mix based on orders on hand and his or her experience. If
there are serious radioactive material shortage, ABC plant will purchase raw materials
from outside vendors, who usually require 3-4 days lead time for delivery of materials.
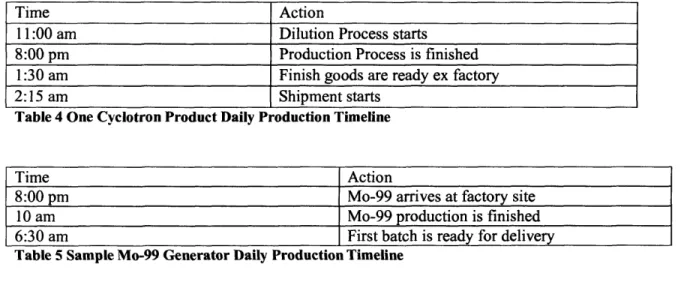
Table 4 and 5 is a sample production timeline for Cyclotron-produced medicine and Reactor-produced medicine. On a regular day, it takes 17 hours for Cyclotron-produced medicine from beginning of production to ready for shipment out of factory. Reactor-produced medicine is shipped out of factory once it is finished. The time taken from
Time Action
1 1:00 am Dilution Process starts
8:00 pm Production Process is finished 1:30 am Finish goods are ready ex factory
2:15 am Shipment starts
Table 4 One Cyclotron Product Daily Production Timeline
Time Action
8:00 pm Mo-99 arrives at factory site
10 am Mo-99 production is finished
6:30 am First batch is ready for delivery
Table 5 Sample Mo-99 Generator Daily Production Timeline
Because the output generated by reactor is predictable and reactor-based products have
long expiration dates, the dedicated planner makes a weekly plan. On average, 240
generators are produced, with 2-4 extra generators left in the inventory.
3.5 Transportation Arrangement
Currently the ABC Company ships nuclear medicine via four alternatives: charter airline,
commercial airline, ground courier and FedEx express. Characteristics, rate structure and
transit time of these four alternatives are illustrated. Current selections are stated as well.
3.5.1 Review of Four Alternatives
Each alternative has its own cost drivers and required transit time, determining the
alternative selection. Figure 10 illustrates a stylized version of the transit time and rate
High r Mediur Lov Charter Commercial FedEx
-_
Ground Courier I~~~' hShort Medium Long
Transit time
Figure 7 Diagram of transportation Alternatives
The following table outlines the structural difference between the alternatives. Different alternatives have different cost drivers. Some alternatives i.e. FedEx are changed on the weight basis; some alternatives have shipment related costs.
Destination
Fixed Fixed Origin Pickup and Volume Fixed Cost per Cost per Delivery Delivery Capacity TI Cost Drivers Cost shipment Lb Cost Cost Constraints Limit
Charter Airline Yes No No Yes Yes Yes No Commercial Airline No Yes Yes Yes Yes Yes Yes FedEx Express No Yes Yes No No No No Ground Courier No Yes Yes No Yes No No
Table 6 Cost Drivers and Constraints
Charter airline service can provide late pickups, early arrival, around the clock service. In addition, charter airline can transport larger-than-normal quantities of nuclear medicine. However, once Charter is used, there is a large fixed cost related to the charter usage because the service provider bases its rate on each flight. Using Charter airline shipment, origin and destination airport pickup and delivery service are needed.
Two commercial airlines carry nuclear medicine for the ABC Company. Both have strict requirements on transportation index limit of radioactive material, thus restricting the volume that can be shipped via this method. Like the charter airline alternative, commercial airline delivery uses ground courier on both origin airport pickup and
destination airport pickup and delivery. The rate of commercial airline is based on weight and fixed cost per shipment.
FedEx picks up the goods at 18:00 Monday through Friday and delivers medicine to customers at 0 am next day. Usually pharmacies expect to receive the goods at 2 am to prepare the unit-dose medicine for hospital administration. If the goods arrive at
pharmacies at 10 am, pharmacies will bear the radioactivity loss for one day.
Ground courier service is widely used for shipments to destination cities located within a radius of 500 miles from factory site on weekday. Ground courier service is also widely used on local airport pickup and delivery service. On weekend, ground courier service is used on long-haul service6 to destinations beyond a radius of 500 miles from factory. For ground courier service, factory uses one primary courier for one region to get the
medicine delivered. Ten regional carriers handle all courier shipments for the ABC Company.
6 Long-haul service is defined as the trucking service used in delivery to destinations far from 500
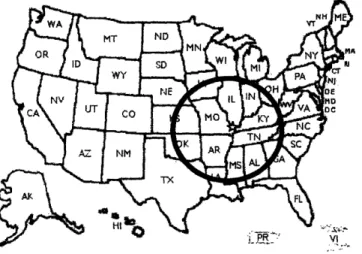
3.5.2 "Ship to" City Categorization
The ABC Company divides all "Ship to" cities into two groups by geographically
locations: cities located within a radius of 500 miles and cities beyond that. In Figure 11,
the star position indicates factory site. Cities located inside the circle are within a radius
of 500 miles. Cities located outside the circle are beyond a radius of 500 miles.
For customers inside the circle, ground courier service is the primary transportation
alternative. For customers located outside the circle, ground courier service is only used
on local airport pickup and delivery service on weekdays.
3.5.3 Current Transportation Selection
We will review how the ABC Company chooses shipment alternative on all the orders in
this section. The Selection made on the basis of order type (i.e. demand order vs. standing
order, etc.) and product type (i.e. generator vs. non-generators, etc.) is illustrated.
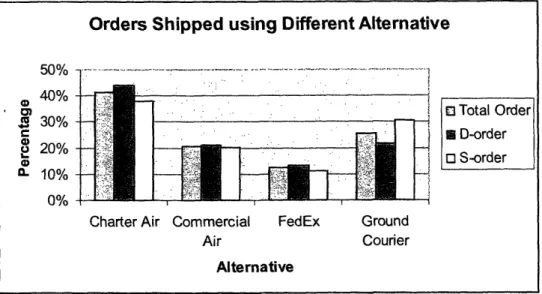
Of the total orders shipped from Oct. 2004 to June 2005, 45% were shipped by charter
airline, 21% by commercial airline, 12% by FedEx and 25% by ground courier. If the
orders are further broken down into standing order and demand orders, charter airline
service carries 44% demand orders and 38% standing orders. Ground couriers carry a
higher percentage of standing orders than demand orders.
Orders Shipped using Different Alternative
50o% 40%
230%
L 20% 0% a. 10% 0%Charter Air Commercial FedEx Ground
Air Courier
Alternative
Ei Total Order
M D-order
[o S-order
Figure 9 Number of Orders Shipped via Different Alternatives (Oct. 2004 to Jun. 2005)
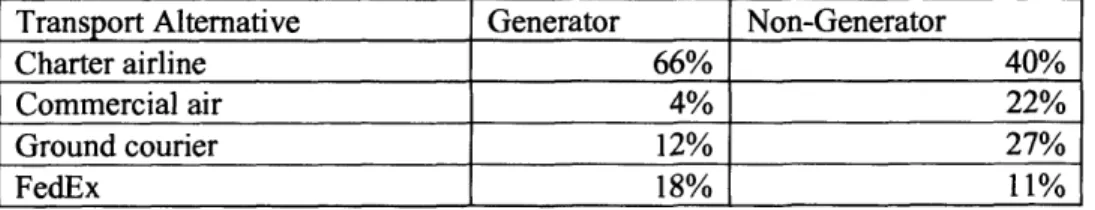
As we stated earlier, some products such as generators have a higher density than others.
Our study shows that 66% of the high density generators are shipped by charter airline,
18% by FedEx. As to lower density non-generator medicine, 39% are carried by charter
alternative for all goods, especially for high density goods. The embedded reasons for
using charter airline service to carry high density and high percentage of orders is that
charter airline is charged on per flight basis. The more capacity is utilized, the more
cost-efficient for each shipment.
Transport Alternative Generator Non-Generator
Charter airline 66% 40%
Commercial air 4% 22%
Ground courier 12% 27%
FedEx 18% 11%
Table 7 Alternative Mix for Generator and Non-Generator Products (Oct. 2004 to Jun. 2005)
Orders shipped to the same gateway city using commercial airlines are consolidated to
lower transport costs. There are approximately 40% of total orders shipped in
consolidation packages.
In this chapter, we reviewed nuclear medicine categories, order data profiling, customer
segmentation and current transportation alternative selections. Our objective is to
describe current operations of the ABC Company and discuss factors influencing their
decision making. We will analyze whether their operations are optimal or not in the next
4 Analysis
Our primary goal is to analyze how the decay costs affect the transportation mode
selection. To achieve this goal, we built an optimization model and used the model to
analyze shipment data for two "ship to city" destinations. We choose all shipments in the
month of May 2005 for our analysis.
4.1 Methodology
A mixed integer linear programming model was developed to optimize transportation
mode selection. Assumptions about rate structure and transit time are made based on our
interviews with the partner company. The shipment data containing stock keeping units
(hereafter abbreviated as SKU), quantities of SKUs, "ship-to-city" destinations, standard
costs, and decay costs are treated as given. The transport index of radioactive materials
for all orders is assumed to be on a radioactivity-scale of 5 or less to facilitate switches
between alternatives.
The following tables describe the assumptions about four different shipping alternatives.
Considering transportation alternatives, the charter rate is a function of distance, number
of stops, weight and local handling cost; the commercial airline rate is a function of
weight, local handling cost and hazmat fee; the rate for ground courier is based on the
weight, distance and local handling cost; and FedEx Express charges are based on the
Rate Structure Transportation Alternatives Commercial Ground
Charter Air Courier FedEx
Case Rate
Variable Cost - Rate per Lb sensitive 0.25-0.35 Schedule Variable Cost - Rate per ton per mile 0.10-0.15
Local handling cost (pickup &
Delivery) 100 85 50
Hazmat Fee 85 50
Table 8 Transportation Alternative Rate Structure
Considering transit time, the outbound deadline is based on an ex post facto timeframe; the total transit time for each alternative is a function of origin pickup and delivery time, destination pickup and delivery time, and transit time between factory site and destination cities. The destination cities are divided into two groups: one within a radius of 500 miles of factory site, and another beyond a radius of 500 miles. Cities within one group are assumed to have the same transit time. Charter flight and commercial airline flight hours are based on the regular commercial airline non-stop flight schedule; ground courier long haul transit hours are based on an hourly speed of 60 miles. The daily outbound deadline
is based on an ex post facto timeframe. Some information is altered or omitted to protect the company's confidentiality.
Transit Time Transportation Alternative
Commercial Ground
Charter Air Courier FedEx _
Daily Outbound deadline (military time) (1) 1600 1600 2300 1800 Origin pickup and delivery time (hrs) (2) 1-2 2-3 1-2
Destination Delivery time (hrs) (3) 1-2 1-2 1-2 <500 miles from St. Louis to Destination City
(hrs) (4) 2-3 2-4 5-7 _
>=500 miles from St. Louis to Destination City
(hrs) (5) 4-5 3-5 20-24
<500 miles Total Transit (hrs) (2)+(3)+(4 4-7 5-9 7-9 18
>=500 miles Total Transit (hrs) (2)+(3)+(5) 6-9 6-10 22-26 18 _
The notations that will be used in the optimization formulations are as follows:
Cost Notations
C' Cost of transportation using alternative i
C" Cost of decay for using alternative i
Transit Time Notations
Transit time using the alternative i T7 Transit time allowed using alternative i
Other Notations
TIi Transport index of radioactive materials for alternative i
TI. Transportation index of radioactive material allowed for alternative i C.
./ Standard cost of product j W Gross weight of product j
Quantity of product j
R. Hourly decay rate of product j
Decision Variables Notations
Xi =1 if shipment alternative i is used, = 0 otherwise
Model Objective Function n Min (C + Cj ) Xi i=l Subject to n I Tixi < o i=1 n
EX
i=
i=Ifor all i where i =1, 2, 3, 4
for all i where i 1, 2, 3, 4 and Xi is binary (0,1)
Objective function (1) minimizes the sum of transportation costs and decay costs for each shipment. Constraint (2) states that transit time of selected alternatives should be less than transit time allowed. Constraint (3) states that only one alternative can be selected for any shipment.
(1)
(2)
Other relationship included in the model are:
1. C = Z Transportation Cost is a function of selected alternative times its rate. As stated earlier that only one alternative can be chosen for one shipment. The Rate of charter airline service is a function of capacity and volume; the rate of commercial airline is a function of actual transportation index limit of radioactive materials, weight; the rate of ground courier is a function of volume; and the rate of FedEx Express is a function of rate schedule and hazmat fee.
2. Cd = CiQii Decay Cost is a function of selected alternative, product decay rate, quantity of stocking keeping units (SKUs).
4.2 Sample data selection
The purpose of optimization model is to minimize the sum of transportation costs and decay costs. Decay costs should be based on SKU level data because different SKUs have different hourly decay rates and different standard costs. The original database given by the ABC factory contains only order-level data. Therefore, basing the optimization analysis on the whole database is very difficult. We propose basing the analysis on "Ship to City" destinations with high order frequencies. If the "Ship to City" destinations are chosen from the high frequency group, it can be easily applied to other "ship to city" destinations.
According to the ABC Company's current practice, "ship to city" destinations are divided into two groups: cities within a radius of 500 miles and cities beyond a radius of 500
miles. For the first group, ground courier is the primary transport alternative. For the 2nd group, ground courier delivery is recommended for weekend delivery only. Thus, one city from each group was chosen. Furthermore, if two cities that employ all four alternatives are chosen, the tradeoffs between these alternatives are more meaningful. Based on the above considerations, Orlando and Memphis were analyzed. The following table outlines order characteristics of Orlando and Memphis.
Orlando Memphis
Distance from factory (miles) 1000 280
Order Frequency (high/medium/low) high high Demand/Standing order Qty. ratio 2.6/1 1.05/1 Demand/Standing order Wgt. ratio 1.08/1 0.50/1 Table 10 Order Characteristics for Orlando and Memphis (Oct. 2004 to Jun. 2005)
Order data for May 2005 were chosen randomly as analysis base. Even though some orders were shipped together, all orders are assumed to be shipped individually to allows the results be comparable.
4.3
Base Case Analysis
4.3.1 Orlando
In May 2005, out of 217 orders 104 were demand orders and 113 were standing orders. The following figure illustrates that demand orders tend to be lower density items while standing orders tend to be higher density items.
Orlando May 2005 Order Breakdown ... i 100% ...-... 80% Q) 0) . 60% 0. A n 1'E3 S-order| %I n r-,-,
0f
I I-0
E UV/o--' . : .. %?no/, -48%I0%
122%|~ 0% I I I I I - 7Number of Orders Weight
Categories
Figure 10 Order Breakdown by Type May 2005, Orlando
Table 1 1 shows that charter delivery is heavily utilized. Most orders on high density
goods were delivered either by charter airline or commercial airline. The current
transportation alternative decision results in total transportation cost of $27,000, with
charter airline service accounts for 77%, commercial airline 20%, ground courier 2.9%
and FedEx 0.1%.
Percentage of Percentage of Total Percentage of Total Transportation Alternative Total Orders () Weight ( ) Freight Cost (%)
Charter 71%0/ 59% 77%
Commercial Airline 18%/0 36% 20%
Ground Courier 10% 4% 2.9"/%
FedEx 1% 1% 0.1%
Total 100% 100% 100%
Table 11 Transport Alternative Selection May 2005, Orlando
The above illustrates the current alternative mix for Orlando. Heavy usage of charter airline use and light usage of FedEx usage are justified in the following ways: First,
charter airline service carries larger-than-normal quantities of nuclear medicine, are suitable for high density goods transport and have a fixed rate per flight, thus charter
airline service should be applied heavily; second, FedEx Express service is not used
I:
I Li l IU~
widely as it can't meet 2 am next day delivery. Considering the transit time, distance and alternative rate structure, we think the above alternative mix is reasonable.
Further analysis on the SKU-level data reveals that 18 out of 113 standing orders have expiration dates as short as 2 days, compared to 25 out of 104 demand orders. 18 standing orders are orders for generators and no demand orders are generators. The average weight for standing orders is 29.311 b; the average weight for demand order is 9.091b.
4.3.2 Memphis
In May 2005, out of 167 orders 65 were demand orders and 102 were standing orders. The following figure illustrates that demand orders tend to be low density items while standing orders tend to be high density items.
Figure 11 Order Breakdown by Type May 2005, Memphis
Table 9 illustrates that charter service is heavily utilized and carries lots of high density goods. The current transportation alternative decision results in a total transportation cost
May 2005 Memphis Order Breakdown
100% - 80% -0 o) M 60% C 40 % a. 20% -% ~0%~ I {
I~
t1 17% I ~~~~~~~~~~~~I
I.-
Number of Orders Weight Categories t i . 0 S-order [3 D-order I fi i
of $25,142, with charter airline accounting for 89%, commercial air 6%, ground courier
service 4%, and FedEx 1 %.
Percentage of Percentage of
Transportation Alternatives Total Orders (%) Total Weight (%) Percentage (%)
Charter 71% 88% 89%
Commercial Airline 7% 5% 6%
Ground Courier 17% 6% 4%
FedEx 5% 1% 1%
Total 100% 100% 100%
Table 12 Transport Alternative Selection May 2005, Memphis
Table 11 illustrates the current transport alternative mix for Memphis. If we compare the
alternative mixes between Orlando and Memphis, we find they have many similarities:
First, for both, approximately 70% of orders was shipped by charter service and a low
percentage of orders was shipped by FedEx Express service; second, charter airline
service carries majority of high density products. However, unlike Orlando, for Memphis
deliveries, ground courier service was used more often. This finding is different from the
factory's stated practice that ground courier service is the primary alternative for cities
located within a radius of 500 miles, i.e. Memphis. An interview with the factory reveals
that Memphis is heavily used as a gateway city. Around 50% of goods are shipped to
other destinations from Memphis. To transship nuclear medicine products from Memphis
to their final destinations on a timely basis, the factory utilizes heavily on charter airline
service.
Further analysis of the SKU-level data reveals that 17 out of 102 standing orders have
expiration dates as short as 2 days, compared to 31 out of 65 demand orders. There are 24 standing orders for generators, while no demand orders are placed for generators. The
average weight for standing orders is 26.83 lb; the average weight for demand order is 8.65 lb.
4.4 Optimized Selection Analysis
To find out if the current transportation alternative selection is the best one, an optimization model is employed. The results under the optimization model (hereafter called optimized results) are compared with those from a baseline scenario. The primary focus is to on minimizing total costs. For further insights, a scenario minimizing
transportation costs is also analyzed. This scenario is name as Optimized scenario when Decay Costs equal to 0.
In order to be consistent with current operations, additional constraints are set as follows: 1. All orders must be delivered by 2 am the following day.
2. All FedEx packages are picked up at 6 pm and delivered by 10:30 am the following day.
3. Friday shipments (or weekend shipments) can be delivered by 2 am Sunday. 4. There is a transportation index limit of 5 for all shipments.
5. All orders can be shipped out at ex factory time timeframe.
4.4.1 Optimized Results - Orlando
When we compare transportation costs of the baseline scenario and the optimization scenario, we find a cost ratio of 1, indicating that, the transportation costs under both
scenarios are the same. If the ratio were higher than 1, transportation costs under the
optimization model would have been higher than under that of baseline scenario.
Figure 15 illustrates that transportation costs using an optimization model and a baseline
model are consistent. Using the optimization model, all orders are expected to be
delivered by 2am the following day. Two orders, originally shipped via FedEx Express,
which can't meet 2 am the next day delivery deadline, were switched to charter service.
That explains the two outliers with a ratio of more than 4. The following table gives more
details about the outliers caused by switching the alternatives.
Figure 12 Transportation Cost under Baseline Scenario and Optimization Scenario
Table 12 shows that there were actually more transportation alternative changes than may
have been immediately apparent. Initially, comparing the result between total Optimized
Result and Optimization Result (Decay Cost = 0), it appears that there were only a total
of 20 changes; however, there were actually 53 orders, in other words 25% of total orders,
shipping using different alternatives, i.e. some orders, previously, shipped by charter
May 2005 Orlando Optimization/Baseline Cost Ratio
5.00 4.00 o0
C.
3.00 w 2.00 0 1.00 1.00- i1ll Ill11l lllllll lllll IIIl/tll IIII l 11 I II" '11111 Illllll IIIIII IIll |inm11111 1111111 1111111 11111 i11111nllll|111 IIIIIIIII IIIII 1 I11iiii ntllllln11 ll illlllllll
1 13 25 37 49 61 73 85 97 109 121 133 145 157 169 181 193 205 21i Order
airline are now shipped via commercial airline service, and some weekend shipments have been switched to ground courier service, etc.
Table 13 shows the changes from volume of freight perspective. Compared the weight distribution under Baseline Result, more weights, under Optimization Results, were shipped by charter airline and ground courier.
Alternatives/No. Optimized Result
orders Baseline Result when Decay Cost =0 Optimized Result
D- S- D- S- D-
S-order order Total order order Total order order Total
Charter 85 72 157 87 67 154 85 79 164 Commercial Airline 4 32 36 4 35 39 6 25 31 Ground Courier 13 9 22 13 11 24 13 9 22 FedEx 2 0 2 0 0 0 0 0 0 Total 104 113 217 104 113 217 104 113 217
Table 13 Transportation Alternative Mix under Three Scenarios May 2005, Orlando
Alternatives/ Optimized Result when
Weight (lbs) Baseline Result ecay Cost =0 Optimized Result
- DS-D- S- D-
S-order order Total order order Total order order Total Charter 719.7 1960.1 2679.8 729.7 1249.5 1979.2 752.7 1976 2728.7 Commercial Airline 87.5 1260.3 1347.8 122.5 1849.9 1972.4 99.5 1166.4 1265.9 Ground Courier 93 92.1 185.1 93 213.1 206.1 93 170.1 263.1 FedEx 45 0 45 0 0 0 0 0 0 Total 945.2 3312.5 4257.7 945.2 3312.5 4257.7 945.2 3312.5 4257.7 Table 14 Weight Carried by Different Alternatives Mix May 2005, Orlando
Transportation Cost Comparison 30000 25000 Z, 20000 X 15000 0 o 10000 5000 0 . .. .. .. - . .... .. .... , . ... . @ . . ... ... 6869.
-
26869.4
...4...
i
.
... ... ... .. en Opiie if DC- Op. ie Optimized if DC=O ScenarioFigure 13 Transportation Costs Comparison under Three Scenarios
In conclusion, by switching to alternatives that minimize the total costs, the ABC Company can reduce its transportation costs by 4%.
If the model is solely targeted at minimizing transportation costs, 12% of the orders will use different alternatives compared to the model that minimize total costs. The
transportation cost of $26,000 will be reduced to $25,500. However, the decay costs will go up. In the end, the total costs will increase by less than 1%. This finding demonstrates that minimizing total costs can achieve the lowest total costs.
4.4.2 Optimized Results - Memphis
Figure 17 illustrates that transportation costs under the baseline scenario and the optimization scenarios are inconsistent. Many outliers demonstrate that alternative mix changed significantly. 85% of total orders, recommended for shipment, via different
Optimized Baseline
alternatives. Several outliers with a cost ratio above 1, switched ground courier or FedEx service to charter airline to meet the required delivery deadline. Many outliers with a ratio of less than 1 replaced high-rate alternatives with more cost-efficient ones.
Figure 14 Transportation Cost Ratio May 2005, Memphis
Table 15 and 16 states that ground courier service should be used to transport more orders with heavier weights. As ground courier service is cost efficient and has no capacity constraints, this service is recommended to replace charter airline under certain circumstances. Because of the need for 2 am next day delivery service, no FedEx Express
service is used. As transit time for commercial airline service is similar to that of ground courier service, commercial airline service is not recommended in this case.
Optimized Result
Alternatives/No. when
orders Baseline Result Decay Cost =0 Optimized Result
D- S- D- S- D-
S-order S-order Total S-order S-order Total S-order S-order Total
Charter 39 80 120 6 1 7 5 4 9 Commercial Airline 0 12 12 0 0 0 0 0 0 Ground Courier 20 8 28 59 101 160 60 98 158 FedEx 6 2 8 0 0 0 0 0 0 Total 65 102 167 65 102 167 65 102 167
Table 15 Transportation Alternative Selection using Optimization Model May 2005, Memphis
May2005 Memphis Optimized Cost vs. Baseline Cost Ratio
1.40 -.... ... .... ... ..
.-
-l
1.20 ° 0.80 = 0.60 - -a 0.40 0.20 -mm_ __Em o 1 11 21 31 41 51 61 71 81 91 101111121131141151161 OrderOptimized Result
Alternatives/ when
Weight (lbs) Baseline Result Decay Cost =0 Optimized Result
D- S- D- S-D-
S-order S-order Total order order Total order order Total Charter 413.8 2478.4 2892.2 36.4 1 37.4 33.4 175 208.4 Commercial Airline 0 172.2 172.2 0 0 0 0 0 0 Ground Courier 134.5 79.6 214.1 525.9 2735.2 3265.1 528.9 2561.2 2090.1 FedEx 14 6 20 0 0 0 0 0 0 Total 562.3 2736.2 3298.5 562.3 2736.2 3298.5 562.3 2736.2 3298.5 Table 16 Weight distributions under three scenarios May 2005, Memphis
In conclusion, by minimizing total costs, the ABC Company can reduce its transportation costs by 76%. As stated earlier, Memphis is used as a gateway city for shipments to other states, i.e. Mississippi, Louisiana, etc. To coordinate the transshipment, charter airline service may continue to be an optimal choice. When, for example, 50% of orders are delivered to cities within the state of Tennessee, transportation costs can be reduced by
approximately 10%.
Transportation Cost Comparison
30,000.00 25,000.00 Z 20,000.00 us 15,000.00 0 o 10,000.00 5,000.00 25,053.50 Baseline Transportation Cost ... . 533g20 5;339;20 .... .. .. W~~~~~~~a,337'.82... 82 ...
- _
T
Optimized Scenario Optimized when DC=0If the model is solely aiming at minimizing transportation costs where decay cost is
treated to be zero, 4 orders will be shipped via different alternatives compared to the
scenario that minimizes total costs. The transportation cost is reduced from $5340 to
$5338. However, the latter scenario can achieve 1% total costs reduction. This finding
demonstrates that minimizing total costs can achieve the lowest total costs.
This optimized result illustrates that both total costs and transportation costs are less than
the costs associated with current operations. We also notice that scenario one
(minimizing transportation costs alone) and scenario two (minimizing total costs) suggest
that different alternative mixes achieve similar total costs, which demonstrates that
transportation costs and decay costs cancel out each other.
4.5 Sensitivity Analysis using Optimization
Model
So far, all model inputs are treated as constants. Several important inputs are: 2 am next
date delivery deadline, an appropriate expected radioactivity level, and a stable transit
time for each alternative. Nevertheless, this is unlikely to be the case in the real world,
where inputs may change day from day. For example, ground courier service from
factory site to Orlando doesn't always take exactly 24 hours for delivery of goods to
pharmacies. Depending on factors such as the truck schedules and traffic conditions,
transit time may change.
As stated in the beginning of this chapter that many inputs are merely estimates to the
model output to changes or estimation errors in three particular inputs, namely delivery deadline, acceptable radioactivity levels, and transit time. The sensitivity analysis will be
conducted on May 2005 shipments for Orlando.
4.5.1 Delivery deadline
Given that competitors of the ABC Company deliver nuclear medicine using FedEx Express and that some pharmacies accept orders received at 10 am the next day, it is
necessary to compare model outputs using two deadlines.
Delivery Deadline Effect
45000 ... 40000 35000 : 30000. . 25000 --o
20000-o
15000
-..
10000 -5000 O-_ i Transportation Costs a Decay Costs 0 Total Costs 2:00 AM 10:00 AM Delivery DeadlineFigure 16 Cost Breakdown using two delivery deadline May 2005, Orlando
When the delivery time is extended from next day 2 am to next day 10 am, supposed that all goods are delivered at 10 am, decay costs goes up by 72%, transportation costs
decrease by 63%, and total costs goes down from $38,200 to $30,600. This finding
further proves that transportation costs and decay costs cancel out each other. If the company wants to consider manufacturing and delivery as a continuous process,
minimizing transportation costs, then minimizing the costs alone will achieve the goal. This delivery time scenario can also be applied to other time-related analysis.
4.5.2 Expected Radioactivity Level
To minimize total costs, the ABC Company needs to work with its customers on their expected radioactivity level at delivery. As stated earlier, expected radioactivity levels can be achieved by producing medicine with a higher radioactivity level or transporting the medicine via the quickest alternative. Usually the tradeoffs are made by individuals. If the acceptable level can be built into the system, the tradeoff can be made by
computers.
If, for example, pharmacies receive medicine with 70% (Scenariol) or 75% (scenario 2) radioactivity levels, what will the cost difference be? Figure 18 shows that by increasing the radioactivity level by 5%, transportation costs increase by 23% when quicker
alternatives are selected. At the same time, the decay costs are reduced by 5% and total costs go up by 9%.
Figure 17 Cost Comparison for different radioactivity level
Acceptable Radioactivity Level Effect
45,000 ----... .. 40,000 . 35,000 r 30,000 -i Transportation Cost 25,000 m DecayCot o 20,000 _ a Costs 15,000 o Total Costs 10,000 -5,000 -1 2
This analysis shows that a carefully decided radioactivity level at delivery can be used as
a valuable tool for the ABC Company to control its total costs.
4.5.3 Transit Time Estimation
As the estimated transit time of the actual value is based on our best estimate, the actual
transit time may vary. For alternatives other than FedEx Express, if the actual transit time
is 1 hour shorter than the current estimate, the transportation cost will decrease by 63%.
On the contrary, if the transit time increases by I hour, transport costs will increase by 0.4% and decay costs increase by 5%.
Figure 18 Cost Comparison for Different Transit Time Estimation
The above analysis further proves that efficient delivery brings down the total costs. Even
if the transportation alternative cannot be changed, improving the efficiency of each
alternative will lower the total costs. Similarly, reducing the waiting time at factory site or at transit will achieve the same cost reduction effect.
In this chapter, we analyzed transportation costs and decays costs under baseline scenario
and optimization scenarios. Additional scenarios were presented to describe how
Transit Time Effect
50000 .-.50...-..-
-
40000
~
6/3ooIz17
o 10000 o .- , -- E,2Current Decrease by one Increase by one hour hour
Transit time
-sensitive the alternative selection and total costs are to model inputs. We will present our findings and recommend future research in the final chapter.
5 Conclusions
5.1 Findings and Recommendations
This thesis demonstrates that the current operation of the ABC Company can be
improved because the ABC Company over-estimates decay costs and over-compensates
decay costs by using more higher-cost alternatives than needed. By minimizing total
costs, the ABC Company can reduce its transportation costs by 5-10%. Note also that
minimizing transportation costs alone can achieve total cost reductions, similar to
minimizing total costs, although both scenarios recommend different alternative selection
mixes. The embedded reason is that decay costs and transportation costs cancel out each
other.
This decay analysis presented in this thesis is based on product standard cost because this
cost is predetermined by the company and is widely used in its accounting system. Other
possibilities were that, if the decay analysis was based on the cost of radioactive materials,
minimizing transportation costs would have optimized total costs because the decay costs
are considerably lower. Alternatively, if the decay analysis was based on price,
minimizing total costs becomes more effective because the decay costs are critical in an
alternative selection process.
This thesis also studies the customer order frequency, "ship to city" statistics and