Publisher’s version / Version de l'éditeur:
Journal of Structural Engineering, 114, 3, pp. 642-656, 1988-03
READ THESE TERMS AND CONDITIONS CAREFULLY BEFORE USING THIS WEBSITE. https://nrc-publications.canada.ca/eng/copyright
Vous avez des questions? Nous pouvons vous aider. Pour communiquer directement avec un auteur, consultez la première page de la revue dans laquelle son article a été publié afin de trouver ses coordonnées. Si vous n’arrivez pas à les repérer, communiquez avec nous à [email protected].
Questions? Contact the NRC Publications Archive team at
[email protected]. If you wish to email the authors directly, please see the first page of the publication for their contact information.
NRC Publications Archive
Archives des publications du CNRC
This publication could be one of several versions: author’s original, accepted manuscript or the publisher’s version. / La version de cette publication peut être l’une des suivantes : la version prépublication de l’auteur, la version acceptée du manuscrit ou la version de l’éditeur.
Access and use of this website and the material on it are subject to the Terms and Conditions set forth at
Wind pressures on open rain screen walls : Place Air Canada
Ganguli, U.; Dalgliesh, W. A.
https://publications-cnrc.canada.ca/fra/droits
L’accès à ce site Web et l’utilisation de son contenu sont assujettis aux conditions présentées dans le site LISEZ CES CONDITIONS ATTENTIVEMENT AVANT D’UTILISER CE SITE WEB.
NRC Publications Record / Notice d'Archives des publications de CNRC:
https://nrc-publications.canada.ca/eng/view/object/?id=1e271f8f-0ed7-4cb0-b345-a72b07b9dcb7 https://publications-cnrc.canada.ca/fra/voir/objet/?id=1e271f8f-0ed7-4cb0-b345-a72b07b9dcb7Ser
-
TH1 Nalonal Councll Canada Research de recherches Canada Consell naflonalN21
dno.
1525
Institute for lnstitut dec . 2
,
Researchin recherche enBLDG
Construction construction-
- -- ,L
I
Wind Pressures on Open Rain
?
E
Screen Walls: Place Air Canada
by U. Ganguli and W.A. Dalgliesh
Reprinted from
Journal of Structural Engineering
A N ALYZED
Vol. 114, No. 3, March 1988p. 642-656
(IRC Paper No. 1525)
I4RC
-
CmTJ Price $3.00I R C
NRCC 28859tre%sAky
MAY
30
r2;b
~ i ~ t l 0 7 ~ 2 ~ t . J ~
!
I R C
CNFC-
f C 1 3 t F-+* .Canad3
- A -QC.
/
2.5
c:)?
c oi On a m d les diffhnces de pression du vent de part et d'autre du pare-pluie et du pare- air de panneaux muraux pdfabriquks h pare-pluie ouvert. Douze panneaux ont kt€ instnuntntts, sunout sur les faqides o u i t , no& et est du 24e &age h'un inrmeuble & bureau de 27 etages du centre-ville de Mondal. On a analyd 32 canaux
B
raison de 30 fois par m d e afin d'assunr une rhlution raiS0~able desbourrasquesB
leur maximum d'intensitt. Cewndant, il subsiste des doutes concanant leur ttendue sbatiale. car il n'v avait qu'un cap-teur ex& sur chaque panneau de 3.6 x 2.9 m (1 1.8 w 9,s pi).-
La charge maximale mes& sur le pan-pluie en une annh de mntr81e continu a CtC de 285 Pa (6 lpc), de d& 1 seconde. Lc plus grand kart de pression de pert et d ' a u a d'un panneau m p l e t de l'enveloppe du Mtimcnt n'a jamais comspondu aux &arts maximums
de pression sur It pare-pluie. Cependant, les maxima dus uniquemen! au vent, de part et
d'autre des y-- 9,9 IF). Les
diffhnccs C anent compte
d'effets de ant atteindre
By U. Gangulil and W. A. Dalglie~h,~ Member, ASCE ABSTRACT: Wind pressure differences are measured across the rain screen and across the air barrier assembly of precast open rain screen wall panels. Twelve panels are instrumented mostly on the west, north, and east walls of the 24th floor of a 27-story office building in downtown Montreal. 32 channels were scanned at 30 times per second to allow reasonable resolution of peak gusts. However, some doubt remains about their spatial extent, as each 3.6 x 2.9 m (11.8 x 9.5 ft) panel had only one external tap.
The maximum load measured on the rain screen in one year of continuous monitoring was 285 Pa (6 psfj, of duration 1 second. The largest pressure difference across an entire panel of the building envelope never coincided with peak pressure differences on the rain screen. However, maxima due to wind only, across windward panels, ranged from 400475 Pa (8.4-9.9 psf). Pressure differences across the air barrier assembly of wall panels included stack and heating, ventilating, and air conditioning (HVAC) effects of up to 150 Pa (3.1 psf) when ! outside temperatures dropped to -20°C (-4OF).
This paper presents field measurements of wind loads on precast open rain screen wall panels. An open rain screen wall consists of two wall layers separated by a cavity. The cavity is vented to the outside by openings in the outer layer (rain screen) to allow rapid equalization of cavity and external pressures. Most of the pressure difference across the building envelope is thereby transferred to the inner layer (the air banier assembly), so that when the rain screen is exposed to wind and rain there should be little or no pressure drop to carry the rain across the rain screen and into the cavity. The wall cavity provides a break in the path of any water that may cross the rain screen. The water is compelled to run down the inside of the rain screen and drain out. The air barrier assembly remains mostly dry.
In addition to intercepting rain drops (and any other impacting particles or objects), the rain screen shields sensitive components in the air barrier assembly (joints, sealants, and insulation) from the deleterious effects of ultraviolet radiation from the sun. The air barrier assembly is that portion of the wall panel which is intended to resist most of the wind load, thus the air banier assembly must be supported structurally to withstand both sustained and peak k i n d pressuresand suctions (~uirouette, R.L. 1985). 'Res. Ofcr. M-20 Montreal Rd., Inst. for Res. in Constr., Nat. Res. Council of Canada. Ottawa. KIA-0R6. Canada.
~ ~ e s . ' ~ f c r . M-20 Montreal Rd., Inst. for Res. in Consr., Nat. Res. Council of Canada, Ottawa, KIA-OR6, Canada.
Note. Discussion open until August 1, 1988. To extend the closing date one month, a written request must be filed with the ASCE Manager of Journals. The manuscript for this paper was submitted for review and possible publication on July 18, 1986. This paper is part of the Journal of Structural Engineering, Vol. 114, No. 3, March, 1988. OASCE, ISSN 0733-944518810003-0642/$1.00
+
$.I5 per page. Paper No. 22294.The air barrier assembly must be made the airtightness plane of the building envelope.
Resistance to lateral flow in the cavity, horizontally and vertically in the plane of the wall, must be provided by compartmentation at suitable intervals. This requirement follows from the variation in the external pressure over a building surface from maximum positive ("stagnation") values on the windward surface to maximum negative values just behind leading edges or in flow separation and reattachment zones on walls nearly parallel to wind direction. Without compartmentation, the cavity may provide a passageway for air movement in zones of large pressure gradients. Such air movement into the building envelope may entrain significant amounts of moisture in the form of rain or snow.
Although adequate venting of the wall cavity and compartmentation of the cavity of an open rain screen wall transfers most of the wind pressure to the air barrier assembly, the rain screen must still resist intermittent, short-term loading under gusting conditions. In the absence of quantitative information on how the load is shared, most of such wall systems are built to take the entire wind load on either the rain screen or the air barrier assembly. Some industry sources indicate that even a 20% reduction in the design pressure for the rain screen would save millions of dollars annually in building envelope construction costs.
The purpose of this study was to measure the wind pressures across the rain screen and air barrier assembly of a precast sandwich open rain screen panel. The study was conducted for one year. Pressure differences from stack effect and HVAC equipment operation were also monitored.
An extensive literature search on open rain screen walls has been conducted by Kerr (1985). Most of the existing recommendations are qualitative in nature (Latta 1963; Garden 1963). Investigations of open rain screen walls were conducted by Morrison Hershfield, Ltd. (1984) at Guelph, Ontario, in a boundary layer wind tunnel. They recommended that for compartmented wall panels the rain screen and air barrier assemblies be designed for 70% and 90% of the peak negative wind load, respectively.
The Place Air Canada building is located in the heart of downtown Montreal (Figs. 1,2) with a fetch (distance over land along which the wind blows) of at least 2 km (1.2 mil) in all directions; buildings in this area range from four to forty stories high.
To make best use of limited resources to capture important wind actions, twelve pressure-tapped panels were placed mainly on the west, north, and east walls (Fig. 3), all at the 24th floor, 85 rn (280 ft) above street level.
The air barrier assembly and rain screen are concrete elements 115 mm (4.5 in.) and 75 mm (3 in.) thick, respectively (Fig, 4a,b). On the outside of the air barrier assembly is 64 mm (2.5 in.) of extruded polystyrene insulation, separated from the rain screen by a 12.7 mm (0.5 in.) cavity. Each 3.6 x 2.9 m (11.8 x 9.5 ft) panel has an annular cavity space surrounding a 1.8 x 2.1 m (5.9 x 6.9 ft) central window. These cavities are sealed laterally and vertically from adjoining wall panels. The cavity is vented by a 15 mm (0.6 in.) opening that spans the width of the panel at the
It
N D O R C H E S T E R B L V D . BLDG. I -53.2 m @= -- 46.85 44.95 b 37.85 34.85@= -
28.85 S E C T I O N A - A 2 4 t h F L O O RFIG. 3. Location of Pressure Taps on 24th Floor
bottom, where a metal flashing is incorporated into the wall design. A similar opening exists just above the window.
The following instruments were used at Place Air Canada:
1. Polyvinylchloride pressure taps and standard 0.6 cm (114 in. tygon tubing of maximum total length 50 cm (20 in.). The frequency response of the tubing and transducer was flat (no amplitude distortion) up to 23 Hz. The analog signals were filtered with a 15 Hz low pass filter and then digitized.
2. Statham (Wheatstone Bridge) differential pressure transducers of range +- 1000 Pa (20.9 psf).
3. Two barometers of range 91-105 kPa (13.2-15.2 psi) and 95-102 kPa (13.8-14.8 psi) at positions 1 and 11 (Fig. 3), respectively (to monitor internal pressures). The restricted range enabled greater resolution for measuring wind effects, typically less than 1% of the barometric pressure, transmitted to the building interior. The barometers were centred at 98 kPa (14.2 psi), the normal barometric pressure for downtown Montreal.
d
VENTING AREA1 INTERCONNECTED CHANNELS l a ) I S O M E T R I C V I E WU
75 mm EXTERIOR PRECASl CONCRETE ELEMENT 12.7 mm A I R SPACE 64 mm EXTRUDED POLYSTYRENE INSULATION 115 mm INTERIOR PRECASTC
CONCRETE ELEMENT PRESSURE TAPS 15.9 mm GYPSUM BOARD ( b l C R O S S S E C T I O NFIG. 4. Open Rain Screen Panels at Place Air Canada
4. A three cup anemometer and vane (U-2A Canadian Meteorological Service), mounted on a roof top tower, 120 m (394 ft) above street level. A thermocouple for measuring the external temperature was set at the foot of the tower. It was placed in a casing to minimize convection effects.
5. A computer-controlled data acquisition system recording digitally on magnetic tape.
At each panel the pressure taps were referenced to the plenum just above the false ceiling at that location. This plenum pressure was essen- tially identical to the pressure in the rooms because of the loose construc- tion of the ceiling panels. The wind speed and direction were measured 18 m (59 ft) above the roof of the building. A scan of 32 channels was initiated at intervals of 0.033 s (30 times per second), and completed within 0.0032 s. For each channel, summary data for each 10 min of observation (mean, standard deviation, minimum, and maximum) were computed on-line and stored on magnetic tape.
High Wind Event
Additionally, individual readings (i.e., 301s for all 32 channels) were stored for 30 min following a "high wind" event. A high wind event occurred whenever a single reading of wind speed exceeded 18 mls (59 ftls) or the 10 min average exceeded 14 mls (45.9 ftls).
HVAC and Stack Effect Pressures
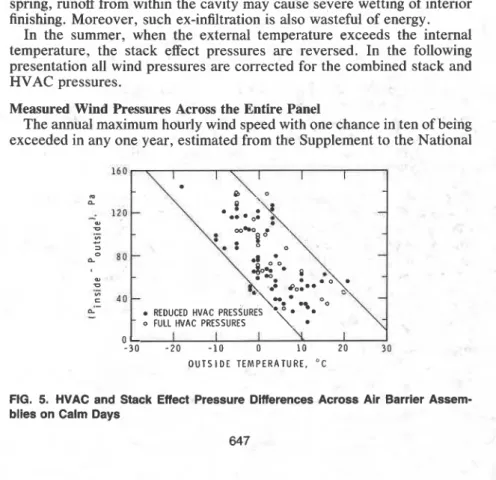
The pressure differences measured on calm days across the air barrier assembly are presented in Fig. 5. Although a trend is easily discernible, there is a fair amount of scatter in the data. This dispersion may be because the internal temperature conditions were changing over the time period. The temperature of unoccupied floors was 45°C (40°F) and as these floors were rented, the internal temperature increased to 20°C (68°F). Moreover, the loading door of the building was often open for transfer of goods into and out of the building. This could significantly affect the location of the neutral pressure plane.
The largest pressure difference measured was 150 Pa (3.1 psf) when the outside temperature fell to -20°C (-4°F). For taller buildings and colder weather, even larger pressures will develop. Unlike wind loads, these pressures must be sustained by joints and sealants of the air barrier assembly for days rather than a few hours.
An airtight component (the air barrier assembly) is essential in external walls and roofs, otherwise ex-infiltration will result through building envelopes. In the winter months exfiltrating warm humid air will usually deposit its moisture content, within the building envelope, on any surface that is below its dew point. In winter months, when the ambient temper- ature is below freezing, the moisture is deposited as ice. Over a period of several months a large amount of ice may collect in the wall cavity. In the spring, runoff from within the cavity may cause severe wetting of interior finishing. Moreover, such ex-infiltration is also wasteful of energy.
In the summer, when the external temperature exceeds the internal temperature, the stack effect pressures are reversed. In the following presentation all wind pressures are corrected for the combined stack and HVAC pressures.
Measured Wind Pressures Across the Entire Panel
The annual maximum hourly wind speed with one chance in ten of being exceeded in any one year, estimated from the Supplement to the National
O U T S I D E T E M P E R A T U R E , " C
FIG. 5. HVAC and Stack Effect Pressure Differences Across Air Barrier Assem- blies on Calm Days
NUMBER O F H I G H W I N D EVENTS
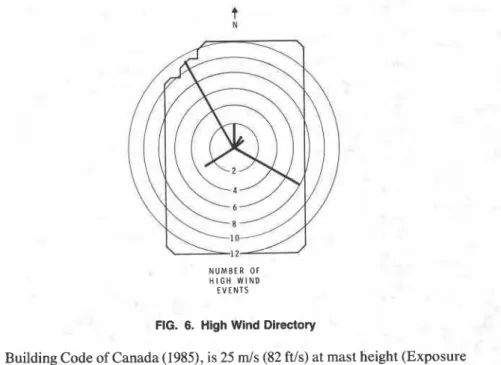
FIG. 6. High Wind Directory
Building Code of Canada (1985), is 25 m/s (82 ft/s) at mast height (Exposure C). The measured maximum hourly wind speed was 15 m/s (49.2 ftls), with gusts up to 30 m/s (98.4 ft/s). Consequently, wind pressures on wall components were measured at subdesign conditions. Fig. 6 indicates the number of high wind events recorded from various directions.
The largest wind pressure differences across entire wall panels, 400475 Pa (8.4-9.9 psf), were consistently measured for winds from the northwest. This direction allowed a relatively unobstructed approach for winds to the building. A typical 30-s. plot of wind loads across an entire panel, and the wind pressure distribution across the rain screen and across the air barrier assembly, are presented in Fig. 7. The wind speed and direction are shown as well. The cavity pressure at every instant was within 2% of the external pressure, so most of the wind load was transferred to the air barrier assembly.
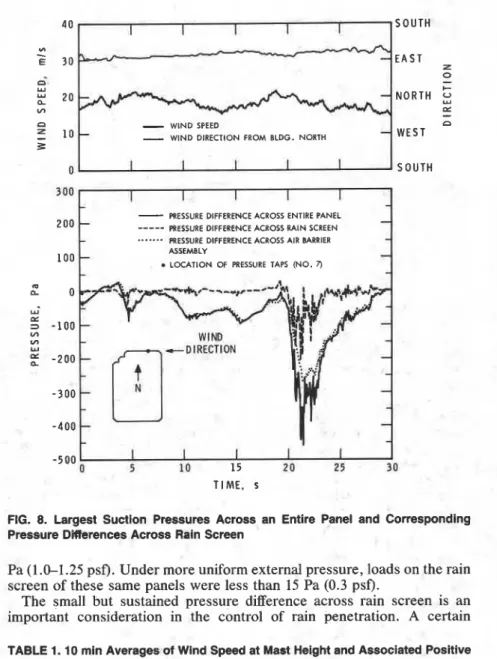
The largest measured suction pressure difference across a wall panel was 400-450 Pa ( 8 4 9 . 4 psf) (Fig. 8). During this 30-s. time history, the rain screen withstood wind pressure differences of up to 200 Pa (4.2 psf).
In general, for winds blowing from directions other than northwest, the Place Air Canada building was in the wake of other buildings. As a result, on average, local stagnation pressures were lower by 150 Pa (3.1 psf). Also, the distribution of measuring stations on the west and north walls enabled accurate determination of local maximum wind pressures from the northwest only.
Table 1 presents some of the largest pressure differences, corrected for stack and HVAC pressures only, measured across windward panels (stations 3 and 4). The corresponding 10 min averages of the wind speed at mast height are also given to show that the strongest winds did not necessarily give rise to the largest pressure differences across wall panels. For example, a pressure difference of 475 Pa (9.9 psf) is associated with an
4 0 1 I I SOUTH 1 I "7
-
E 30-
-
EAST Z d 0 u-
E 20 NORTH VI E CI-
E 10-
-
W I N D SPEED-
WESTI
-
W I N D DIRECTION FROM BLDG. NORTHC
0 I I I I I SOUTH
PRESSURE DIFFERENCE ACROSS RAIN SCREEN PRESSURE DIFFERENCE ACROSS AIR BARRIER
15 20 25 30
T I M E , S
FIG. 7. Sample Wind Pressures Across an Entire Panel and Corresponding Pres- sure Differences Across Rain Screen
average wind speed of 14.2 m/s (46.5 ftls) while a pressure difference of 420
Pa (8.8 psf) is associated with an average wind speed of 16 m/s (52.4 ftls). These pressures and corresponding wind speeds illustrate the difficulty of defining a datum to which pressure differences across the rain screen may be compared.
Wind pressure differences across the rain screen
In order to properly assess wind pressure differences across the rain screen, it is important to recognize a limitation of the building instrumen- tation: each 3.6 x 2.9 m (1 1.8 x 9.5 ft) panel that was instrumented had only one pressure tap to record surface pressures. Thus the surface pressures may not, at times, indicate the wind pressure on the entire panel, but rather the local condition in the immediate vicinity of the pressure tap. Similarly, there was only one cavity tap to measure the pressure between the two wall layers. Thus the existence of pressure gradients within the cavity could not be determined either.
Measurements indicate that pressure differences across the rain screen may be broadly classified into sustained loads, lasting several seconds, or short-lived (11 s) transient loads. In general, a sustained load was measured on a rain screen only when external pressure gradients (as judged by adjacent pressure taps) appeared to develop across the panel due to the airflow around the building. The largest sustained loads were 50-60
649
"7 *
-
E 30 0 n-
w 20-
0
N O R T HE
V) w-
n-
WIND SPEED n10
-
-
WlND DIRECTION FROM BLDG. NORTH-
WEST3
0
1
I I I I 11
S O U T H200
1
--
---
PRESSURE DIFFERENCE ACROSS ENTIRE PANEL PRESSURE DIFFERENCE ACROSS RAIN SCREEN. .
.
. . . .
PRESSURE DIFFERENCE ACROSS AIR BARRIER ASSEMBLY.
LOCATION OF PRESSURE TAPS ( N O . 7)-500 I I I I I
0 5 10 15 20 2 5 3 0
TIME, s
FIG. 8. Largest Suction Pressures Across an Entire Panel and Corresponding
Pressure DIe~ences Across Rain Screen
Pa (1.0-1.25 psf). Under more uniform external pressure, loads on the rain screen of these same panels were less than 15 Pa (0.3 psf).
The small but sustained pressure difference across rain screen is an important consideration in the control of rain penetration. A certain
TABLE 1. 10 min Averages of Wind Speed at Mast Height and Associated Positive
Peak Pressure Differences AcrQss Entire Panels on 24th Floor
Wind speeds at Positive peak pressure
mast height differences
(1 (2) 13.9 mls (45.6 ftls) 465 Pa (9.7 psf) 14.2 m/s (46.5 ftls) 430 Pa (9.0 psf) 14.2 m/s (46.5 ftls) 475 Pa (9.9 psf) 14.5 m/s (47.5 ftls) 450 Pa (9.4 psf) 16.0 m/s (52.4 ftls) 420 Pa (8.8 psf)
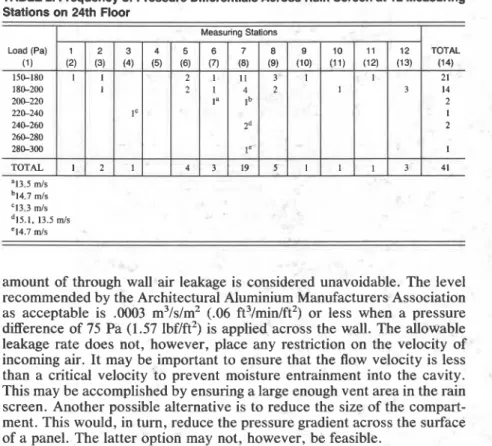
TABLE 2. Frequency of Pressure Differentials Across Rain Screen at 12 Measuring Stations on 24th Floor
I
Measuring Stations I Load(Pa) 1 2 3 4 5 6 7 8 9 10 11 12 TOTAL (1) (2) (3) (4) (5) (6) (7) (8) (9) (10) (11) (12) (13) (14) 150-180 1 1 2 1 1 1 3 1 1 21 180-200 1 2 1 4 2 1 3 14 2 w 2 2 0 la lb 2 220-240 lc 1 240-260 2d 2 260-280 280-300 l e 1 TOTAL 1 2 1 4 3 1 9 5 1 1 1 3 41amount of through wall air leakage is considered unavoidable. The level recommended by the Architectural Aluminium Manufacturers Association as acceptable is .0003 m3/s/m2 (.06 ft3/min/ft2) or less when a pressure difference of 75 Pa (1.57 lbf/ft2) is applied across the wall. The allowable leakage rate does not, however, place any restriction on the velocity of incoming air. It may be important to ensure that the flow velocity is less than a critical velocity to prevent moisture entrainment into the cavity. This may be accomplished by ensuring a large enough vent area in the rain screen. Another possible alternative is to reduce the size of the compart- ment. This would, in turn, reduce the pressure gradient across the surface of a panel. The latter option may not, however, be feasible.
Transient, short-lived pressure differences of up to 150 Pa (3.1 psf) were frequently measured across the rain screen at all twelve instrumented panels, but larger rain screen loads were rare. In order to expedite data analysis, only "events" when pressure differences across the rain screen exceeded 150 Pa (3.1 psf), or the total load across both the rain screen and the air barrier assembly exceeded 300 Pa (6.3 psf) were examined in detail. Table 2 presents the frequency of the transient pressure differentials (r 150
Pa (3.1 psf) ) across the rain screen at the twelve measuring stations. The rain screen of panel 7 was the site of the most such events, as well as the largest wind pressures. At such times the winds were from the east, at an angle of attack of 90-120 degrees from the building north. Consequently, rain screen loads at panel 7 may be related to the formation and subsequent reattachment of a leading edge separation bubble for wind conditions favoring the formation of such a separation bubble. 10 min averages of wind speeds associated with the largest peak pressure differences across the rain screen are also indicated.
The peak pressure differences are significant in that the rain screen and its anchors must be designed to withstand such gust loads. In thirty-nine of the forty-one peak pressure differences presented in Table 2, the cavity pressure exceeded the exterior pressure. In addition, the durations of peak pressure differences across rain screens were one second at most. Thus, the threat of rain penetration under such peak loads is minimal.
I
FIG. 9. 10 min Averages of Wind Speeds, at Mast Height, Associated with 41 Events Listed in Table 2
A histogram indicating the wind speed at mast height averaged over 10 min for each "event" listed in Table 2 is also presented in Fig. 9. From the histogram it may be seen that peak pressure differences across rain screens are associated with storms having wind speeds that range from 13-16 mls (42.6-52.4 ftls) with 80% of the storms having wind speeds in the range of 1415.5 m/s (45.e50.8 ftls).
The information most useful for structural engineers is the percentage of the wind load that amears on the rain screen. In wind tunnel studies a convenient reference for wind loads on rain screens is the upstream dynamic wind pressure at a preselected elevation (roof height, for exam- ple) above ground. In field measurements such detailed information is usually unavailable, so an alternate reference pressure must be used.
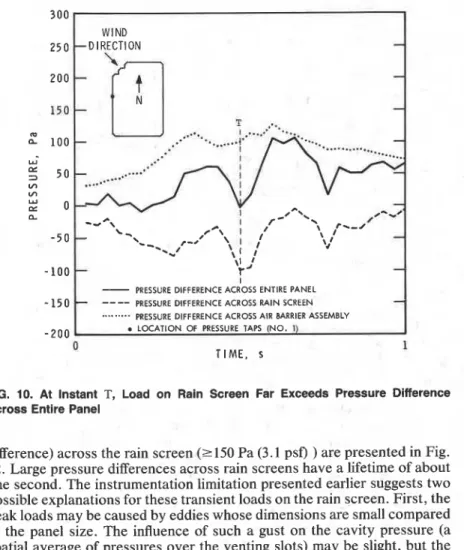
The largest pressure differences across both layers of the building envelope never coincided with peaks on the rain screen. Often (Fig. 10) the difference in pressure across the rain screen, at a panel, exceeded the pressure difference across the entire panel at that instant. Thus it 's meaningless to present transient pressure differences across a rain screen, at any instant, as a percentage of the total pressure differences across the
entire ane el at that instant.
3
A possible reference for pressure differences across rain screens could be the dynamic wind pressure at mast height. However, measurements indicated that wind pressure fluctuations at the 24th floor were uncorrela- ted to fluctuations in wind speed at mast height. A more convenient source for referring pressure differences across rain screens was the lower limit of peak "stagnation" pressures at the 24th floor, that is, a nominal value of 400 Pa (8.4 , sf). * ,
The frequency of occurrence of transient pressure differentials across rain screens is presented in Fig. 11. The largest transient pressure differential across a rain screen was 285 Pa (5.9 psf), or 72% of the reference nominal gust pressure.
300
WIND 250 -DIRECTION
1
- 1 0 0
-
-
-
PRESSURE DIFFERENCE ACROSS ENTIRE PANEL-150 7
----
PRESSURE DIFFERENCE ACROSS RAIN SCREEN-
.. . . .
..
. . PRESSURE DIFFERENCE ACROSS AIR BARRIER ASSEMBLY -200-
LOCATION OF PRESSURE TAPS ( N O . 1)0 1
TIME, s
FIG. 10. At Instant T, Load on Rain Screen Far Exceeds Pressure Difference Across Entire Panel
difference) across the rain screen (r 150 Pa (3.1 psf) ) are presented in Fig. 12. Large pressure differences across rain screens have a lifetime of about one second. The instrumentation limitation presented earlier suggests two possible explanations for these transient loads on the rain screen. First, the peak loads may be caused by eddies whose dimensions are small compared to the panel size. The influence of such a gust on the cavity pressure (a ..spatial average of pressures over the venting slots) may be slight, but the exterior tap will respond fully as the gust passes over it. A second reason might be that the volume of air in the cavity is unable to respond to the , rapid external pressure fluctuations. However, when the cavity and the two wall layers are approximated as a Helmholtz resonator (Morrison Hershfield 1984) the natural frequency of the cavity is over 50 Hz. It appears, therefore, that transient pressure differentials across the rain screen may be primarily due to gusts which are smaller in size than the panels.
In one instance a peak pressure difference (greater than 150 Pa (3.1 psf) ) was observed across the rain screen at station 6 and subsequently at station 5 after 0.3 seconds. Smaller gusts are not as easily identifiable because their strength is comparable to the background turbulence. It appears that peak pressures on rain screen are caused by flow character- istics, such as vortex shedding and so on around the building. It is unlikely that the surface topography of the building, with features such as window recesses, has much influence on the peak pressure differences. A detailed
AP A C R O S S RAIN S C R E E N
% MAXIMUM W I N D P R E S S U R E
FIG. 11. Frequency versus Pressure Differences (2150 Pa (3.1 psf)) across Rain Screen; Pressure Differences Expressed as Percentage of Maximum Nominal Wind Pressure (400 Pa (8.4 psf) )
study of such peak pressures in a boundary layer wind tunnel, with flow visualization, appears feasible and would be extremely informative.
In the absence of wind, HVAC and stack effect pressures as high as 150 Pa (3.1 psf) were measured across the air barrier assembly when the outside temperature fell to -20°C (-4°F). Consequently, joint sealants must withstand sustained pressure differences, for days or even weeks at a time, without failing in creep.
During periods of high wind, maximum gust pressures (both inward and outward) ranged from 400-475 Pa (8.4-9.9 psf). However, the largest wind-induced pressure differences across the rain screen lasting several seconds or more were only 50-60 Pa (1.0-1.25 psf).
A few peak pressure differences lasting one second or less were observed across the rain screen, exceeding 150 Pa (3.1 psf), and on one occasion reaching 285 Pa (5.9 psf). While of little significance for rain penetration (most were directed outward in addition to being of such short duration), these peaks indicate that the rain screen and its attachment may have to withstand as.much as 75% of the design pressure for the whole wall assembly.
The Place Air Canada study suggests that significant reductions in design pressures for the rain screen portion of wall assemblies are warranted in cases where venting and compartmenting are effective. Field studies of other wall systems are needed to confirm the importance of such design details, and measurements are currently underway in Lethbridge, Alberta. There, the wall cavity is almost 100 times larger than at Place Air Canada while the venting area is 10 times smaller. As it is suspected that the peak pressure differences at Place Air Canada may have been extremely
TIME, s TIME,
s
N o t e : N e g a t i v e p r e s s u r e i n d i c a t e s c a v i t y p r e s s u r e e x c e e d s e x t e r n a l p r e s s u r e
FIG. 12. One-second Time Histories of Transient Pressure Differences across Rain Screens
localized (not representative of the whole panel), up to four surface and two cavity taps have been installed in some panels. If more can be learned of the spatial extent of the peak pressures, even greater reductions in recommended design pressures for rain screens may be possible.
This paper is a contribution of the Institute for Research in Construction (IRC) of the National Research Council of Canada.
The support and contributions of the following organizations and indi- viduals are gratefully acknowledged: Trizec Equities Ltd., Air Canada, Jean Eudes Guy, Andre Ross and Frank McGrath of Trizec, and Ken Burn and Frank Hurnmel of IRC.
The resonant frequency N of an enclosed volume of air V connected by an aperture of area A to the outside is given by Rayleigh (1945)
'
where N = natural frequency of the enclosed volume of air (Hz); a = speed of sound (rnls) = 340 m/s (1 115 ftls); C = conductivity of the aperture (m); and V = volume of enclosed air (m3) (0.1 m3) (3.5 ft3). A lower limit for C
, is given by
C = G z 0 . 3 0 m (1.0ft)
...
&
(2)where A = aperture area = 0.07 m2 (0.8 ft2). An estimate of the resonant frequency of the panel cavity is provided by
N = 340@
...
2 K f i
=
93 Hz. (3)Garden, G. K. (1963). "Rain penetration and its control." Canadian Building Digest 40, Div. of Bldg. Res., Nat. Res. Council of Canada, Ottawa, Canada. Kerr, D. D. (1985). "Annotated bibliography on the rain screen principle."
Bibliography N o . 45, Div. of Bldg. Res., Nat. Res. Council of Canada, Ottawa, Canada.
Latta, J. K. (1963). "Walls, windows and roofs for -the Canadian climate."
Special Tech. Publication N o . I , Div. of Bldg. Res., Nat. Res. Council of Canada, Ottawa, Canada.
Momson Hershfield. (1984). "A wind tunnel investigation of rain screen wall systems." Contract No.: 15SR.31944-0014. Guelph, Ontario, Canada.
Quirouette, R. L. (1985). "The difference between a vapour barrier and an air barrier." Building Practice Note 54, Div. of Bldg. Res., Nat. Res. Council of Canada, Ottawa.
Lord Rayleigh. (1945). The Theory of Sound. IV, 2nd Ed., Dover Publications, New York, N.Y.
Supplement to the National Building Code of Canada. (1985). NRCC No. 23178, Nat. Res. Council of Canada, Ottawa, Canada.
T h i s p a p e r is being d i s t r i b u t e d i n r e p r i n t forin by t h e I n s t i t u t e f o r Research i n C o n s t r u c t i o n . A l i s t of b u i l d i n g p r a c t i c e and r e s e a r c h p u b l i c a t i o n s a v a i l a b l e from t h e I n s t i t u t e may be o b t a i n e d by w r i t i n g t o t h e P u b l i c a t i o n s S e c t i o n , I n s t i t u t e f o r R e s e a r c h i n C o n s t r u c t i o n , N a t i o n a l R e s e a r c h C o u n c i l o f C a n a d a , Ottawa, O n t a r i o , K l A 0R6.
Ce document e s t d i s t r i b u g sous forme de t i r 6 - a - p a r t p a r 1' I n s t i t u t de r e c h e r c h e e n c o n s t r u c t i o n . On p e u t o b t e n i r une l i s t e d e s p u b l i c a t i o n s de 1' I n s t i t u t p o r t a n t s u r l e s t e c h n i q u e s ou l e s r e c h e r c h e s e n matisre d e b d t i m e n t e n d c r i v a n t 3 l a S e c t i o n d e s p u b l i c a t i o n s , I n s t i t u t de r e c h e r c h e e n c o n s t r u c t i o n , C o n s e i l n a t i o n a l d e r e c h e r c h e s du Canada, Ottawa ( O n t a r i o ) , K l A 0R6.