Three Essays on Investment in Human Capital in Canada
Thèse
Aboudrahyme SAVADOGO
Doctorat en économique
Three Essays on Investment in Human Capital in Canada
Thèse
Aboudrahyme SAVADOGO
Sous la direction de:
Bernard FORTIN, Directeur de recherche Jean-Yves DUCLOS, Codirecteur de recherche
Résumé
Cette thèse examine l’investissement en capital humain au Canada en s’intéressant à la contribu-tion de l’aide financière aux études, aux effets de la fiscalité, à la rentabilité de l’investissement en éducation postsécondaire et à la redistribution des revenus. Elle est subdivisée en cinq chapitres.
Le premier chapitre présente une révue chronologique des études microéconomiques sur l’inves-tissement en capital humain. Il présente également une synthèse des études canadiennes sur l’in-vestissement en capital humain en insistant sur les limites portant essentiellement sur la non prise en compte de l’hétérogénéité des systèmes de prêts et bourses et des systèmes fiscaux à travers les provinces canadiennes et la faible analyse de la répartition des coûts et bénéfices de l’investisse-ment en éducation au Canada.
Le second chapitre présente la méthodologie de mesure des rendements de l’éducation et des gains issus des investissements en éducation. Il décrit les données utilisées et les résultats des régressions économetriques. Finalement, le chapitre présente SIMAID, un calculateur d’aide financière aux études élaboré pour les objectifs dans cette thèse et qui permet d’estimer le montant de l’aide financière devant être attribuée à chaque étudiant en fonction de ses caractéristiques personnelles et de celles de sa famille.
Dans sa première section, le troisième chapitre présente les rendements sociaux, privés et publics de l’éducation et montre que les rendements de l’éducation varient selon les provinces, les filières
de l’Ontario entraîne une baisse de 11.9% du rendement des études au baccalauréat alors qu’un changement du système fiscal québécois par celui ontarien entraine une hausse du rendement du baccalauréat de 4.5%. L’effet combiné du changement des systèmes d’aide financière et fiscal est une baisse du rendement du baccalauréat de 7.4%.
Le quatrième chapitre fournit une décomposition comptable détaillée des gains sociaux, privés et publics des investissements en éducation. Le gain social de l’investissement au baccalauréat est de $738 384 au Québec et de $685 437 en Ontario. Ce gain varie selon les filières de formation avec un niveau minimal pour les études humanitaires et un niveau maximal pour les études en ingénierie. Le chapitre montre également que la répartition des bénéfices et des coûts de l’investissement en éducation entre les individus et le gouvernement est plus équitable en Ontario qu’à Québec. En effet, un individu qui investit à Québec supporte 51.6% du coût total et engrange 64.8% des gains alors que le même individu supporterait 62.9% des coûts sociaux et engrangerait 62.2% des gains en Ontario.
Finalement, le cinquième chapitre présente et analyse les effets rédistributifs des transferts et des taxes suite à un investissement en éducation. Il examine aussi si l’aide financière aux études est effectivement allouée aux personnes les plus pauvres. L’argument selon lequel l’aide financière est destinée aux plus pauvres est rejeté en analysant la distribution du revenu permanent. En effet, il ressort que 79% des personnes bénéficiant de l’aide financière aux études se trouvent dans le cinquième quintile de la distribution des revenus permanents. Le chapitre montre également que l’investissement en éducation impacte positivement les effets rédistributifs en 2006, 2001 et 1996 et négativement en 1991 et 2011. L’impact est également perceptible sur les composantes de l’effet rédistributif. Toutefois, la sensibilité de l’impact au taux d’actualisation dépend de l’indice utilisé dans l’analyse.
Abstract
This thesis investigates investment in human capital in Canada including the contribution of fi-nancial assistance to students, the profitability of investment in postsecondary education and the income redistribution. It is divided in five chapters.
The first chapter presents a chronological survey of microeconomics studies on investment in hu-man capital. It also summarizes Canadian studies on investment in education and highlights the main limitations of these studies, particularly in terms of how they disregard the heterogeneity of grant and tax system among Canadian provinces and the sharing of benefits and costs of invest-ment in education in Canada.
The second chapter presents the methodology of measurement of returns to education and gains from investment in education. It describes data used the results of the econometric regressions. Finally, the chapter presents SIMAID, a calculator of financial assistance to students developed for the purpose of this dissertation with the aim to estimate the amount of grant to which each student is entitled to according his/her personal and family characteristics.
In its first section, the third chapter reports social, private and public returns to education and shows that returns vary across provinces, fields of study, gender and cohort of birth year and de-cline with respect to the level of education. In its second section, the chapter shows a positive impact of financial assistance on returns to a B.A. degree of 24.3% and 9.5% in Quebec and Ontario
The fourth chapter provides a detailed title-by-title accounting decomposition of social, private and public gains from investment in education. The social gain from an investment in a B.A. degree is $738,384 dollars in Quebec and $685,437 in Ontario. This gain varies from one field of study to another, with the lowest level in the humanities and the highest level in engineering studies. The chapter shows that the sharing of benefits from investment in education between individuals and government regarding the sharing of costs is more equitable in Ontario than in Quebec. Indeed, an individual who invests in education in Quebec supports 51.6% of the total costs of investment and earns 64.8% of the social gain while the same individuals will support 62.9% of social costs and earn 62.2% of social gain if he/she invest in education in Ontario.
Finally, the fifth chapter reports on and analyzes the redistributive effects of taxes and transfers due to investment in education. It also investigates whether or not the financial assistance to students program is actually in favour of the poorest individuals. The argument from which a grant is provided to poor individual is overturned when analyzing the distribution of permanent income. Indeed, we find that 79% of grant beneficiaries are in the richest quintile (Q5) of permanent incomes. The chapter also shows that investment in education positively impacts the redistributive effect in 2006, 2001 and 1996 and negatively in 1991 and 2011. The impact is also observable on the components of the redistributive effects. However, its sensitivity to the discount rate varies with respect to the index used in the analysis.
Contents
Résumé iii Abstract v Contents vii List of Tables ix List of Figures xi Acknowledgments xv Introduction 1 1 Literature Review 51.1 A survey of microeconomic models of investment in human capital . . . 5
1.2 Summary of Canadian studies on returns to education . . . 13
2 Methodological Approach 21 2.1 Measuring returns to education . . . 21
2.2 Data . . . 27
2.3 Empirical model. . . 34
2.4 Regressions and earnings profile . . . 40
3 Impact of Public Funding and Tax System on Returns to Education in Canada 50 3.1 Introduction . . . 51
3.2 Returns to education . . . 52
3.3 Impact of a change in public funding and tax system on returns to education . . 71
5 Investment in Education in Canada : An Analysis of the Redistributive Effects of
Taxes and Transfers 118
5.1 Introduction . . . 119
5.2 Measurement of redistribution . . . 123
5.3 Data and methodology . . . 126
5.4 Results . . . 133
5.5 Conclusion . . . 148
Conclusion 150
List of Tables
1.1 Micro economic models of investment in human capital . . . 12
1.2 Returns to education in selected Canadian studies . . . 18
2.1 Allocation of the sample among provinces. . . 29
2.2 Evolution of average employment income by province ($2011) . . . 29
2.3 Annual private and public costs of education for a B.A. degree by province - 2011. . 32
2.4 Tuition fees for B.A. degree studies by province and field of study - 2011 . . . 32
2.5 Student monthly living allowances by province. . . 34
2.6 Descriptive statistics of main variables - Individuals aged between 19 and 64 years . 38 2.7 Descriptive statistics of main variables - Individuals aged between 19 and 64 years . 39 2.8 Least absolute deviation regression results by province . . . 46
3.1 Social returns to a B.A. degree by province and cohort of birth year . . . 60
3.2 Private returns to a B.A. degree by province and cohort of birth year . . . 60
3.3 Public returns to a B.A. degree by province and cohort of birth year . . . 61
3.4 Private returns to a B.A. degree by province, gender and cohort of birth year. . . 65
3.5 Private returns to B.A. degree by fields of study and cohort of birth year in Quebec, Ontario and Alberta. . . 67
3.6 Effect of financial assistance to students on private return to a B.A. degree in Quebec and Ontario. . . 70
3.7 Effect of financial assistance to students on public return to a B.A. degree in Quebec and Ontario. . . 70
3.8 Change in present value of gain from an investment in a B.A. degree due to a change of Quebec’s tax and grant systems to Ontario’s. . . 71
3.9 Impact of a change of Quebec’s grant system to Ontario’s on private and public returns to a B.A. degree for an individual who pays both Quebec and federal taxes . 75 3.10 Impact of a change of Quebec’s grant system to Ontario’s on private and public returns to a B.A. degree for an individual who pays only Quebec provincial taxes . . 77
3.14 Impact of a simultaneous change in both Quebec’s tax and grant systems to On-tario’s on private and public returns to a B.A. degree for an individual who pays
provincial taxes only . . . 85
4.1 Structure of the social gain from an investment in a B.A. degree . . . 92
4.2 Social gain from an investment in a B.A. degree by field of study. . . 94
4.3 Variation in % of net present value of incomes by field of study . . . 94
4.4 Sharing of social costs and gain from an investment in a B.A. degree. . . 96
4.5 Decomposition of social gain from an investment in a B.A. degree . . . 98
4.6 Decomposition of social gain from an investment in a B.A. degree . . . 98
4.7 Decomposition of social gain from an investment in a B.A. degree for each field of study . . . 98
4.8 Net present value of gains from an investment in a B.A. degree. . . 100
4.9 Decomposition of the private gain from an investment in a B.A. degree . . . 105
4.10 Private gain from an investment in a B.A. degree by field of study . . . 105
4.11 Accounting analysis of the private gain from an investment in a B.A. degree . . . 105
4.12 Average private gain from an investment in education. . . 105
4.13 Accounting analysis of the public gain from an investment in a B.A. degree . . . 112
4.14 Public gain from an investment in a B.A. degree by field of study . . . 112
4.15 Variation in federal taxes after an investment in a B.A. degree . . . 112
4.16 Variation in provincial taxes after an investment in a B.A. degree . . . 112
4.17 Variation in total taxes after an investment in a B.A. degree . . . 113
5.1 Selected studies on redistributive effect . . . 122
5.2 Proportion (%) of investors in education across age groups . . . 128
5.3 Structure of the sample of the study (% of total individuals in different sample years) 128 5.4 Descriptive statistics of the main variables - Individuals investing and non investing in education aged between 19 and 64 years . . . 131
5.5 Descriptive statistics of the main variables - Individuals investing and not investing in education aged between 19 and 64 years . . . 132
5.6 Distribution of individuals investing in education by quintile of income in Quebec, Ontario and Canada . . . 134
5.7 Evolution of proportions of individuals investing in education in different quintile of periodic income across year in Quebec, Ontario and entire Canada . . . 137
5.8 Evolution of proportions of individuals investing in education in different quintile of permanent income across year in Quebec, Ontario and entire Canada . . . 137
5.9 Redistributive effect of taxes and transfers, 2011 and 2006 . . . 141
5.10 Redistributive effect of taxes and transfers, 2001, 1996 and 1991 . . . 142
5.11 Sensitivity of indexes to the discount rate - With investment in education . . . 144
List of Figures
1.1 Comparison between OLS and IV returns to education . . . 9
1.2 Summary of studies on returns to education in Canada . . . 14
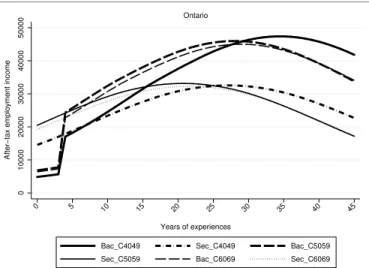
2.1 Evolution of the employment income of a worker with a B.A. degree by cohort of birth year - Ontario . . . 42
2.2 Evolution of the employment income of a worker with a B.A. degree by cohort of birth year - Quebec . . . 42
2.3 Evolution of the employment income of a worker with a B.A. degree by cohort of birth year - Alberta . . . 43
2.4 Comparison of after-tax employment income of a worker with a high-school degree and one with a B.A. degree - Ontario . . . 44
2.5 Comparison of after-tax employment income of a worker with a high-school degree and one with a B.A. degree - Quebec . . . 44
2.6 Comparison of after-tax employment income of a worker with a high-school degree and one with a B.A. degree - Alberta . . . 45
3.1 Cohort effect on private returns to a B.A. degree by province . . . 54
3.2 Cohort effect on public returns to a B.A. degree by province . . . 54
3.3 Cohort effect on social returns to a B.A. degree by province . . . 55
3.4 Social, private and public returns to a B.A. degree in Quebec . . . 58
3.5 Social, private and public returns to a B.A. degree in Ontario . . . 58
3.6 Social, private and public returns to a B.A. degree in Alberta . . . 59
3.7 Evolution of private returns to education by level of education in Quebec . . . 63
3.8 Evolution of private returns to education by level of education in Ontario . . . 63
3.9 Impact of financial assistance to students on private return to B.A. degree in Quebec and Ontario . . . 68
3.10 Impact of a change of Quebec’s grant system to Ontario’s on private and public returns to a B.A. degree in Quebec . . . 73
4.3 Evolution of periodic social, private and public gains from an investment in
educa-tion - Quebec’s system . . . 99
4.4 Evolution of cumulative social, private and public gains from an investment in edu-cation - Quebec’s system . . . 99
4.5 Evolution of periodic social, private and public gains from an investment in educa-tion - Ontario’s system . . . 101
4.6 Evolution of cumulative social, private and public gains from an investment in edu-cation - Ontario’s system . . . 101
4.7 Evolution of the present value of social, private and public gains from an investment in education - QC-QC-QC-QC . . . 101
4.8 Evolution of the present value of social, private and public gains from an investment in education - ONT-ONT-ONT-ONT . . . 101
4.9 Structure of the lifetime private gain from an investment in education . . . 103
4.10 Evolution of the private gain from an investment in education by tax-grant systems 106 4.11 Evolution of the net present value of private gains from an investment in education by tax-grant systems . . . 108
4.12 Structure of the lifetime public gain from an investment in education . . . 109
4.13 Evolution of the net present value of public gains from an investment in education by tax-grant systems . . . 114
4.14 Evolution of the gain of taxes from an investment in education, QC-QC-QC-QC and QC-QC-ONT-ONT . . . 116
5.1 School attendance by age groups- 2011. . . 128
5.2 Sensitivity of the Redistributive effect (RE) to discount rate . . . 147
5.3 Sensitivity of the Redistributive effect (R) to discount rate. . . 147
5.4 Sensitivity of the Vertical effect (VK) to discount rate . . . 147
5.5 Sensitivity of the Vertical effect (V) to discount rate . . . 147
5.6 Sensitivity of the Reranking index (RAP) to discount rate . . . 147
Merci au tout misericordieux, au très misericordieux pour toutes les grâces. A mon épouse Awa et mon
fils Nahel qui remplissent ma vie de bonheur. A ma mère Mariam
SAVADOGO, A Mon père Moussa SAVADOGO, A mes frères et soeurs. A tous ceux qui ont
contribué à ma formation depuis l’enfance. A toutes les mères qui
consacrent leur vie à rendre leurs enfants heureux. A tous ceux qui
Le plus grand but de l’éducation n’est pas le savoir mais l’action.
Acknowledgments
I want to thank my country, Burkina Faso and its entire people for all funding I received for my education. To all the young Burkinabe who have not had the opportunity to lead and / or complete higher education for various reasons, I dedicate this diploma to you. I am also grateful for my country of birth, Côte d’Ivoire, for all the support that I got during my primary education and my engineering studies at the National School of Statistics and Applied Economics of Abidjan. I want to express my gratitude to Canada and particularly to the beautiful province of Quebec and its people for the warm hospitality and for all funding that I got throughout my doctoral studies. I am also grateful for CIRPEE, FRQSC and SSHRC from whom I received funding for my studies.
Throughout my modest life, I have always had the opportunity and the privilege of meeting people of very good quality. Bernard Fortin and Jean-Yves Duclos are part of those people.
I want to express my gratitude to Bernard Fortin, my supervisor, for his availability, guidance, patience, understanding and support. Bernard has been generous in sharing his knowledge.
It is thanks to the high quality coaching, advice, encouragement and understanding of Jean-Yves Duclos that I could complete these doctoral studies. I want to show him here all my gratitude and appreciation for all the knowledge that he shared with me with humility and modesty. Jean-Yves, thank you for everything.
thank you. I specifically address my heartfelt thanks to the administrative staff of the economics department, whose beautiful and efficient organization allows students to take courses in very good conditions.
To my colleagues of the SIMUL group of University Laval, Luc, Steeve and Nicholas James, I say thank you for all the support and advice. I am also grateful to my comrades, Rokhaya, Ali, Safa, Maria, Andre-Marie, with whom I shared the same office throughout this thesis.
My stay in Quebec allowed me to increase my social capital with wonderful people who have contributed significantly to my success. I want to greet my family, the Burkinabe community in Quebec, which always supported me. To all these young people who affectionately called me Ton-ton Abou or Koro Abou, I want to show all my love and gratitude. I also express my gratitude to my people Habib, Nafissatou, Shaida, Namaro, Arnaud, Arsene, Clarence, Yélé, Mamadou, Lacina and Serge and their respective families.
My family has played a vital role in my development and my education. I want to express my love, my pride and gratitude to my brothers and sisters. Adama, Assiata, Boubakary, Kadiatou, Soumaila, Mohamed and Aminata, thank you for being always there. I also want to thank Ousseini, Seydou, Adama, Maimouna for their multifaceted support.
Throughout this thesis, I had the unconditional and invaluable support of my biological parents and my in-laws. So it is a great pride for me to show them my appreciation and gratitude. In particular, I dedicate this achievement to my biological parents, Moussa and Mariam who, despite the weakness of their resources, invested with love and faith in my education as well as those of my brothers and sisters. This doctoral degree is proof of the profitability of their investments in my education.
Finally, I want to recognize the merit of three special persons that are very dear to me. My wife Awa and my sons Rûûda Khaamil Nahel and Rahyan Adama Mitoubkieta. I want to say a big thank you for their love, support, understanding and patience. Thanks to you, I go and I always will advance in the right direction with the help of God. I love you immensely.
Introduction
The concept of human capital is relatively broad and encompasses many aspects such as formal education, job training, learning, health, etc. This dissertation only focuses on education which re-presents an investment for an individual who goes to school. Indeed, when acquiring additional years of education, an individual supports direct monetary costs (tuition fees), indirect monetary costs (forgone earnings due to education) and psychological costs. When entering the workforce after graduating, this individual earns higher income compared to the income he would earn if he/she did not increase his level of education. The decision to invest in education is a tradeoff between the costs of these additional years of education and the benefits from the increase in em-ployment income associated with the investment in additional years of education. Governments support the public costs of the investment in education. In return, they collect more taxes from more educated workers. For governments, the trade-off concerns allocation of scarce funds to edu-cation and to other sectors.
This dissertation is of interest due to the fact that returns to education are useful for both indivi-duals and governments in allocating resources. Indeed, private returns, that is the private benefit from each dollar invested in education, guides individuals in their spending decisions. Public re-turns allows the local, provincial and federal governments to assess the benefits of investment in education. Additionally, in Canada, there is a significant increase in the cost of education, and so the problem of the allocation of total costs/benefits from investment in education between
stu-creased by 3.2% in real terms (see Canadian Association of University Teachers (CAUT) Almanac of post-secondary education 2011-2012). According to Statistics Canada, tuition grew by 17.7% for undergrad studies and by 20.5% for graduate studies in real terms during the same period.
Evidence from several studies indicates that investment in education is profitable. In this view, a rational agent who does not have sufficient resources to invest in education will borrow for it. In Canada, students rely massively on loans in order to finance their education. According to the 2012 report by the Canadian universities consortium (CUC 2012), 60% of Canadian undergraduate stu-dents are indebted. The average debt of a student when graduating is 16,634 dollars for university and 9,601 dollars for college (Statistics Canada). A third of students have a debt of 20,000 dollars or more (see CUC 2012) and many students experience difficulties in debt repayment. According to the Canada Student Loans Program 2012-2013 report, in 2011-2012, almost 185,000 students who are in default in their student loan repayment have benefited from assistance under repayment assistance plan. This represents a loan default rate1of 13%.
In parallel to the growth of the levels of student debt and tuition fees and the decrease of govern-ments subsidies to universities, the demand for postsecondary education rose in Canada. Accor-ding to Statistics Canada, the number of enrolled students grew by 33.9% between 2000 and 2009, with a 29.0% increase for undergraduate students and a 52.1% increase for graduate students. In Quebec, the number of students increased by 17% for undergraduate and by 43.4% for graduate while in Ontario the increase was 46.2% for undergraduate and 60.0% for graduate. The conse-quences of these increases include pressure on public infrastructure and funding of education.
In this context, the issue of the sharing of total costs/benefits from investment in education bet-ween students and governments (provincial and federal) is posed most acutely. This is particularly true in a context of increases in costs of education as described above.
Despite this context of increases in costs of education and of pressures on resources, both govern-ments and individuals still invest in education for numerous monetary and non-monetary reasons. Governments invest in education in order to allow their populations to acquire skills and know-ledge. These acquired skills increase productivity and generate conditions for viable and sustai-1. The loan default rate is the ratio of cumulative amount of all defaulted loans for the period covering the year of consolidation and the subsequent two years, to the total amount of all loans consolidated in that year.
nable growth for the current economy and into the future. Additionally, individuals who benefit from a government’s funding of education will earn higher incomes. As a result, these individuals will pay higher taxes compared to the costs of their education, which increases government reve-nues. A part of these taxes are transferred to poorest individuals. This favours income distribution, which is critical to reducing poverty and inequality. Finally, individuals with high incomes rely less on government assistance programs, thereby reducing the total costs of assistance programs provided by a government.
A government’s funding of education is also motivated by non-monetary gains. Indeed, investing in the education of its population results in improvements in health and promotes good gover-nance. It also reduces corruption and criminality, increases civic participation and favours techno-logical innovation.
Individuals are willing to invest in education by supporting monetary (tuition fees and forgone in-come) and psychological costs in the near-term to accumulate skills and knowledge. This increases individuals’ productivity, and thus increases their job opportunities when graduating. Indeed, an individual’s acquired diploma serves as a signal of his/her unrevealed productivity to employers in the labor market.
Psychological costs supported by individuals when investing in education are partially compensa-ted by psychological returns. These benefits include an increase in job satisfaction, in non-market productivity and a better social position. Additionally, more educated parents get satisfaction kno-wing that their background has positive impact on their children’s abilities, health and education.
Canadian provincial and federal governments finance education by taxes collected from workers. This funding is in the form of direct subsidies to universities and financial assistance to students. In return, governments collect higher taxes from more educated workers. At the same time, indi-viduals benefit from public funding of education and support private costs when going to school.
birth year. We develop a calculator of financial assistance that computes grants and loans to be pro-vided to each student depending on some of his/her characteristics (parental and spouse income, employment income, cost of education, etc.). The second contribution to literature is threefold : (i) the measurement of the impact of financial assistance to students on returns to education, (ii) the measurement of the impact of a change in tax system on returns to education and (iii) the measurement of the impact of a simultaneous change in both grant and tax systems on returns to education.
In its fourth chapter, this dissertation contributes to the literature by providing an accounting de-composition of different gains from investment in education including an analysis of the impact of investment in education on government incomes (federal and provincial taxes). This chapter allows us to allocate costs and benefits of investment in education among government and indivi-duals.
Finally in its fifth chapter, this thesis analyzes the redistributive effects of investment in educa-tion. It integrates the theory of income distribution in the analysis of investment in educaeduca-tion. The chapter measures the horizontal, vertical and reranking components of the redistributive effects of taxes and transfers due to investment in additional grade of education. As is known, in the short term, governments provide financial assistance to students from poorer families. In a long-term analysis, this chapter allows us to evaluate whether or not those who benefit from such financial assistance are the poorest ones.
The rest of the dissertation is organized as follows. Section 1 presents a literature review of models of investment in human capital. Section 2 presents chapter 2 which describes the methodology of calculating returns to education, the data, the empirical model, and summarizes the results of regressions. Section 3 concerns chapter 3 and reports social public and private returns to educa-tion as well as presents the impacts of public funding and tax systems on returns to educaeduca-tion. Chapter 4 analyzes the decomposition of gains from investment in education in Section 4. Chapter 5 investigates the redistributive effects of investment in education in Section 5. Finally, Section 6 concludes the dissertation.
Chapter 1
Literature Review
In the literature on investment in human capital, labor and education, economists are interested in measuring the return to investment in human capital. This literature has been extended since the pioneering work of Theodore W. Schultz in his publication Investment in Human Capital. In the following section, we present a survey of microeconomic models of investment in human capital and a summary of Canadian studies on return to education.
1.1
A survey of microeconomic models of investment in human capital
The microeconomic literature devoted to human capital was initiated by Schultz(1961) who de-fines human capital as the accumulation of factors that increase individual productivity and ear-nings. According to him, direct expenditures on education, health, internal migration and interna-tional immigration are forms of human capital investments. Earnings forgone in attending school or in acquiring on-the-job training by students and workers respectively are indirect costs of in-vestments. Taking these into account, Schultz(1961) finds that the paradoxes of the discrepancy between the growth of the economy and the growth of capital in the 1960s is due to the omission
analyzing the high correlation between education and earnings.
The literature on the causal effect of education on earning was initiated by Jacob Mincer. In his original model, Mincer(1958) uses a sample of individuals with identical abilities and opportu-nities who live in a perfect credit market environment and are only different in their occupations that differ in the amount of required schooling. Analyzing the age-earnings profile,Mincer(1958) shows that education has a multiplicative effect on earnings and the log earning function is not separable in education and age meaning that return to education is age-group specific (Lemieux
(2006)). The main contribution ofMincer(1958) is that he shows that the decision of an individual to work in an occupation that requires many years of education is motivated by a compensating wage differential. The trade-off is based on a comparison between the present value of profile of earnings (net of costs of investment) in different occupations. This finding explains why the model ofMincer(1958) is commonly referred to in the literature as "The Compensating Differences Model".
Becker(1964) models investment in education as an optimization problem where individuals exo-genously choose their level of education in order to maximize their life cycle earnings. In the mo-del, individuals who plan to invest in additional schooling compare their near-term direct and indirect costs with their present value of expected future benefits. The investment in education is worthwhile if the present value of benefits is higher than costs. There are two ways to assess this. The discount rate can be fixed and then one compares the present value of benefits to costs. This is the present value method. The second method, called internal rate of return method, consists of determining the value of the discount rate which makes the investment profitable.
Becker(1964) used only monetary costs and does not take into account psychological costs. Indeed, for many individuals, schooling is a tedious and unpleasant work that causes serious psychologi-cal suffering. Secondly, the Becker model ignores the non-monetary benefits of investment in edu-cation. For individuals, investment in education enlarges job opportunities and improves health. For the society, it generates positive externalities such as increasing civic participation, decreasing criminality and promoting technological innovation and incorporation. Finally,Becker(1964) does not take into account abilities, heterogeneity in individuals and endogeneity in decisions to invest in education.
ap-proximation of the dynamic human capital investment model ofBen-Porath(1967). In this model, potential earnings at any time depends on previous investments and investment at any time is a fraction of potential earnings. Assuming that the rate of return to training is constant across years of schooling and the rate of post school investment is a linearly declining function,Mincer(1974) models the log earnings as a linear function in years of schooling and a linear and quadratic func-tion in years of potential labor market experience. The model is relatively simple, fits micro data in a number of countries and is based on an investment in a human capital model. For these reasons, it is common for researchers to estimate returns to education. However, despite its large contri-bution to the literature, it is subjected to criticism such as those byLemieux(2006) andHeckman et al.(2008).
In his publication The The "Mincer Equation" Thirty Years after Schooling, Experience, and Earnings,
Lemieux(2006) points out several limitations of the model ofMincer(1974). First,Lemieux(2006) finds that the relationship between the logarithm of wage and the years of schooling is not linear, but log wage is an increasingly convex function of years of schooling according to US 1979-1981, 1989-1991, 1999-2001 Current Population Surveys (CPS) data. This finding is consistent with Min-cer (1996) andDeschenes (2001).Heckman et al.(2003) have also rejected the linearity between log earnings and years of schooling between 15 and 16 years of schooling. In other studies, Aak-vik et al. (2003),Belzil and Hansen(2002) find a strong nonlinearity in the relationship between wage and schooling. More recently, Heckman et al. (2008) have tested and rejected the linearity with US census data (1940-2000).Heckman et al.(2008) also report other evidence against linearity (Heckman et al.(1996) andHungerford and Solon(1987)).
A second criticism ofLemieux(2006) concerning the Mincerian equation is the quadratic function in years of labor market experience. Indeed, it understates earnings growth between 10 and 15 years of experience and overpredicts earnings decline after 25 years according to US data.Murphy and Welch(1990) find that the quadratic specification does not fit data while a quartic specification
Mincer (1974) assumes a separability between education and experience in log wages equation. This assumption ignores the positive correlation between education and experience, and then the positive effect of education on wage growth.Belzil(2007) finds that this assumption over-estimates returns to high-school by more than 15%.Lemieux(2006) also tests the separability by comparing college-high school wages gap profiles to the gap predicted by the Mincer equation. He concludes that the additive separability in years of schooling and potential experience does not fit 1979-1981, 1989-1991, 1999-2001 CPS data. This finding is consistent withDavid and Thomas(2001) and
Heckman et al.(2003) who reject the additive separability between log wage and education and experience and the parallelism of experience-earnings profiles as it is suggested inMincer(1974). In particular, Heckman et al.(2003) and Heckman et al.(2008) advocate a non-parametric speci-fication in the experience-earnings profiles relationship. Lemieux(2006) andDavid and Thomas
(2001) have addressed the problem by adding cohort effects. They conclude with an improvement in the fit of the model.
In a classical Mincerian equation, the coefficient of years of schooling is equal to the internal rate of return to schooling. However, in addition to previous criticisms, the model of Mincer does not take into account costs of schooling (tuition and additional fees) and taxes that are non-negligible nowadays. When taking into account these factors, the Mincerian rate of return which is in fact a marginal price of schooling in the labor market loses the interpretation as internal rate of return to schooling.Heckman et al.(2008) have tested the effect of accounting for tuition costs and find that this leads to a significant decline in returns to education. They also find a small impact of taxes on estimated returns.
Despite these limitations, many authors have analyzed returns to education with a Becker-Mincer model of comparison of age-earning profiles among school completion groups (e.g.Vaillancourt
(1995), Boudarbat et al. (2010), Burbidge et al. (2012)). These studies abstract from endogeneity in both schooling decision and post schooling accumulation of human capital. However, as said by many researchers such asGriliches(1977),Willis and Rosen(1979) andHeckman and Vytlacil
(1999), the schooling decision is endogenous and correlated to unobserved ability. Ignoring this fact leads to ability bias in measurement of the true causal effect of education on earnings.
and unobserved ability in Ordinary least square(OLS)used in the Mincer regression with instru-mental variables(IV). The literature of instrumental variables was initiated with the seminal work ofWright(1928). Researchers commonly use date of birth, changing in compulsory laws, distance to the nearest college or tuition as an instrument to correct for ability bias. Figure 1.1 presents a comparison between OLS returns and IVreturns estimated with different instruments. This figure shows that there is not a one-to-one relationship between both returns. In particular,Angrist and Krueger(1991) andLeigh and Ryan(2005) used date of birth as an instrument to correct for ability bias. The first authors find that the IV return is higher than the OLS return while the second au-thors find that the OLS return is higher than the IV return.Leigh and Ryan(2005) estimated the ability bias to be about 39%.
Figure 1.1 – Comparison between OLS and IV returns to education
0 .05 .1 .15
Year of birth Data on twins Compulsory schooling
Leigh and Ryan (2005) Angrist and Krueger (1991) Li et al. (2012) Ashenfelter and Rouse (1998) Miller et al. (2006) Angrist and Krueger (1991) Acemoglu and Angrist (2000) Aakvik et al. (2003)
thodology to estimate IV returns with United States and Norway data respectively. They find that IV returns are higher than OLS returns. This finding is consistent with the results ofOreopoulos
(2006) for United States, Canada and the United Kingdom. After re-analyzingOreopoulos(2006),
Devereux and Hart(2010) found much smaller IV returns for the United Kingdom. In Germany,
Pischke and Von Wachter (2008) show that there is no return to compulsory schooling laws for secondary school.
Several authors use data on twins and regression by difference with two equations for each twin to drop the effect of unobserved ability due to family background. Using this methodology, Ashen-felter and Rouse (1998), Ashenfelter and Krueger (1994), Behrman and Rosenzweig (1999) and
Isacsson(1999) find that IV returns are higher than OLS ones whileLi et al.(2012) found lower IV returns to schooling (about 2.7%) compared to OLS returns (about 8.4%) for China. In Australia,
Leigh and Ryan(2005) estimated an unobserved ability bias of about 10 to 28%. The limit of this approach is that a regression by difference in schooling is endogenous with respect to wages, but it is not random. The consequence is that IV estimates used to correct for error of measurement may exacerbate the effect of upward omitted ability bias in estimated education.
The IV literature is focused on addressing the problem of endogeneity in the schooling decision, and ignores the non-linearity of log earnings in schooling (seeAakvik et al.(2003) andBelzil and Hansen (2002)) in the Becker-Mincer model. In addition, several studies, such as Carneiro and Heckman (2002), have cast doubt on the validity of these instruments. Finally, the IV literature does not address the fact that the Becker-Mincer model is static and does not take into account risk and uncertainty. Its reduced form does not allow researchers to identify unobserved tasks for schooling (seeBelzil and Hansen(2002)) or to explain the wage dynamic in a changing economic environment.
In the second half of the 1970s, research in labor economics was interested in modeling behavior of schooling with structural models of endogenous schooling decisions. The first generation of these models was merged with the major contribution ofWillis and Rosen(1979). The model ofWillis and Rosen(1979) is based on the dynamic human capital investment model ofBen-Porath(1967), the adaptation of the self-selection models ofRoy(1951) to schooling and the introduction of eco-nometrics in a self-selection model (Heckman(1979)).Willis and Rosen(1979) model the schooling
decision in an environment of heterogeneity in abilities, in tastes and in capacity to finance invest-ment. The authors assume that individuals endogenously choose which level of skill (high school or college) to acquire in order to maximize lifetime earnings in the spirit of the compensating mo-del differences as perMincer(1958).Willis and Rosen(1979) find that college graduates experience better lifetime earnings in jobs requiring college than those who did not go to college.Willis and Rosen(1979) also find that high school graduates experience better outcomes in jobs requiring high school training than college graduates.
In the spirit ofWillis and Rosen(1979),Heckman et al.(2003) use a more general schooling choice model including taxes and tuition to explain the limits of the Mincerian return. However, both studies are critical due to the assumption on exogeneity in post schooling investment. This problem is addressed byKeane and Wolpin(1997) who estimate a discrete choice dynamic programming model, based on the model ofWillis and Rosen(1979). InKeane and Wolpin(1997), both schooling and post schooling investments are endogenous.Eckstein and Wolpin(1999),Keane and Wolpin
(2001) andBelzil and Hansen(2002) have used a dynamic programming model with endogeneity in education and experience. All these studies are based on partial equilibrium where skill price is exogenous.
The second generation of dynamic programming models are general equilibrium with an endoge-nous skill price that is determined by the market. These models have emerged with the pioneering work ofHeckman et al.(1998) that is based on a multi-skill environment.Heckman et al.(1998) used a model in which individuals take both schooling choice and post-schooling investment in skills and savings decisions. In this model, experience is not determined by the decision to work or not to work. Experience is determined endogenously by the quantity of time allocated to on-the-job activities by workers.Heckman et al. (1998) find that returns to schooling depend on the number of individuals who go to school, are age specific, and integrate the effect of education on training. These findings contrast with those of partial equilibrium models.Lee(2005) has
develo-that general equilibrium and partial equilibrium analysis of schooling are not significantly dif-ferent. More recently,Lee and Wolpin(2006) have developed and estimated a general equilibrium model of endogenous schooling, occupational and sectoral choices. This model is based on two sectors (goods and service) and three skills (white, pink and blue collar), for a six-sector environ-ment. The model predicts that there is not a singularly identical level of returns to schooling, but that returns are sector and occupation specific. In addition, returns are higher in the services sector than the goods sector.
Table1.1presents a summary of the pioneering works of different stage of the literature of invest-ment in education which has evolved considerably over the years. Dynamic general equilibrium models of endogenous schooling are the most completed frameworks to analyze the relationship between earnings and education and the effects of public policies on investment in schooling de-cisions. However, these models are too demanding on data and estimating techniques. In addi-tion, the structural dimension of these models cause some identification problems. Finally, in some cases, such asLee and Wolpin(2006), both partial and general equilibrium models lead to the same results.
Despite critics, the Becker-Mincer model remains a useful framework to analyze the relationship between earnings and education. In recent literature, many authors use this model when estima-ting returns to education. In the next section, we present several Canadian studies that attempt to estimate return to schooling.
Table 1.1 – Micro economic models of investment in human capital
Model Education Experience Heterogeneous Intertemporality Equilibrium skills
Mincer(1958) Endogenous None No Static Partial
Schultz(1961) Exogenous
Becker(1964) Exogenous Exogenous No Static Partial
Ben-Porath(1967) Endogenous Endogenous No Dynamic Partial
Mincer(1974) Exogenous Exogenous No Static Partial
Willis and Rosen(1979) Endogenous Exogenous Yes Static Partial
Heckman et al.(2003) Endogenous Exogenous Yes Static Partial
Keane and Wolpin(1997,2001) Endogenous Endogenous Yes Static Partial
Eckstein and Wolpin(1999) Endogenous Endogenous Yes Static Partial
Belzil and Hansen(2002) Endogenous Endogenous Yes Static Partial
Heckman et al.(1998) Endogenous Endogenous Yes Dynamic General
Lee(2005) Endogenous Endogenous Yes Dynamic General
Lee and Wolpin(2006) Endogenous Endogenous Yes Dynamic General
1.2
Summary of Canadian studies on returns to education
Investment in human capital is a crucial question in Canada, especially in an environment with persistently rising tuition and student debt. As consequence, both the Canadian government and citizens are becoming increasingly concerned about the costs and the expected gains from invest-ment in education. In this context, public and private returns to education appear as essential instruments for investment in education decision making for government and individuals respec-tively.
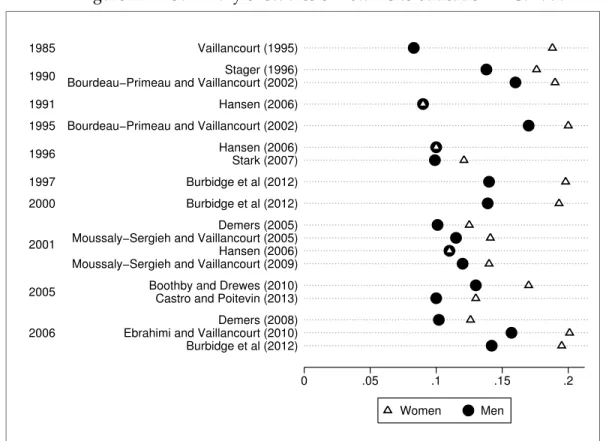
Since the early 1970s, a number of papers have attempted to estimate returns to education in Canada. Dodge and Stager(1972) andMehemet (1977) are commonly cited as pioneers of these studies. Most Canadian studies on returns to education have reported returns to education by pro-vince, gender and fields of study. As summarized in Table1.2, these studies show that returns to education vary across year with the lowest level of -10.0% in 1966 and the highest level of 22.0% in 1969. Authors who analyzed returns to education by fields of study find that individuals who hold degrees in humanities have the lowest return while those who hold health science degrees have the highest. As reported in Figure 1.2, Canadian studies indicate that women’s returns to education are higher than men’s returns to education.
Figure 1.2 – Summary of studies on returns to education in Canada 0 .05 .1 .15 .2 2006 2005 2001 2000 1997 1996 1995 1991 1990 1985 Burbidge et al (2012) Ebrahimi and Vaillancourt (2010) Demers (2008) Castro and Poitevin (2013) Boothby and Drewes (2010) Moussaly−Sergieh and Vaillancourt (2009) Hansen (2006) Moussaly−Sergieh and Vaillancourt (2005) Demers (2005) Burbidge et al (2012) Burbidge et al (2012) Stark (2007) Hansen (2006) Bourdeau−Primeau and Vaillancourt (2002) Hansen (2006) Bourdeau−Primeau and Vaillancourt (2002) Stager (1996) Vaillancourt (1995)
Women Men
Sources : Authors using recent studies on returns to education in Canada.
Notes : For each author, the first year is the study data collection year and the second year(in brackets) is the study publication year.
Canadian authors commonly used a Mincerian equation to estimate returns to education. Vaillan-court and Henriques(1986) andVaillancourt(1995), for example, used this methodology with Ca-nadian 1981 and 1986 census data to evaluate returns. In their models, age is used as a proxy of the number of years of working experiences. Vaillancourt and Henriques(1986) find that returns to education vary across provinces. According toVaillancourt(1995), private returns to a B.A. degree vary across fields of study and returns rose between 1980 and 1985. This last finding is consistent withStager(1996).
Collins and Davies(2002,2003) have developed a framework which takes into account the fiscal system (Canadian 1998 fiscal system) and loans to students (Canadian and Ontario students loan plans) in the measurement of returns to education. This allows them to measure and analyze the fiscal incentives or disincentives for human capital investment. They find that returns to
under-graduate studies are lower than those found in previous studies (Vaillancourt (1995) andStager
(1996)).
Demers(2005) used the average rate of tax associated to each level of income, private and public costs of education and Canadian 2001 census data to calculate private and public returns to edu-cation in Quebec. He finds that the private return is higher for women than men while the social return is higher for men than for women. In a more recent study,Demers(2008) uses a compilation of Fraser institute and Canadian 2006 census data to project net income profiles that are used when calculating returns and income gains. The gender-specific analysis ofDemers(2008) is consistent withDemers(2005). In both studies, Demers has used a sample of individuals aged from seventeen to eighty-five and he takes into account financial assistance when calculating returns. However, the author ignore the heterogeneity in tax and grant system across Canadian provinces as well as the cohort effect in the measurement of returns to education.
Using 1990, 1995 and 2000 databases from the National Graduates Survey(NGS),Hansen(2006) finds a significant earnings difference between trade school and college graduates and university graduates. This difference decreased between 1992 and 2002, by 7.5 percentage points for men and by 7.3 percentage points for women. To complement this analysis, the author investigates diffe-rences in returns to education between both groups of graduates. He uses Canadian 1991, 1996, and 2001 censuses data and tuition fees. He found that returns to a university degree rose between 1991 and 2001, from 9% to 11%. These returns are lower than those reported by a Mincer-type regression and vary across fields of study. However, Hansen(2006) has not integrated financial assistance to students and taxes in his study.
Stark(2007) uses data from the 20% sample of the Canadian 1996 census data to calculate returns to education in Canada by gender, level of education and detailed fields of study. In the study, net income profiles are predicted through federal and Ontario’s tax systems while financial assistance is ignored.Stark(2007) finds that returns to education decline with level of education. In addition,
teaching costs while they ignores financial assistance to students.
Several authors are interested in evaluating the effect of controlling for experience on returns to education.Boudarbat et al. (2010) for example finds that when controlling for experience, re-turns to education rise by 6 percentage points for university postgraduates between 1980 and 2005. For non-university postsecondary graduates, the increase is by 8 percentage points. Boo-thby and Drewes(2010) show that returns to university, college and trades education in Canada rose between 1980 and 2005. In both cases, authors do not take into account grant and taxes in the calculation of returns.
Using Canadian 2006 census data restricted to individuals with positive employment income and aged 17-63, Ebrahimi and Vaillancourt (2010) estimate and report private and social returns to education. The authors have predicted net income profiles using Quebec’s tax system, but they ignored financial assistance to students. They found that private and social returns to a B.A. degree vary across fields of study and gender. Unlike previous studies,Ebrahimi and Vaillancourt(2010) have estimated social gains from investment in education.
Burbidge et al. (2012) analyze the evolution of return to education in Canadian provinces with 1997, 2000 and 2006 census data. They use quantile regression to predict earning profiles. Ontario tax parameters are used in all provinces in order to define after-tax earning profiles. In the model, all students benefit from the average grant in Canada in 2000/2001. This means that there is not a heterogeneity of assistance to students among provinces. Their paper shows that private returns to master’s and PhD degrees decreased across years. In the same period, public returns to a master’s degree stayed stable while public returns to a PhD rose. Returns to education are higher for women than for men and the higher the level of education, the lower the return to education.
More recently,Castro and Poitevin(2013) find that returns to education vary between 10% and 11% for men and between 12% and 13% for women in Quebec. The methodology used in the paper differs from those used in previous studies. Indeed, when calculating returns to a B.A. degree,
Castro and Poitevin(2013) first calculate the ratio between the wage of an owner with a B.A. degree and the wage of a high school diploma owner. The return to education is determined by dividing the logarithm of the ratio by the number of years of a B.A. degree.Castro and Poitevin(2013) also propose a tuition scale and an optimal level of subsidies based on calculated returns. However,
their study does not take into account taxes and financial assistance to students.
Our review of recent literature shows that most Canadian studies on returns to education do not integrate grant and tax systems in measurement of returns. Those which do assumed that students benefit from the same assistance and pay the same taxes in all provinces. However, there is an important heterogeneity in tax and grant systems among Canadian provinces. For example, Que-bec’s grant system is more generous than Ontario’s. Indeed, the share of non-repayable grants in total assistance is higher in Quebec than in Ontario. In addition, Quebec’s tax system is more pro-gressive than Ontario’s tax system. Ignoring these two aspects can lead to important measurement errors. In Canada, the problem of funding of education is real. However, our review of literature shows that studies on investment in education do not address this question. In particular, research has barely paid attention to the sharing of costs and benefits from investment in education. The relevance of this dissertation is also to address this question. Finally, in contrast with previous stu-dies, this dissertation addresses the issue of the income redistribution in relation with investment in education and financial assistance to students.
T able 1.2 – Returns to education in selected Canadian studies Authors Y ear Pr ovinces Data of cost Financial assistance T axes Returns to of education to students included education (in %) Podoluk ( 1968 ) 1961 Canada Survey of stu-dents No No Private HS : 16.3 Univ : 19.7 Dodge and Stager ( 1972 ) 1966 Canada Survey of stu-dents No No Public. :-10.0 to 7.5 ;Pri-vate :-10.0 to 16.3 Cr ean ( 1972 ) 1961 T en pr o-vinces Y es No A verage tax Private :5.8 to 11.3 Mehemet ( 1977 ) 1961, 1969 and 1972 Canada Six lar gest Ca-nadian univer -sities. No No Private :14.0 in 1961, 22.0 in 1969 and 18.0 in 1972 Belanger and Lavallee ( 1980 ) 1979 Only Que-bec Statistics Ca-nada No No Private : 7.0 (Nursing) to 15.0 (Humanities) Cousineau ( 1984 ) 1979 Quebec city Y es No Estimated by regr ession Private : 10.3 to 14.0 ; T ot. :8.0 V aillancourt and Hen-riques ( 1986 ) 1981 Atlantic provinces, Qc, Ont, BC, Prairies Survey of Mi-nistry of Educa-tion No Simulated tax Private : 9.0 to 16.0 ; Pub :7.0 to 10.0 Cousineau and V aillan-court ( 1987 ) 1980 All pr o-vinces except PEI Y es No Simulated tax Private : 7.5 to 22.0 ; T ot. :3.2 to 13.7 V aillancourt ( 1995 ) 1985 Canada Statistics Ca-nada No Federal and Ont income tax rate Private M=8.3 W=18.8 ; Public M=4.3 W=8.4 Stager ( 1996 ) 1990 Ontario Statistic s Ca-nada No Federal and Ont income tax rate Private M=13.8 ; W=17.6 Total M=10.7 ; W=11.9 Sour ce : Our resear ch. Returns fr om Podoluk ( 1968 ) to Cousineau and V aillancourt ( 1987 ) come fr om V aillancourt ( 1995 ). M=Men, W=W omen, HS=High School, Univ=University , Qc=Quebec, Ont=Ontario, BC=British Columbia, PEI=Prince Edwar d Island
Y ear Pr ovinces Data of cost Financial assistance T axes Returns to of education to students included education (in %) ( 2005 ) 2001 Quebec MELS Y es A verage tax rate Priv : T=10.5 ; M=10.1 ; W=12.5 Pub : T=10.9 ; M=11.5 ; W=10.7 ( 2006 ) 1991, 1996 and 2001 W estern Canada, Ont., Qc, and Eastern Canada Statistics Ca-nada No No Private=9.0 in 1991, 10.0 in 1996 and 11.0 in 2001 ) 1996 Canada Statist ics Ca-nada No Federal and Ont income tax rate Private : 3.6 to 15.6 ( 2008 ) 2006 Quebec MELS Y es Y es, Fraser insti-tute Priv : T=10.6 ; M=10.2 ; W=12.6 Pub : T=8.5 ; M=8.7 ; W=8.4 gieh and ( 2009 ) 2001 Canada Statistics Ca-nada essentially No Y es, Statistics Canada Private : 12.0 to 14.0 and Dr ewes 2006 Canada No No No Private :9.0 in 1980 and 17.0 in 2005 and V aillan-) 2006 Quebec MELS and Sta-tistics Canada No Quebec’s tax Private :3.2 to 25.1 ;So-cial : 7.2 to 15.8 et al. ( 2012 ) 1997, 2000 and 2006 All pr o-vinces Statistics Ca-nada Y es, same value in all pr ovinces Federal perso-nal income return of Q50 : 1997, 2000, 2006 tax rates and Private return : Ontario tax rates M : 14.0 ; 13.9 and 14.2 W : 19.8 ; 19.3 and 19.5 Sour ce : Our resear ch. Returns fr om Podoluk ( 1968 ) to Cousineau and V aillancourt ( 1987 ) come fr om V aillancourt ( 1995 ). W=W omen, HS=High School, Univ=University , Qc=Quebec, Ont=Ontario, BC=British Columbia, PEI=Prince Edwar d Island
Authors Y ear Pr ovinces Data of cost Financial assistance T axes Returns to of education to students included education (in %) T otal return : M : 13.6 ; 13.9 and 14.1 W : 17.4 ; 18.0 and 18.2 Castr o and Poitevin ( 2013 ) 2005 Quebec No No No Private : 10.0 to 13.0 Sour ce : Our resear ch. Returns fr om Podoluk ( 1968 ) to Cousineau and V aillancourt ( 1987 ) come fr om V aillancourt ( 1995 ). M=Men, W=W omen, HS=High School, Univ=University , Qc=Quebec, Ont=Ontario, BC=British Columbia, PEI=Prince Edwar d Island
Chapter 2
Methodological Approach
2.1
Measuring returns to education
The return to education is defined as a result of a comparison of income profiles across school completion groups. Each individual has a finite horizon beginning at period 0 and ending after N periods1. At period 0, the agent chooses among two alternatives(k=0, 1). An alternative consists
of a level of education ekand a corresponding life cycle income profile (Pk = {Y0k, Y2k, ..., YNk}). Ytkis the income of the agent at the period t if the agent chooses the alternative k for his working life. In this study, income consists of employment income, grants, bursaries and loans.
2.1.1 Working with initial level of education (k
=
0)When choosing this alternative, the agent decides to enter directly into the workforce with his ini-tial level of education e0. At each period, his expected earning is equal to his employment income. It depends on the level of schooling e0 and the accumulated experience. The agent is assumed to keep the same level of education, e0, during his/her working life. In this case, the discounted present value of life cycle incomes can be written as :
2.1.2 Schooling more before working
(
k=
1)
In this case, the agent’s life cycle is divided into two periods : schooling (from t =0 to t=n) and working (from t=n+1 to t= N). During each year of schooling period, the agent’s level of edu-cation is e0. He/She earns Ys
t from summer employment income and pays direct costs of education (Tt). At the end of the period t = n, the agent’s level of education rises from e0to e1. He/She enters
the workforce and stays there during the next(N−n)periods until his/her retirement. His/Her new periodic expected income consists of his/her employment income(Yt1). The employment in-come at each period t =n+1, n+2, ..., N depends on the new level of education (e1) and the accumulated experience. Therefore, the discounted present value of life cycle incomes is given by :
V(1) = n
∑
t=0 Ys t (1+r)t − n∑
t=0 Tt (1+r)t + N∑
t=n+1 Y1 t (1+r)t (2.2)2.1.3 Financial assistance to students
During the schooling periods, the agent is entitled to grants and loans. Let Gt and Lt be the grant
and the loan during each of the n periods of schooling. After graduating, the agent is assumed to reimburse the loan during n0years. Let L be the total loan after graduating, i the annual interest
rate and n0the number of years of reimbursement. The annuity of the debt is :
R1t = L∗i
1−(1+1i)n0 (2.3)
where t=n+1, n+2, ...., n+n0.
The present value of total after-graduating debt (loan and interest) is derived as :
D= n+n0
∑
t=n+1 R1 t (1+r)t = L∗i[(1+r)n0 −1] r(1+r)n+n0[1− (1+i)−n0] (2.4)A= L∗i[(1+r) n0−1] r(1+r)n+n0[1− (1+i)−n0] | {z } (Total debt) − n
∑
t=0 Gt+Lt (1+r)t | {z }(Total grant and loan)
(2.5)
The net cost of financial assistance can be rewritten as :
A= L∗i[(1+r)n0 −1] r(1+r)n+n0[1− (1+i)−n0] | {z } (Total debt) − n
∑
t=0 Lt (1+r)t | {z } (Total loan) | {z } (Interest of loan) − n∑
t=0 Gt (1+r)t | {z } (Total grant) (2.6)The net cost of financial assistance can be negative or positive depending on the structure of the financial assistance which a student is entitled to. Students who come from a low income family are eligible to a high grant compared to their loan. Their net cost of financial assistance is negative. They benefit from the grant program. Those who come from a high income family receive a low grant comparing to their loan. Their net cost of financial assistance can be positive.
2.1.4 Rule of decision and return to education
The decision of an individual to further his/her education is based on the comparison of the two discounted present values of life cycle earnings. Let∆(r)be the gap between the two discounted present values. ∆(r) = n
∑
t=0 Ys t (1+r)t − n∑
t=0 Ts t (1+r)t + N∑
t=n+1 Y1 t (1+r)t − N∑
t=0 Y0 t (1+r)t (2.7)In this equation, the benefit is the expected income gain from the decision to improve the level of education. The cost of education includes both the periodic direct cost of schooling (flow of tuition and additional fees) and the indirect costs (flow of forgone income).
For an agent who benefits from the grant program to finance his/her education, the total cost includes the net cost of the financial assistance described above. His/Her arbitration equation is given by : ∆(r) = N
∑
t=n+1 Y1 t −Yt0 (1+r)t | {z } (Benefits(B)) − n∑
t=0 Y0 t −Yt1 (1+r)t | {z } (Indirect costs) + n∑
t=0 Tts (1+r)t | {z } (Direct costs) | {z } (Costs of education(C)) − L∗i[(1+r)n0−1] r(1+r)n+n0[1− (1+i)−n0] | {z } (Total debt(D)) − n∑
t=0 Lt (1+r)t | {z } (Total loan ) | {z } (Interest of loans(I) ) − n∑
t=0 Gt (1+r)t | {z } (Total grant ) | {z }(Costs of financial assistance(A))
(2.9)
Based on this gap between benefits and costs, the agent decides whether or not to study before entering in the workforce. His/Her rule of decision can be described as :
1. entering directly into the workforce with the initial level of education(e0)if B<C+A ;
2. entering into the workforce after completing the next higher grade(e1)if B>C+A ;
3. indifferent if B= C+A.
The private return to education of the agent is the discount rate, rp, that balances the monetary
benefits and costs of an investment over time. It is solution of the following equation :
∆(rp) =0 (2.10)
edu-chosen alternative. When the individual decides to further his/her education from e0to e1, the
go-vernment supports a public cost of education(Cts)during each schooling year. As presented above, during each schooling year, the government provides to the individual a non repayable grant(Gst)
and a repayable loan(Lst). For the government, the gap between the discount present value,∆(rg),
is given by : ∆G(r) =
∑
N t=n+1 I1t −It0 (1+r)t | {z } (Benefits) − n∑
t=0 It0−It1 (1+r)t | {z } (Indirect costs) + n∑
t=0 Cts (1+r)t | {z } (Direct costs) | {z } (Costs of education) − n∑
t=0 Gt (1+r)t | {z } (Grant provided) + n∑
t=0 Lt (1+r)t | {z }(Total loan provided ) | {z } (Financial assistance ) − L∗i[(1+r) n0 −1] r(1+r)n+n0[1− (1+i)−n0] | {z } (Reimbursement of loan) | {z }
(Net value of the financial assistance to student)
(2.11)
The public return to education is the discount rate, rg, that is solution of∆G(rg) = 0. rg balances
the monetary benefits and the costs of the government investment over time.
In the case of the social return to education rs, the calculation is based on the profile of gross
income (Γk = {Yk
g0, Yg1k , ..., YgNk }) and the social cost of the education. This cost is the summation of
private(Tts)and public (Cts)costs of education. The gap between the discount value is given by the following relation :
The social return to education rsis the value of the discount rate that balances the gap between the
social benefit and the social cost of investment in education. rsis solution of the equation :
∆S(r
s) =0 (2.13)
As presented, our methodology of calculation of the return to education consist in determining the discount rate that balances the present value of benefit and costs. This method is known in the literature as the internal rate of return method. An alternative approach that is not used in this study consists in fixing a discount rate and then compare the present value of benefits to costs. This approach is called the present value method.
In our approach, we implicitly assume a perfect capital market, an exogenous labor supply, a lack of uncertainty and nonpecuniary costs (or benefits) associated with schooling. Under these as-sumptions, on can use the separation theorem according to which an individual’s choice in human capital investment and preferences are independent. An interesting implication of this theorem is that the profitability of an investment is determining by the maximizing of the present of the investment. The methodological approach used in this study is based on this principle.
2.1.5 Nonpecuniary return to education
The measurement of returns to education presented above focused on the pecuniary returns to education. It ignores the nonpecuniary returns to education and the effect of externalities on social returns to education. Indeed, education well-equips individuals for better decision making concer-ning their health and nutrition and there is a spillover effect of better education of parents on their children education. Education also plays an important rule in the choice of spouse, family planning and the sexuality of teenagers. This decreases the probability of divorce and teenage pregnancy.
For a society, investment in an individual’s education may exert positive externalities in many domains including :
1. Increase in the productivity of the workforce through the positive externalities of a well-educated workers on the productivity their peers. This increase in the productivity may
ge-2. Knowledge spillover : Education may exert positive externalities on knowledge through peers effect and the spillover effect of better education of parents on their children educa-tion. At the macroeconomic level, the positive externalities of education consist in promoting discovery, adoption and improvement of new technologies. These externalities may generate economic growth (Aghion and Howitt(1997),Nelson and Phelps(1966)) as suggested in the literature by many studies that attributed economic growth to the increase in the quality of human capital through education (seePsacharopoulos(1984) andDaren(2007) for a survey on old and recent literature).
3. Improvement in social and civic participation : education may increase social engagement in many areas including volunteering, membership, voting and participation in a commu-nity association, promoting knowledge and participation in democratic political activities. A number of studies show that education plays a key rule in preserving democracy, promoting good governance, reducing corruption and protecting countries from coups.
4. Reduction in criminality and violence : education may contribute to the reduction of crimi-nality and violence through the promotion of better socialization, the reduction of the pro-bability of unemployment, the increase of potential incomes and the awareness and the im-plementation of activities in favour of young pupils and students to strengthen their know-ledge on the causes and consequences of violence, criminality and consumption of alcohol, tobacco and drugs.Lochner and Moretti(2004) show that education reduces criminality and the externalities related to this reduction range between 14% and 26% of the private return to education in United States during the period 1960-1980.
In this study, we ignore the nonpecuniary returns to education and the positive externalities of education. This means that we are likely to underestimate the social return to education in this work. In fact, our estimate of social return can be considered as a lower bound. In this study, private, public and social returns to education are calculated numerically. They are disaggregated by level of education, field of study, gender and by cohort of birth across provinces.