HAL Id: hal-00298770
https://hal.archives-ouvertes.fr/hal-00298770
Submitted on 19 Sep 2006HAL is a multi-disciplinary open access
archive for the deposit and dissemination of sci-entific research documents, whether they are pub-lished or not. The documents may come from teaching and research institutions in France or abroad, or from public or private research centers.
L’archive ouverte pluridisciplinaire HAL, est destinée au dépôt et à la diffusion de documents scientifiques de niveau recherche, publiés ou non, émanant des établissements d’enseignement et de recherche français ou étrangers, des laboratoires publics ou privés.
Hydrologic effects of land and water management in
North America and Asia: 1700?1992
I. Haddeland, T. Skaugen, D. P. Lettenmaier
To cite this version:
I. Haddeland, T. Skaugen, D. P. Lettenmaier. Hydrologic effects of land and water management in North America and Asia: 1700?1992. Hydrology and Earth System Sciences Discussions, European Geosciences Union, 2006, 3 (5), pp.2899-2922. �hal-00298770�
HESSD
3, 2899–2922, 2006Hydrologic effects of
land and water management I. Haddeland et al. Title Page Abstract Introduction Conclusions References Tables Figures J I J I Back Close
Full Screen / Esc
Printer-friendly Version Interactive Discussion
EGU Hydrol. Earth Syst. Sci. Discuss., 3, 2899–2922, 2006
www.hydrol-earth-syst-sci-discuss.net/3/2899/2006/ © Author(s) 2006. This work is licensed
under a Creative Commons License.
Hydrology and Earth System Sciences Discussions
Papers published in Hydrology and Earth System Sciences Discussions are under open-access review for the journal Hydrology and Earth System Sciences
Hydrologic e
ffects of land and water
management in North America and Asia:
1700–1992
I. Haddeland1,2, T. Skaugen1,2, and D. P. Lettenmaier3
1
Department of Geosciences, University of Oslo, Oslo, Norway
2
Norwegian Water Resources and Energy Directorate, Oslo, Norway
3
Department of Civil and Environmental Engineering, University of Washington, Seattle, USA Received: 28 July 2006 – Accepted: 11 September 2006 – Published: 19 September 2006 Correspondence to: I. Haddeland ([email protected])
HESSD
3, 2899–2922, 2006Hydrologic effects of
land and water management I. Haddeland et al. Title Page Abstract Introduction Conclusions References Tables Figures J I J I Back Close
Full Screen / Esc
Printer-friendly Version Interactive Discussion
EGU
Abstract
The hydrologic effects of land use changes, dams, and irrigation in North America and Asia over the past 300 years are studied using a macroscale hydrologic model. The simulation results indicate that the expansion of croplands over the last three centuries has resulted in 2.5 and 6 percent increases in annual runoff volumes for North America 5
and Asia, respectively, and that these increases in runoff to some extent have been compensated by increased evapotranspiration caused by irrigation practices. Aver-aged over the year and the continental scale, the accumulated anthropogenic impacts on surface water fluxes are hence relatively minor. However, for some regions within the continents human activities have altered hydrologic regimes profoundly. Reservoir 10
operations and irrigation practices in the western part of USA and Mexico have resulted in a 25 percent decrease in streamflow in June, and a 9 percent decrease in annual runoff volumes reaching the Pacific Ocean. In the area in South East Asia draining to the Pacific Ocean, land use changes have caused an increase in runoff volumes throughout the year, and the average annual increase in runoff is 12 percent.
15
1 Introduction
In ancient times some dams and aqueducts were built for irrigation and water sup-ply, but the impact of human activities on streamflow was minor. More recently, water management structures have become increasingly essential to provide water supply, as well as electric power, navigation, flood control, and other amenities for a growing 20
population. Dams, built for water storage, and water withdrawals, e.g. for irrigation pur-poses, directly change the dynamics of the water cycle, and humanity has extensively altered river systems through diversions and impoundments. In addition, surface water fluxes are indirectly influenced by land use changes, e.g. deforestation. Anthropogenic impacts have altered the natural water balance profoundly, at least at the local scale. 25
ex-HESSD
3, 2899–2922, 2006Hydrologic effects of
land and water management I. Haddeland et al. Title Page Abstract Introduction Conclusions References Tables Figures J I J I Back Close
Full Screen / Esc
Printer-friendly Version Interactive Discussion
EGU tensively that during parts of the year little or no water reaches the sea (Falkenmark
and Lannerstad, 2005), and the Aral and Caspian Seas have been reduced in extent because of water extractions for agriculture (V ¨or ¨osmarty and Sahagian, 2000).
According to Vitousek et al. (1997), humans have transformed more than one-third of the Earth’s land surface, mainly for the purpose of producing goods and services. 5
The expansion of croplands has resulted in a 20 percent reduction in forest cover since 1700 (Ramankutty and Foley, 1999). Both field experiments and modeling studies have shown that reduced forest cover in general increases streamflow and reduces evapo-transpiration (Sahin and Hall, 1996; Matheussen et al., 2000; Costa et al., 2003; Twine et al., 2004). According to FAOSTAT (available at http://faostat.fao.org/), a database 10
maintained by the Food and Agriculture Organization of the United Nations (FAO), 2.8×10⁶km2 land is currently (2003) equipped for irrigation globally; about twice the size of the area equipped for irrigation in 1961. Several modeling projects have studied the effects of irrigation on water balance components globally, e.g. D¨oll and Siebert (2002). Land use changes affect albedo and evapotranspiration, and the effects on cli-15
mate have received much attention, both on the local and the global scale, see Gibbard et al. (2005), Lobell et al. (2006), and references therein, but continental-scale hydro-logic analyses of the effect of land use changes are rare. Gordon et al. (2005) quan-tified changes in evapotranspiration due to deforestation and irrigation at the global scale, and concluded that the effects of irrigation on evapotranspiration are as impor-20
tant as the effects of deforestation.
In addition to land cover changes, humans have altered natural water cycles by build-ing dams, and the World Register of Large Dams (ICOLD, 2003) includes more than 33 000 dams (defined as being 15 m or higher). The volume of water that can be stored in reservoirs formed by large dams is about 6600 km3, or about 15 percent of annual 25
continental runoff (Postel et al., 1996). The effects of dams on the water balance can be profound, see e.g. V ¨or ¨osmarty et al. (1997), Nilssson et al. (2005), and Hanasaki et al. (2006). Haddeland et al. (2006b) studied the effects of dams and irrigation given current conditions, and found locally significant changes in the surface water fluxes.
HESSD
3, 2899–2922, 2006Hydrologic effects of
land and water management I. Haddeland et al. Title Page Abstract Introduction Conclusions References Tables Figures J I J I Back Close
Full Screen / Esc
Printer-friendly Version Interactive Discussion
EGU The purpose of this paper is to study the hydrologic effects of dams in comparison with
cropland expansion, and irrigation practices over the past 300 years for North America and Asia. 80 percent of the area equipped for irrigation globally (Siebert et al., 2005), and more than 70 percent of the world’s large dams (ICOLD, 2003) are located within these two continents.
5
2 Approach
2.1 Hydrology model
The Variable Infiltration Capacity (VIC) macroscale hydrology model (Liang et al., 1994) is a grid-based model that usually is implemented at spatial scales from one-eighth to two degrees latitude by longitude, and at hourly to daily temporal resolution. Each 10
grid cell is partitioned into multiple vegetation types, and the soil column is divided into multiple (typically three) soil layers. Evapotranspiration is calculated using the Penman-Monteith equation. The saturation excess mechanism, which produces surface runoff, is parameterized through the Xinanjiang variable infiltration curve (Zhao et al., 1980). Release of baseflow from the lowest soil layer is controlled through the non-linear Arno 15
recession curve (Todini, 1996). Surface runoff and baseflow for each cell are routed to the basin outlet through a channel network as described by Lohmann et al. (1998).
An irrigation scheme and a reservoir model were recently added to the VIC model (Haddeland et al., 2006a, b). The irrigation scheme extracts surface water locally, or, in periods of water scarcity, from reservoirs or any other prescribed point in the river basin. 20
The VIC model, like most land surface schemes, does not represent groundwater in a way suitable for modeling groundwater withdrawals, which hence is not taken into account in the model. Reservoir operations are based on information that can be found in the World Register of Dams (ICOLD, 2003), and georeferencing of the dams is obtained from V ¨or ¨osmarty et al. (1997, 2003). The reservoir model and irrigation 25
HESSD
3, 2899–2922, 2006Hydrologic effects of
land and water management I. Haddeland et al. Title Page Abstract Introduction Conclusions References Tables Figures J I J I Back Close
Full Screen / Esc
Printer-friendly Version Interactive Discussion
EGU 2.2 Study areas and input data
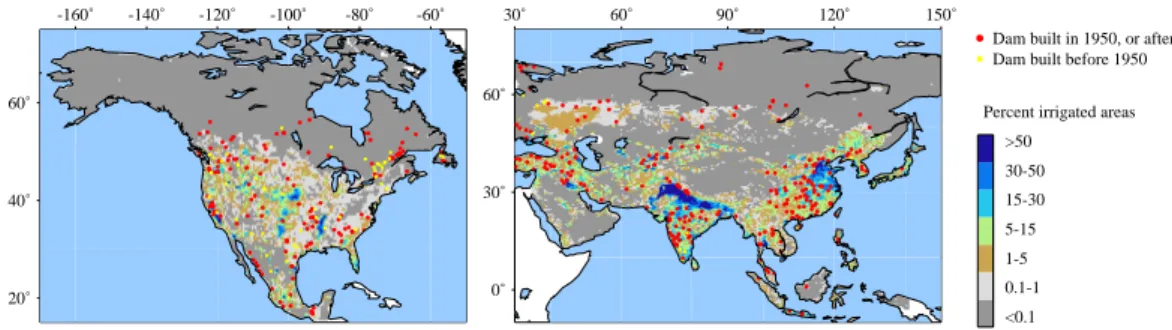
The regions studied include most of Asia (including parts of Eastern Europe), and North America (Mexico, USA, and Canada), see Fig. 1. These regions include some of the most heavily irrigated areas in the world, and account for about 80 percent of the areas equipped for irrigation globally (Siebert et al., 2005). In addition, about 70 per-5
cent of the dams registered in the World Register of Dams (ICOLD, 2003) are located in North America and Asia. Current land cover data (topography, vegetation, soil) and meteorological data are the same as described in Haddeland et al. (2006b). Poten-tial vegetation (the vegetation that would have existed absent anthropogenic effects, and absent certain disturbances like fires and pests) and data on historical cropland 10
cover were obtained from the SAGE database (available athttp://www.sage.wisc.edu). These datasets are described in Ramankutty and Foley (1999), and include potential vegetation at 5 min resolution, and cropland data (fraction within cell) at 0.5 degrees resolution for the period 1700–1992.
Data on irrigated areas were obtained from Siebert et al. (2005), see Fig. 1. In-15
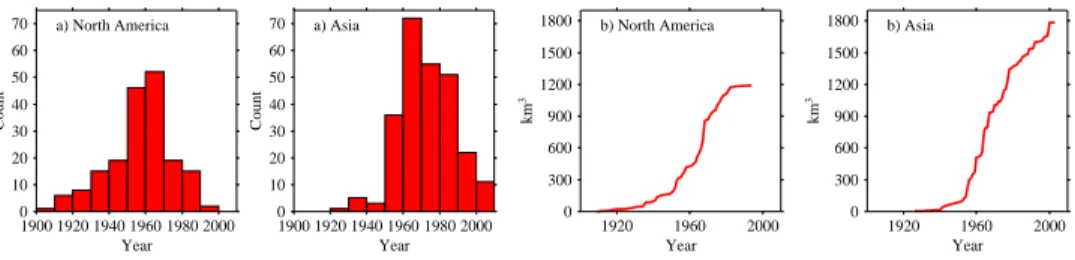
formation on areas equipped for irrigation within each country from 1961 up to now was obtained from FAOSTAT (available athttp://faostat.fao.org/), see Fig. 2. The dam dataset used in this study globally includes 668 dams, of which 183 (total storage ca-pacity: 1192 km3) are located in the North American region, and 257 (total storage capacity: 1782 km3) in the Asian region. Figure 3 shows the number of dams built 20
within each 10-year interval since 1900, and the accumulated storage capacity of the dams.
HESSD
3, 2899–2922, 2006Hydrologic effects of
land and water management I. Haddeland et al. Title Page Abstract Introduction Conclusions References Tables Figures J I J I Back Close
Full Screen / Esc
Printer-friendly Version Interactive Discussion
EGU
3 Model analyses
3.1 Vegetation scenarios
In order to study the changes in streamflow associated with land-cover changes, sev-eral vegetation images were constructed, representing the current (∼1992) and histor-ical (1700, 1900, and 1950) conditions. The vegetation images were inferred from the 5
current vegetation image, and Ramankutty and Foley’s (1999) potential vegetation and cropland datasets.
In Haddeland et al. (2006b), vegetation types were obtained from Hansen et al. (2000) combined with leaf area index (LAI) values based on Myneni et al. (1997), as described in Nijssen et al. (2001). The cropland dataset (Ramankutty and Foley, 1999) 10
includes larger areas of cropland in 1992 than Hansen et al.’s (2000) vegetation image. In order to make the comparisons between the current and historical simulations more consistent, the current vegetation image was slightly modified. That is, cropland areas in the current vegetation image were matched to the cropland areas of Ramankutty and Foley (1999). The modified current vegetation image thus has more cropland ar-15
eas than the original vegetation image; mainly on the expense of wooded grasslands and grasslands. If Ramankutty and Foley’s (1999) cropland dataset had cropland in a cell where the current vegetation image contains no cropland, LAI values for cropland were taken from adjacent cells and averaged. The original and modified vegetation images are shown in Fig. 4.
20
Ramankutty and Foley’s (1999) potential vegetation image is available at 5 min (1/12 degree) spatial resolution. These data were aggregated to 0.5 degrees spatial resolu-tion, where each resulting grid cell includes information on fraction of each vegetation type within the area covered by the 0.5 degree grid cell. Ramankutty and Foley (1999) classifies vegetation somewhat differently than does Hansen et al. (2000), and the 25
potential vegetation images was therefore matched to Hansen et al.’s (2000) classifica-tion scheme. LAI values for the potential vegetaclassifica-tion were thereafter inferred from the current vegetation image.
HESSD
3, 2899–2922, 2006Hydrologic effects of
land and water management I. Haddeland et al. Title Page Abstract Introduction Conclusions References Tables Figures J I J I Back Close
Full Screen / Esc
Printer-friendly Version Interactive Discussion
EGU Historical (1700–1950) vegetation images were constructed by adjusting cropland
area in the modified current vegetation image according to Ramankutty and Foley’s (1999) information on changes in cropland fraction within each 0.5 degree cell be-tween 1992 and the year of interest. Cropland areas were substituted with potential vegetation, or, in the case of a higher historical than current percentage cropland within 5
the cell, current vegetation types were replaced by cropland. Table 1 gives the amount of different vegetation types in the current and historical vegetation images, see also Fig. 4.
3.2 Irrigated areas
The global map of irrigated areas from Siebert et al. (2005) was used as the baseline 10
image of irrigated areas around the year 2000. FAOSTAT (available at http://faostat. fao.org) includes information on irrigated areas in each country for each year since 1961, see Fig. 2. For countries that were former a part of USSR, USSR information for the period 1961–1990 were used to estimate the change in irrigated areas within each country. For all countries, estimates for 1950 were obtained by extrapolating the 15
data for the period 1961–1970 (assuming a linear trend). No irrigation was included in the simulations for 1900 and before. The location of irrigated areas were somewhat adjusted, to make sure fraction irrigated area within each cell is less than, or equal to, cropland area given by Ramankutty and Foley (1999). However, changes in irrigated area within each country for each year were constrained to the FAOSTAT values. 20
3.3 Model simulations
Model simulations were performed for current (∼1992) and historical (1700, 1900, and 1950) conditions. For 1950 and 1992, simulations were performed both with and with-out the irrigation scheme and reservoir module implemented, which allows study of land use changes alone. For the simulations with the reservoir model included, only 25
simu-HESSD
3, 2899–2922, 2006Hydrologic effects of
land and water management I. Haddeland et al. Title Page Abstract Introduction Conclusions References Tables Figures J I J I Back Close
Full Screen / Esc
Printer-friendly Version Interactive Discussion
EGU lations, the same meteorological input data were used. Hence, the results should be
interpreted as indicating the predicted hydrologic response where the indicated land cover and water management scenarios to occur with the current climate (stated other-wise, the effects of possible climate change over the past 300 years is not considered).
4 Results and discussion
5
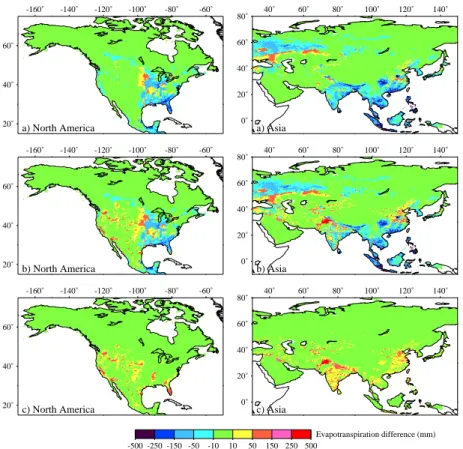
Figure 5 shows simulated mean annual evapotranspiration values within each 0.5 de-gree grid cell for current conditions, both with and without the reservoir and irrigation scheme implemented, compared to the historical (1700) values. Areas where current evapotranspiration values are different from the historical values to some extent reflect the vegetation changes shown in Fig. 4. Conversion of land area from forest or wood-10
land to cropland leads to decreased evapotranspiration and increased runoff, e.g. in Florida, in Russia north of ∼50 N, and in Eastern and South East Asia, see Fig. 5a). In these areas current LAI values are lower than historical LAI values (see Fig. 4), which in general leads to increased runoff (Sahin and Hall, 1996). In Russia south of ∼50N, which originally was dominated by grassland but is currently dominated by cropland, 15
the opposite trend is apparent, and current evapotranspiration values are higher than historical evapotranspiration values. When looking at Fig. 5c), it is apparent that the areas that are relatively most affected by irrigation practices are located in the USA, Pakistan, India, and China.
In the Mississippi River basin, simulated evapotranspiration has decreased in the 20
eastern part, which has been converted from forested areas to cropland, and increased in the western part, which has experienced conversion from grassland to cropland, see Fig. 5. Twine et al. (2004) studied the effects of land cover changes on the water balance of the Mississippi River basin, and found 10 percent decreases in mean annual evapotranspiration values over areas of former forest and savanna, and 15 percent 25
increase in mean annual evapotranspiration values over areas of former grasslands. In general, these trends are similar to the ones seen in Fig. 5a), which compares
HESSD
3, 2899–2922, 2006Hydrologic effects of
land and water management I. Haddeland et al. Title Page Abstract Introduction Conclusions References Tables Figures J I J I Back Close
Full Screen / Esc
Printer-friendly Version Interactive Discussion
EGU the historical situation to the current situation, without taking reservoirs and irrigation
practices into account.
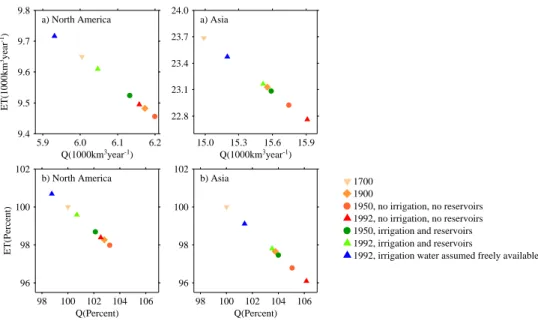
Total simulated current runoff values for the North American and Asian regions are 6050 and 15 500 km3year−1, respectively, while the corresponding numbers on evap-otranspiration are 9600 and 23 200 km3year−1. Water balance numbers for all simula-5
tions are presented in Fig. 6. The simulations are performed using the same 20-year period (1980–1999) of meteorological data, i.e. the simulation results are not affected by possible climate changes. Figure 6 indicates that land use changes in the Asian region on average have affected runoff and evapotranspiration more than in the North American region. The largest simulated increases in runoff values are about 3 percent 10
for North America, and about 6 percent for Asia. In Asia, the highest simulated total runoff is for current conditions without taking reservoirs and irrigation practices into ac-count, and land use changes have caused a gradual increase in runoff over the past 300 years. Simulated irrigation water requirements in Asia are about 70 percent of the simulated decrease in evapotranspiration caused by land use changes, whereas 15
simulated water use is about half this number. In North America, cropland mainly re-placed areas of forest and woodland between 1700 and 1900, resulting in an increase in runoff values. Between 1900 and 1950, the agricultural expansion in the Midwest-ern USA took place on the expense of grassland areas (see also Fig. 4), and runoff consequently decreased somewhat in these areas compared to the 1900 values. Else-20
where, e.g. in Florida, cropland areas replaced forested areas during the same 50-year period, and averaged over North America runoff increased between 1900 and 1950. After 1950, cropland expansion results in decreased runoff values. Simulated irriga-tion water requirements in North America are higher than the simulated increases in runoff values caused by land use changes. However, simulated current water uses are 25
similar to the simulated increases in runoff values caused by land use changes, and simulated current runoff and evapotranspiration are hence practically the same as the 1700 values.
HESSD
3, 2899–2922, 2006Hydrologic effects of
land and water management I. Haddeland et al. Title Page Abstract Introduction Conclusions References Tables Figures J I J I Back Close
Full Screen / Esc
Printer-friendly Version Interactive Discussion
EGU 3000 km3year−1, and that global irrigation water requirements are 2600 km3year−1,
but they do not report results by continent. It is, however, evident that the Gordon et al. (2005) numbers for North America and Asia are higher than the simulations pre-sented here. The irrigation water requirements prepre-sented in Fig. 6 are in reasonable agreement with the irrigation water requirements reported in FAO’s database AQUAS-5
TAT (http://www.fao.org/ag/agl/aglw/aquastat/main), see also Haddeland et al. (2006b). The Gordon et al. study (2005) reports substantial decreases in evapotranspiration caused by land use changes in Eastern China, decreases that are not as significant in this study. Differences in the vegetation images and models are most likely the main factors that lead to the discrepancies. The LAI values used for 1700 conditions (see 10
Fig. 4b), and method of calculating evapotranspiration in this study, might result in less evapotranspiration than the method used by Gordon et al. (2005).
Simulated mean monthly runoff for various continental areas to the ocean is shown in Fig. 7, which in addition shows runoff relationships between the simulation results. At the monthly level, the largest simulated differences between current (∼1992, reservoirs 15
and irrigation included) and historical (1700) conditions are observed in the early sum-mer in the North Asum-merican area draining to the Eastern Pacific south of 49 N (i.e. the western part of USA and Mexico), and in the winter in the areas draining to the West Atlantic, and the Arctic Ocean. In 1950, the largest changes from the 1700 conditions are in the area draining to the Eastern Pacific south of 49 N. The increasing number of 20
dams and extent of irrigated areas in the 1900’s in North America are obvious when looking at the graphs for 1900, 1950, and 1992. Figure 7 also indicates that the main impact of dams in Asia occurred after 1950, see also Fig. 1.
The effects of land use changes (i.e. the difference between simulations 1 and 4 in Fig. 7) are most noticeable in the North American area draining to the Gulf of Mexico, 25
and the Asian areas draining to the Pacific Ocean. These areas all experiences higher current than historical runoff, given no irrigation and no reservoirs. Figure 7i) indicates that reservoir and irrigation practices decreases runoff by about the same amount as decreased forest cover increases runoff in this area, whereas irrigation water use in
HESSD
3, 2899–2922, 2006Hydrologic effects of
land and water management I. Haddeland et al. Title Page Abstract Introduction Conclusions References Tables Figures J I J I Back Close
Full Screen / Esc
Printer-friendly Version Interactive Discussion
EGU South East Asia (Fig. 7h) does not balance the increase in runoff caused by decreased
forest cover, see also Fig. 6.
Figure 8 shows accumulated volume of freshwater reaching the oceans, and indi-cates that the area in North America draining to the Gulf of Mexico, and the area in South East Asia draining to the Western Pacific Ocean, are the two areas where an-5
nual runoff volumes have been most affected by land use changes, at least in a relative sense. For the area draining to the Gulf of Mexico, the simulation results for 1992 with-out the reservoir and irrigation model implemented, indicates an increase in runoff of 9 percent, compared to the simulation results for 1700. However, because of irrigation water use, the current simulated runoff with the reservoir and irrigation scheme imple-10
mented is only 3.5 percent higher than the 1700 results. In South East Asia (the area draining to the Pacific Ocean), the corresponding numbers are 12 and 11 percent.
The results presented here are dependent on the quality of the current and histor-ical vegetation images, and the method chosen when constructing these images will influence the results. It should also be kept in mind that the land use changes taken 15
into account in this study only include areas converted to cropland. As pointed out by Ramankutty and Foley (1999), other forms of land use changes can have important hydrological consequences. Also, the potential vegetation does not necessarily repre-sent the natural pre-agricultural vegetation, but instead reprerepre-sent vegetation that likely would exist today given no human activities or other disturbances, like fire (Ramankutty 20
and Foley, 1999).
Simulated irrigation water use is most likely somewhat underestimated, given that groundwater withdrawals are not included in the modeling scheme, see discussion in Haddeland et al. (2006a, b). Also, for the 1950 and 1992 simulations, the same vegetation image is used for the simulation where irrigation is taken into account, and 25
the simulation without irrigation. Wilting of plants is not taken into account in the model, which might have affected leaf are index somewhat in the simulations where irrigation is not taken into account. Both these factors would most likely have increased the difference between the two simulations performed for 1950 and 1992.
HESSD
3, 2899–2922, 2006Hydrologic effects of
land and water management I. Haddeland et al. Title Page Abstract Introduction Conclusions References Tables Figures J I J I Back Close
Full Screen / Esc
Printer-friendly Version Interactive Discussion
EGU
5 Conclusions
Simulation results indicate an increase in annual runoff between 1700 and 1992 caused by cropland expansions in North America and Asia of 2.5 and 6 percent, respectively. The runoff increases are caused by conversion of forest and woodland to cropland. In North America the agricultural expansion in the 20th century has replaced large 5
grassland areas, resulting in slightly lower runoff in 1992 than in 1950, considering the effect of land use changes alone. Irrigation increases evapotranspiration and de-creases runoff, and in North America irrigation water use to some extent cancels out the simulated increase in runoff caused by land use changes over the past 300 years. In the Asian region, simulated irrigation water requirements for current conditions are 10
slightly lower than the simulated increase in runoff caused by land use changes. How-ever, simulated irrigation water use is only about half the amount of irrigation water requirements.
The areas draining to the Arctic Ocean are, on average, insignificantly affected by land use changes and irrigation. However, dam construction has altered the stream-15
flow regimes somewhat in these areas, especially in March when simulated current streamflow is between 20 and 40 percent higher than simulated historical streamflow for the northern part of North America and Asia. On the basis of the total impact of land use changes, irrigation, and dams, the relatively largest changes in annual runoff vol-umes are simulated in the South East Asian area draining to the Pacific Ocean, where 20
simulated current annual runoff volumes are 11 percent lower than the simulated his-torical runoff volumes. The largest changes caused by land use changes alone are also simulated in the South East Asian area, where current simulated annual runoff is 12 percent higher than historical simulated runoff. Irrigation practices decreases an-nual runoff volumes the most in the area draining the western part of USA and Mexico, 25
where current simulated annual runoff volume with the irrigation and reservoir model implemented is 9 percent lower than current simulated annual runoff volume without the irrigation and reservoir model implemented. For the same area, the maximum monthly
HESSD
3, 2899–2922, 2006Hydrologic effects of
land and water management I. Haddeland et al. Title Page Abstract Introduction Conclusions References Tables Figures J I J I Back Close
Full Screen / Esc
Printer-friendly Version Interactive Discussion
EGU decrease in streamflow is 25 percent, and is caused by reservoir operations combined
with irrigation practices.
Acknowledgements. The first author acknowledges support by a University grant at the
Uni-versity of Oslo.
References
5
Costa, M. H., Botta, A., and Cardille, J. A.: Effects of large-scale changes in land cover on the
discharge of the Tocantins River, Southeastern Amazonia, J. Hydrol., 283, 206–217, 2003. D ¨oll, P. and Siebert, S.: Global modeling of irrigation water requirements, Wat. Resour. Res.,
38(4), 1037, doi:10.1029/2001WR000355, 2002.
Falkenmark, M. and Lannerstad, M.: Consumptive water use to feed humanity – curing a blind
10
spot, Hydrol. Earth Sys. Sci., 9, 15–28, 2005.
Gibbard, S., Caldeira K., Bala G., Phillips T.J., M. Wickett, M.: Climate effects of global land cover changes, Geophys. Res. Lett., 32, L23705, doi:10.1029/2005GL024550, 2005 Gordon, L. J., Steffen, W., J¨onsson, B. F., Folke C., Falkenmark, M., and Johannessen, ˚A.:
Human modification of global water vapor flows from the land surface, Proc. Natl. Acad. Sci.
15
USA, 102, 7612–7617, 2005.
Haddeland, I., Lettenmaier, D. P., and Skaugen, T.: Effects of irrigation on the water and energy balances of the Colorado and Mekong river basins, J. Hydrol., 324(1–4), 210–223, 2006a. Haddeland, I., Skaugen, T., and Lettenmaier, D. P.: Anthropogenic impacts on continental
surface water fluxes, Geophys. Res. Lett., 33, L08406, doi:10.1029/2006GL026047, 2006b.
20
Hanasaki, N., Kanae, S., and Oki, T.: A reservoir operation scheme for global river routing models, J. Hydrol.. 327(1–2), 22–41, 2006.
Hansen, M. C., DeFries, R. S., Townshend, J. R. G., and Sohlberg, R.: Global land cover classification at 1 km spatial resolution using a classification tree approach, Int. J. Remote Sens., 21(6–7), 1331–1364, 2000.
25
ICOLD (International Commission on Large Dams): World Register of Dams 2003, Paris, France, 340 pp, 2003.
Liang, X., Lettenmaier, D. P., Wood, E. F., and Burges, S. J.: A simple hydrologically based model of land surface water and energy fluxes for general circulation models, J. Geophys. Res., 99(D7), 14 415–14 428, 1994.
HESSD
3, 2899–2922, 2006Hydrologic effects of
land and water management I. Haddeland et al. Title Page Abstract Introduction Conclusions References Tables Figures J I J I Back Close
Full Screen / Esc
Printer-friendly Version Interactive Discussion
EGU
Lobell, D. B., Bala, G., and Duffy, P. B.: Biogeophysical impacts of cropland management changes on climate, Geophys. Res. Lett., 33, L06708, doi:10.1029/2005GL025492, 2006. Lohmann, D., Raschke, E., Nijssen, B., and Lettenmaier, D. P.: Regional scale hydrology: I.
Formulation of the VIC-2L model coupled to a routing model, Hydrol. Sci. J., 43(1), 131–141, 1998.
5
Matheussen, B., Kirschbaum, R. L., Goodman, I. A., O’Donnell, G. M., and Lettenmaier, D. P.:
Effects of land cover change on streamflow in the interior Columbia River Basin (USA and
Canada), Hydrol. Process., 14(5), 867–885, 2000.
Myneni, R. B., Nemani, R. R., and Running, S. W.: Estimation of global leaf area index and absorbed PAR using radiative transfer models, IEEE Trans. Geosci. Remote Sens., 35(6),
10
1380–1393, 1997.
Nijssen, B., Schnur, R., and Lettenmaier, D. P.: Global retrospective estimation of soil moisture using the Variable Infiltration Capacity land surface model, 1980–1993, J. Clim., 14, 1790– 1808, 2001.
Nilsson, C., Reidy, C. A., Dynesius, M., and Revenga, C.: Fragmentation and Flow Regulation
15
of the World’s Large River Systems, Science, 308, 405–408, 2005.
Postel, S. L., Daily, G. C., and Ehrlich, P. R.: Human appropriation of renewable freshwater, Science, 271, 785–788, 1996.
Ramankutty, N. and Foley, J. A.: Estimating historical changes in global land cover: Croplands from 1700 to 1992, Global Biogeochem. Cycles, 13(4), 997–1027, 1999.
20
Sahin, V. and Hall, M. J.: The effects of afforestation and deforestation on water yields, J.
Hydrol., 178, 293–309, 1996.
Siebert, S., D ¨oll, P., Feick, S., and Hoogeveen, J.: Global map of irrigated areas version 3.0 Johann Wolfgang Goethe University, Frankfurt am Main, Germany/Food and Agriculture Or-ganization of the United Nations, Rome, Italy, 2005
25
Todini, E.: The ARNO rainfall-runoff model, J. Hydrol. 175(1–4), 339–382, 1996.
Twine, T. E., Kucharik, C. J., and Foley, J. A.: Effects of land cover change on the energy and water balane of the Mississippi river basin, J. Hydrometeorol., 5(4), 640–655, 2004
Vitousek, P. M., Mooney, H. A., Lubchenco, J., and Melillo, J. M.: Human Domination of Earth’s Ecosystems, Science, 277, 494–499, 1997.
30
V ¨or ¨osmarty, C. J., Sharma, K., Fekete, B., Copeland, A. H., Holden, J., Marble, J., and Lough, J. A.: The storage and aging of continental runoff in large reservoir systems of the world, Ambio, 26, 210–219, 1997.
HESSD
3, 2899–2922, 2006Hydrologic effects of
land and water management I. Haddeland et al. Title Page Abstract Introduction Conclusions References Tables Figures J I J I Back Close
Full Screen / Esc
Printer-friendly Version Interactive Discussion
EGU
V ¨or ¨osmarty, C. J., Meybeck, M., Fekete, B., Sharma, K., Green, P., and Syvitksi, J.: Anthro-pogenic sediment retention: Major global impact from registered river impoundments, Global Planet. Change 39, 169–190, 2003.
V ¨or ¨osmarty, C. J. and Sahagian, D.: Anthropogenic disturbance of the terrestrial water cycle, Bioscience, 50(9), 735–765, 2000.
5
Zhao, R. J., Zhang, Y. L., Fang, L. R., Liu, X. R., and Zhang, Q. S.: The Xinanjiang model, in: Hydrological Forecasting: Proceedings of the Symposium on the Application of Recent Developments in Hydrological Forecasting to the Operation of Water Resource Systems, held at Oxford, IAHS no. 129, 351–356, 1980.
HESSD
3, 2899–2922, 2006Hydrologic effects of
land and water management I. Haddeland et al. Title Page Abstract Introduction Conclusions References Tables Figures J I J I Back Close
Full Screen / Esc
Printer-friendly Version Interactive Discussion
EGU
Table 1. Vegetation cover in study area (106km2), 1700–1992.
1700 1900 1950 1992
Forest 16.1 13.1 12.1 11.2
Woodland (includes wooded grassland) 17.9 16.5 15.8 15.8
Shrubland 15.5 15.2 14.9 14.6
Grassland 10.1 8.4 7.5 7.1
Bare soil 2.8 2.8 2.8 2.8
Cropland (irrigated) 2.4 (0) 8.4 (0) 11.2 (0.9) 12.6 (2.1)
HESSD
3, 2899–2922, 2006Hydrologic effects of
land and water management I. Haddeland et al. Title Page Abstract Introduction Conclusions References Tables Figures J I J I Back Close
Full Screen / Esc
Printer-friendly Version Interactive Discussion EGU -160˚ -140˚ -120˚ -100˚ -80˚ -60˚ 20˚ 40˚ 60˚ 30˚ 60˚ 90˚ 120˚ 150˚ 0˚ 30˚ 60˚ <0.1 0.1-1 1-5 5-15 15-30 30-50 >50
Percent irrigated areas Dam built before 1950 Dam built in 1950, or after
Fig. 1. The study areas, including the location of the dams taken into account in this study, and
HESSD
3, 2899–2922, 2006Hydrologic effects of
land and water management I. Haddeland et al. Title Page Abstract Introduction Conclusions References Tables Figures J I J I Back Close
Full Screen / Esc
Printer-friendly Version Interactive Discussion EGU 0.0 0.1 0.2 0.3 0.4 0.5 0.6 0.7 0.8 0.9 Area (10 6 km 2) 1960 1970 1980 1990 2000 Year 0 1960 1970 1980 1990 2000 Year 0 1960 1970 1980 1990 2000 Year 0 1960 1970 1980 1990 2000 Year 0 1960 1970 1980 1990 2000 Year 0 1960 1970 1980 1990 2000 Year 0 1960 1970 1980 1990 2000 Year 0 1960 1970 1980 1990 2000 Year
Southern Asia (Bangladesh, Bhutan, India, Maldives, Nepal, Pakistan, and Sri Lanka)
China India
North America (Canada, Mexico, and USA)
USA
Former area of USSR
Near East (Asian part, i.e. Afghanistan, Bahrain, Cyprus, Iran, Iraq, Israel, Jordan, Kuwait, Lebanon, Oman, Palestine, Qatar, Saudi Arabia, Syria, Turkey, United Arab Emirates, and Yemen.) East and Southeast Asia (Brunei, Myanmar, Cambodia, Indonesia, Laos, Malaysia, Philippines, Thailand, Vietnam, North Korea, South Korea, and Mongolia)
HESSD
3, 2899–2922, 2006Hydrologic effects of
land and water management I. Haddeland et al. Title Page Abstract Introduction Conclusions References Tables Figures J I J I Back Close
Full Screen / Esc
Printer-friendly Version Interactive Discussion EGU 0 10 20 30 40 50 60 70 Count 1900 1920 1940 1960 1980 2000 Year a) North America 0 10 20 30 40 50 60 70 Count 1900 1920 1940 1960 1980 2000 Year a) Asia 0 300 600 900 1200 1500 1800 km 3 1920 1960 2000 Year b) North America 0 300 600 900 1200 1500 1800 km 3 1920 1960 2000 Year b) Asia
Fig. 3. (a) Histogram of when the dams were built, and (b) Accumulated storage volume. Only
HESSD
3, 2899–2922, 2006Hydrologic effects of
land and water management I. Haddeland et al. Title Page Abstract Introduction Conclusions References Tables Figures J I J I Back Close
Full Screen / Esc
Printer-friendly Version Interactive Discussion EGU -150˚ -120˚ -90˚ -60˚ 30˚ 60˚ a1) 30˚ 60˚ 90˚ 120˚ 150˚ 0˚ 30˚ 60˚ a1) -150˚ -120˚ -90˚ -60˚ 30˚ 60˚ b1) 30˚ 60˚ 90˚ 120˚ 150˚ 0˚ 30˚ 60˚ b1) -150˚ -120˚ -90˚ -60˚ 30˚ 60˚ a2) 30˚ 60˚ 90˚ 120˚ 150˚ 0˚ 30˚ 60˚ a2) -150˚ -120˚ -90˚ -60˚ 30˚ 60˚ b2) 30˚ 60˚ 90˚ 120˚ 150˚ 0˚ 30˚ 60˚ b2) -150˚ -120˚ -90˚ -60˚ 30˚ 60˚ a3) 30˚ 60˚ 90˚ 120˚ 150˚ 0˚ 30˚ 60˚ a3) -150˚ -120˚ -90˚ -60˚ 30˚ 60˚ b3) 30˚ 60˚ 90˚ 120˚ 150˚ 0˚ 30˚ 60˚ b3) -150˚ -120˚ -90˚ -60˚ 30˚ 60˚ a4) 30˚ 60˚ 90˚ 120˚ 150˚ 0˚ 30˚ 60˚ a4) -150˚ -120˚ -90˚ -60˚ 30˚ 60˚ b4) 30˚ 60˚ 90˚ 120˚ 150˚ 0˚ 30˚ 60˚ b4) -150˚ -120˚ -90˚ -60˚ 30˚ 60˚ a5) 30˚ 60˚ 90˚ 120˚ 150˚ 0˚ 30˚ 60˚ a5) -150˚ -120˚ -90˚ -60˚ 30˚ 60˚ b5) 30˚ 60˚ 90˚ 120˚ 150˚ 0˚ 30˚ 60˚ b5) Evergreen Needleleaf Evergreen Broadleaf Deciduous Needleleaf Deciduous Broadleaf Mixed Cover Woodland Wooded Grasslands Closed Shrublands Open Shrublands Grasslands Cropland Bare soil/ice 0 1 2 3 4 5 LAI
Fig. 4. (a) Dominant vegetation type, and (b) mean annual leaf area index value within grid
HESSD
3, 2899–2922, 2006Hydrologic effects of
land and water management I. Haddeland et al. Title Page Abstract Introduction Conclusions References Tables Figures J I J I Back Close
Full Screen / Esc
Printer-friendly Version Interactive Discussion EGU -160˚ -140˚ -120˚ -100˚ -80˚ -60˚ 20˚ 40˚ 60˚ a) North America -160˚ -140˚ -120˚ -100˚ -80˚ -60˚ 20˚ 40˚ 60˚ b) North America -160˚ -140˚ -120˚ -100˚ -80˚ -60˚ 20˚ 40˚ 60˚ c) North America 40˚ 60˚ 80˚ 100˚ 120˚ 140˚ 0˚ 20˚ 40˚ 60˚ 80˚ a) Asia 40˚ 60˚ 80˚ 100˚ 120˚ 140˚ 0˚ 20˚ 40˚ 60˚ 80˚ b) Asia 40˚ 60˚ 80˚ 100˚ 120˚ 140˚ 0˚ 20˚ 40˚ 60˚ 80˚ c) Asia -500 -250 -150 -50 -10 10 50 150 250 500 Evapotranspiration difference (mm)
Fig. 5. Spatial effects on evapotranspiration. (a) The difference between current (1992)
simu-lation results, without irrigation and reservoirs, compared to historical (1700) simusimu-lation results.
(b) The difference between current (1992) simulation results, with irrigation and reservoirs,
compared to historical (1700) simulation results. (c) The difference between current (1992)
simulation results, with irrigation and reservoirs, and current (1992) simulation results, without irrigation and reservoirs. Notice the uneven legend intervals.
HESSD
3, 2899–2922, 2006Hydrologic effects of
land and water management I. Haddeland et al. Title Page Abstract Introduction Conclusions References Tables Figures J I J I Back Close
Full Screen / Esc
Printer-friendly Version Interactive Discussion EGU 9.4 9.5 9.6 9.7 9.8 ET(1000km 3year -1) 5.9 6.0 6.1 6.2 Q(1000km3year-1) a) North America 96 98 100 102 ET(Percent) 98 100 102 104 106 Q(Percent) b) North America 22.8 23.1 23.4 23.7 24.0 15.0 15.3 15.6 15.9 Q(1000km3year-1) a) Asia 96 98 100 102 98 100 102 104 106 Q(Percent) b) Asia 1700 1900 1950, no irrigation, no reservoirs 1992, no irrigation, no reservoirs 1950, irrigation and reservoirs 1992, irrigation and reservoirs
1992, irrigation water assumed freely available
Fig. 6. Water balance components (ET: Evapotranspiration, Q: Runoff) for all simulations. (a)
Mean annual values, and(b) Relative amount compared to the simulations for the year 1700.
HESSD
3, 2899–2922, 2006Hydrologic effects of
land and water management I. Haddeland et al. Title Page Abstract Introduction Conclusions References Tables Figures J I J I Back Close
Full Screen / Esc
Printer-friendly Version Interactive Discussion EGU 90 180 270 360 450 km 3month -1 90 180 270 360 450 90 180 270 360 450 a) American Arctic 0.8 1.0 1.2 1.4 fraction 0.81.0 1.2 1.4 0.8 1.0 1.2 1.4 J M M J S N 70 140 210 280 350 70 140 210 280 350 70 140 210 280 350 b) Eastern Pacific (N) 0.8 1.0 1.2 1.4 0.8 1.0 1.2 1.4 0.8 1.0 1.2 1.4 J M M J S N 15 30 45 60 75 15 30 45 60 75 15 30 45 60 75 c) Eastern Pacific (S) 0.8 1.0 1.2 1.4 0.8 1.0 1.2 1.4 0.8 1.0 1.2 1.4 J M M J S N 52 104 156 208 260 52 104 156 208 260 52 104 156 208 260 d) Western Atlantic 0.8 1.0 1.2 1.4 0.8 1.0 1.2 1.4 0.8 1.0 1.2 1.4 J M M J S N 24 48 72 96 120 24 48 72 96 120 24 48 72 96 120 e) Gulf of Mexico 0.8 1.0 1.2 1.4 0.8 1.0 1.2 1.4 0.8 1.0 1.2 1.4 J M M J S N 142 284 426 568 710 km 3month -1 142 284 426 568 710 142 284 426 568 710 f) Asian Arctic 0.8 1.0 1.2 1.4 fraction 0.81.0 1.2 1.4 0.8 1.0 1.2 1.4 J M M J S N 220 440 660 880 1100 220 440 660 880 1100 220 440 660 880 1100 g) Indian Ocean 0.8 1.0 1.2 1.4 0.8 1.0 1.2 1.4 0.8 1.0 1.2 1.4 J M M J S N 76 152 228 304 380 76 152 228 304 380 76 152 228 304 380 h) Western Pacific (S) 0.8 1.0 1.2 1.4 0.8 1.0 1.2 1.4 0.8 1.0 1.2 1.4 J M M J S N 66 132 198 264 330 66 132 198 264 330 66 132 198 264 330 i) Western Pacific (N) 0.8 1.0 1.2 1.4 0.8 1.0 1.2 1.4 0.8 1.0 1.2 1.4 J M M J S N 1) 1700: No reservoirs, no irrigation 2) 1950: Reservoirs and irrigation 3) 1992: Reservoirs and irrigation 4) 1992: No reservoirs, no irrigation
Fig. 7. Effects on freshwater fluxes reaching the oceans. (a) represents rivers draining
north-wards to the Arctic Ocean in the North American region (including Hudson Bay),(b) and (c)
represent rivers draining North America to the Pacific Ocean north and south of 49 N,
respec-tively. (d) represents rivers draining North America to the Atlantic Ocean, (e) represents rivers
draining to the Gulf of Mexico, (f) represents rivers draining northwards to the Arctic Ocean
in the Asian region,(g) represents rivers draining Asia to the Indian Ocean, and (h) and (i)
represent rivers draining Asia to the Pacific Ocean north and south of the Tropic of Cancer, respectively. The lower panels show the results of simulations 2, 3 and 4 divided by simulation 1.
HESSD
3, 2899–2922, 2006Hydrologic effects of
land and water management I. Haddeland et al. Title Page Abstract Introduction Conclusions References Tables Figures J I J I Back Close
Full Screen / Esc
Printer-friendly Version Interactive Discussion EGU 340 680 1020 1360 1700 km 3 340 680 1020 1360 1700 340 680 1020 1360 1700 a) American Arctic 1.0 1.2 fraction1.0 1.2 1.0 1.2 J M M J S N 320 640 960 1280 1600 320 640 960 1280 1600 320 640 960 1280 1600 b) Eastern Pacific (N) 1.0 1.2 1.0 1.2 1.0 1.2 J M M J S N 122 244 366 488 610 122 244 366 488 610 122 244 366 488 610 c) Eastern Pacific (S) 1.0 1.2 1.0 1.2 1.0 1.2 J M M J S N 280 560 840 1120 1400 280 560 840 1120 1400 280 560 840 1120 1400 d) West Atlantic 1.0 1.2 1.0 1.2 1.0 1.2 J M M J S N 220 440 660 880 1100 220 440 660 880 1100 220 440 660 880 1100 e) Gulf of Mexico 1.0 1.2 1.0 1.2 1.0 1.2 J M M J S N 480 960 1440 1920 2400 km 3 480 960 1440 1920 2400 480 960 1440 1920 2400 f) Asian Arctic 1.0 1.2 fraction1.0 1.2 1.0 1.2 J M M J S N 1180 2360 3540 4720 5900 1180 2360 3540 4720 5900 1180 2360 3540 4720 5900 g) Indian Ocean 1.0 1.2 1.0 1.2 1.0 1.2 J M M J S N 760 1520 2280 3040 3800 760 1520 2280 3040 3800 760 1520 2280 3040 3800 h) Western Pacific (S) 1.0 1.2 1.0 1.2 1.0 1.2 J M M J S N 440 880 1320 1760 2200 440 880 1320 1760 2200 440 880 1320 1760 2200 i) Western Pacific (N) 1.0 1.2 1.0 1.2 1.0 1.2 J M M J S N 1) 1700: No reservoirs, no irrigation 2) 1950: Reservoirs and irrigation 3) 1992: Reservoirs and irrigation 4) 1992: No reservoirs, no irrigation
Fig. 8. Accumulated volume freshwater reaching the oceans. (a) represents rivers draining
northwards to the Arctic Ocean in the North American region (including Hudson Bay),(b) and
(c) represent rivers draining North America to the Pacific Ocean north and south of 49 N,
re-spectively. (d) represents rivers draining North America to the Atlantic Ocean, (e) represents
rivers draining to the Gulf of Mexico, (f) represents rivers draining northwards to the Arctic
Ocean in the Asian region,(g) represents rivers draining Asia to the Indian Ocean, and (h) and
(i) represent rivers draining Asia to the Pacific Ocean north and south of the Tropic of Cancer,
respectively. The lower panels show the results of simulations 2, 3 and 4 divided by simulation 1.