HAL Id: hal-00001357
https://hal.archives-ouvertes.fr/hal-00001357v3
Preprint submitted on 15 May 2004HAL is a multi-disciplinary open access archive for the deposit and dissemination of sci-entific research documents, whether they are pub-lished or not. The documents may come from teaching and research institutions in France or abroad, or from public or private research centers.
L’archive ouverte pluridisciplinaire HAL, est destinée au dépôt et à la diffusion de documents scientifiques de niveau recherche, publiés ou non, émanant des établissements d’enseignement et de recherche français ou étrangers, des laboratoires publics ou privés.
Synchronising effect of planetary resonance
M.A. Vukcevic
To cite this version:
Synchronising effect of planetary resonance
M. A. Vukcevic, M.Sc
This article investigates and demonstrates the combined effect from two major planets at the centre of the Solar system. Gravitational and magnetic effects are considered as possible sources of solar activity synchronisation.
Dilemma posed by the scientist from JPL-NASA:
- The best method of predicting the sunspot cycle currently employed uses disturbances in the Earth's magnetic field during the previous solar cycle to predict the size of the next one.
Scientists don't know why previous solar activity is connected to the next active period, or why the Earth's reaction to that activity helps in solar cycle prediction. But the connection allows scientists to estimate what the next solar season will bring.1
- The Sun's magnetic field has a memory and returns to approximately the same configuration in each solar cycle. Current theories imply that the field is generated by random, which should exclude existence of long- term memory. Despite this the underlying magnetic structure
remains fixed at the same solar longitude the solar magnetic field varies in strength and direction, but not in longitude. The magnetic field lines tend to point out of one side of the Sun and point in on the other side (or hemisphere), reversing the pattern approximately every cycle.2 This is known as "preferred longitude" effect. Similar effect has been observed for the terrestrial magnetic field. Since the interiors of the Sun and stars are so different from the interior of a planet like the Earth, this correspondence is even more puzzling for the current understanding of the magnetic fields.
Solar activity variability
- Activity is higher in the second half of even-numbered solar cycles and in the first half of odd-numbered cycles. The reasons for this are still under discussion.
- Shortly before sunspot maximum. Larger amplitude in ring current (storm) activity than in sub-storm activity.
- About 2 years after sunspot maximum. Largest peak compound of transient and recurrent magnetic activity.
- Descending phase of the solar cycle. Largely recurrent, and seen with larger amplitude in sub-storm activity than in ring current (sub-storm) activity.
The answers as well as logical explanations to the above, might be provided by synchronising effect of the gravitational and magnetic forces on the solar periodic activity as described in the pages to follow.
1
NASA:Seasons of the Sun http://science.nasa.gov/newhome/headlines/ast22jul99_1.htm
2
Fig. 1
Planetary resonance as a source of the solar activity synchronisation
Two major planets, Jupiter and Saturn combined, contain 92% of the total planetary mass and 86% of the angular momentum. Their orbits are in a near resonance with orbital period ratio of 5:2. Gravitational resonance among individual planets has been discussed, in greater detail elsewhere. Although the planets' gravitational forces at the centre of the Solar system are small, the mass of the major planets, in particular that of Jupiter and Saturn, are still sufficiently large to have a significant effect, as the solar orbit around the barycentre confirms with its outline shown in Fig.1. The shaded area represents the position of the Sun's disk in the year 2004, with its displacement from the barycentre. While planetary orbits are elliptical, the solar orbit has the rather complex shape of a loop within a loop. From the diagram in Fig.1 it can be observed that during two of Jupiter's orbits of just under 24 years (eg.1996-2020), the Sun will complete one major and one minor loop, which together form one solar orbital period.
This 'solar wobble' is a result of the combined planetary gravitational forces. There is possibility of significant and variable (over two loops) orbital solar axis precession. In case of a planet the ratio of the planet's radius and its orbit radius is extremely small, the resulting gyroscopic effect of the planet's rotation enables it to keep the rotation axis inclination to its orbit relatively constant. Since the Sun's radius and its orbit's radius have values of the same order, the result is certain amount of its axis precession along the orbital path. Also, the planets gravitational forces on the Sun act at an angle to the solar equatorial plane adding to its axis precession.
The solar activity is a result of massive and continuous nuclear reactions with strong magnetic properties. The complexities of the forces active within the solar interior have prevented formulation of an elegant scientific theory describing the process. The possibility of influence from planetary magnetic forces should also be considered. Beside the Sun itself (which has alternating magnetic field polarity), by far the strongest sources of 'permanent' magnetic field within the solar system are planets Jupiter and Saturn.
The inner core of these planets is comprised of metallic hydrogen under a huge pressure. Under these conditions the hydrogen becomes super-conductive. Due to their relatively high rate of rotation in relation to their circumference, and given the super-conductive core, enormous currents are generated, which in turn create extremely strong magnetic fields. Some of this energy will be released as heath from layers of lower conductivity (Jupiter in particular has a positive heath coefficient).
Jupiter's magnetosphere extends well beyond Saturn's orbit. If it were not for the presence of the solar field itself, Jupiter's magnetosphere would reach the centre of the Solar system. Saturn also has a large magnetosphere, approximately about one-fifth of Jupiter's. There is likelihood that the solar dynamo is affected (either directly or through a reverse feedback) by Jupiter's and combined Jupiter-Saturn magnetic fields. The resultant of these two fields is an 'magnetic channel' acting as a 'conduit' for formation of the solar current sheet. In turn the solar current sheet generates its own much stronger magnetic field carried by the solar wind, while its periodic variability properties are defined by the initialisation within the 'magnetic channel'.
It is understood that solar axis is perpendicular to direction of the sunspot trajectory. This is may not necessarily the case, since sunspots are visible at the photosphere gas layer, the imaginary surface from which the solar light that we see appears to be emitted. Therefore, it is possible that sunspots trajectory is not exactly perpendicular to the axis of rotation, but it is somewhat deflected by the feedback effect of the 'conduit channel'. This means that the true solar latitude of a particular sunspot changes during its lifetime, therefore the true solar axis precession over one solar orbital period (of 2 loops) is not necessarily optically perceptible.
In order to assess the combined effect at the centre of the Solar system the two main factors to consider are:
- Jupiter's variable influence over one solar orbital period (consisting of one major and one minor loop as described above and equalling two Jupiter sidereal periods).
- Saturn's variable influence over Jupiter-Saturn synodic period, taking note of an angularity shift of 2400 (2π/3) for the subsequent conjunctions.
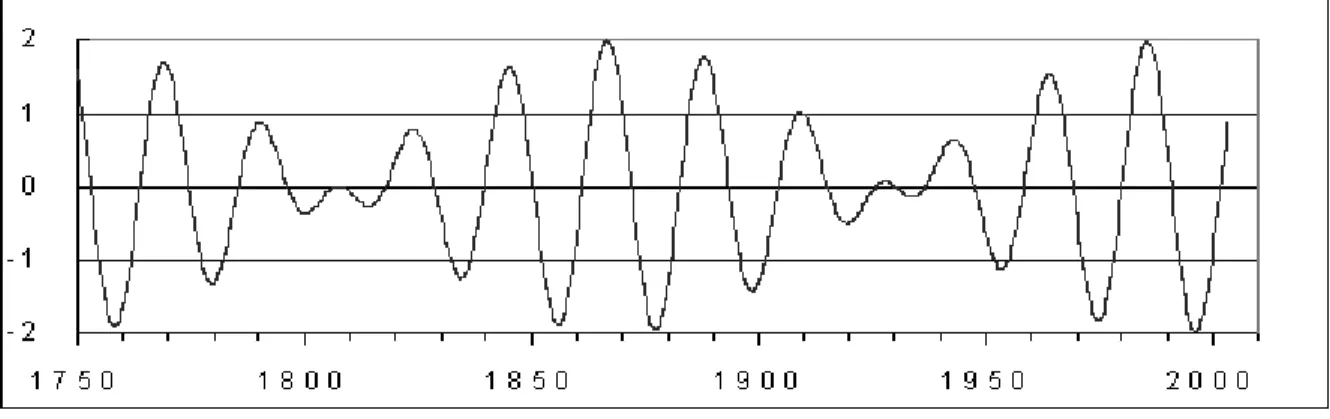
Both variables (gravitational forces and magnetic field) are complex functions, but for the purpose of this analysis an idealised case is considered, simple periodic functions are assumed. The sum of two variables (with unity weighting) can be represented in a simple numerical form:
Y = Cos (2π/3 + 2π t/2PJ) + Cos (2π t/ PJ/S)
- PJ = 11.862 years, i.e. Jupiter sidereal orbit period
- PJ/S = 19.86 years i.e. Jupiter- Saturn synodic period
Graphic representation of the equation for the last 250-year period is shown in Fig. 2.
Fig. 2
In considering solar activity it could be said that it displays short-term randomness as well as a certain, however imperfect, longer-term periodicity. The solar periodic activity is described by the Hale cycle and represented by the sunspot number. Change of magnetic
4
polarity during Hale cycle is most likely due to change in the angle of precession of the solar axis and its relationship to the 'magnetic depression', favouring one or the other solar hemisphere over period of the two loops making one solar orbital period.
The significance of the above equation becomes obvious in a somewhat modified form: Y = A abs [Cos (2π/3 + 2π (t-T0)/ 2PJ + Cos 2π (t-T0)/ PJ/S]
The absolute value is plotted against the numeric values of the existing sunspot records for the period 1750-2003 as shown in Fig.3.
Fig. 3
- A = 100 - arbitrary constant used to normalise values in the diagram
- T0 = 1941 – empirically chosen constant for the best coincidence, significance of which might
be explained by further research. Prior to 1813 a 900 phase shift is required ( 'Sin' instead of 'Cos' functions). Numerical data are available from: World Data Center for the Sunspot Index3
To reproduce the above diagram the following MS-Excel entry can be used:
=100*ABS(COS(2*PI()*(Ax-1941)/19.859)+COS(2*PI()/3+2*PI()*(Ax-1941)/23.724)). where Ax is the A column filed containing the incremental year number.
The diagram in Fig. 3 represents remarkable correlation between the resonance of the two major planets and the solar periodic activity. The extent of the agreement is such that there is high degree of probability of the above events being inter-related. The purists might expect a full coincidence between two waveforms, however other factors should be born in mind. The simple periodic function employed assumes an idealised case.
It should be noted that the above is an attempt to demonstrate correlation in periodicity only. Although both components of the equation are given unity weighting, it is remarkable that even amplitude envelopes show similar tendency. It is possible that much closer mathematical approximation could be obtained by considering further components using the above equation in its more general form: Y = ΣCos 2π (t-T0)/P
It appears that there is a resonant system in operation within the solar activity, the imperfection of which is demonstrated by the irregularity of its response. This in turn means that it should have a rich spectrum of sub-harmonics and higher harmonics. In this article attention will be focused on the sub-harmonics.
There is a certain amount of justifiable scepticism about using sub-harmonics. These are not necessarily just products of beating between two or more frequencies. It could be
considered that a sub-harmonic represents not only a mathematical factor, but it has a physical reality as a block or even a combination of oscillations that make-up a specific much longer cycle with distinct properties of its own.
Examining sub-harmonics of the higher order, for the above-mentioned frequencies, produces further evidence of possible existence of a multi resonant system. Multiples and sums of two periods used previously, give a number of sub-harmonics with periods that average at around 96.5 and 118 years, (P1 and P2 respectively). With these parameters and T0 as above
the equation:
Y = abs [Cos 2π (t-T0)/P1 + Cos 2π ( t-T0)/P2 ]
has a following graphic representation:
Fig. 4
The graph depicts anomalies within solar periodic activity with an immediately recognisable minimum between 1650-1700, coinciding with the Maunder Minimum. Further relevant dates are at or near the equation’s zero value:
1809 - Dalton minimum;
1913 - another minimum but not so pronounced;
1860 and 1969 are the years of two cycles with suppressed amplitudes, 30% - 50% lower than in the neighbouring peaks, (see Fig.1.).
MS-Excel entry is: =ABS(COS(2*PI()*(Ax-1941)/96.5)+COS(2*PI()*(Ax-1941)/118))
Further calculations (using longer-term sub-harmonics) indicate existence of the prolonged periods of very low activity.
An approximation for the overall amplitude's envelope, for the period 1800-2000, can be obtained by using sub-harmonics with periods of: P1 = 118 (as above) and P2 = 3 x 96.5 = 289.5 years and again T0 = 1941. The equation is:
Y= A [B + Cos (3π /2 + 2π (t-T0)/P1 + 0.5Cos 2π (t-T0)/P2]
Where A=60 and B=2 are the normalising coefficients.
6
Fig. 5
The deviations for the cycles around the years 1860 and 1970 are explained beforehand. Therefore, only one cycle (with maximum in 1885) is significantly out. For the period prior to 1800 correlation fails.
For MS-Excel enter: =60*(2+COS(3*PI()/2+2*PI()*(Ax-1941)/118)+0.5*COS(2*PI()*(Ax-1941)/289.5))
It is not suggested here, that the two major planets are cause of the solar activity. However, there is a strong probability that the planetary resonance is a synchronising factor of an existing otherwise random activity, driving mechanism being a combined product of both gravitational and magnetic forces. If that is so, then without presence of these forces and their 'calming' effect on the solar activity (with a minima every 11 years or so), the result of a permanently high activity would be excessive and harmful radiation, endangering existence of the Earth's biosphere. Alternatively somewhat different alignment of the gravitational and magnetic forces would result in total secession of sunspot activity causing significant cooling and eventually permanent freezing of the Earth's surface.
Strong correlation between the solar radiation and the Earth's climatic changes has inspired a number of ideas for the transfer mechanism. The most recent theory suggests interaction between the elementary particles produced by radiation and the upper atmosphere affecting cloud formation.
An additional contributing factor could be the irradiation of the oceans' surface bio-mass. The rise in global temperature is always accompanied by rise in the CO2 concentration. The transfer mechanism may be as follows:
Increased solar activity results in an increase of harmful radiation, reducing bio-mass of oceans' surface plankton trough process of sterilisation by irradiation. Result of this is reduced uptake of CO2 from the atmosphere and rising in the 'green-house' effect, finally increasing the global temperature. Reverse process takes place during reductions in the solar activity.
Value of inequality Jupiter-Saturn (so called Laplace's period) is calculated from Bretagnon data (J=11.861983, S=29.457158) gives: I = (J/2,S/5) = 883.3 years. Diagram in Fig. 6. shows the 880-year global temperature cycle, which coincides with the 880-year Sun's revolutions cycle around the Solar system's barycentre.
It is thought that the Ice ages occur due to a long-term angle variation in the precession of the Earth's axis. This angular variation is + and - 10 or so,does not appear sufficiently large enough to decrease amount of the solar energy impacting onto the Earth's northern hemisphere to plunge it into an Ice age. Some scientists have calculated that the temperature variation due to eccentricity of the Earth's orbit is about 50 times less than that necessary to cool the planet into a glacial epoch. There is also evidence that Ice ages have occurred simultaneously in the both hemispheres, which the Earth's precession theory does not support. The evidence collected over last 10-15 years demonstrates that glaciers in the Southern Hemisphere changed in sync with Northern Hemisphere glaciers. This happened on three different time scales: the end of the last major Ice Age (14-15,000 years ago), a period of abrupt climate change known as the Younger Dryas cold reversal (10-11,000 years ago) and the Little Ice Age which lasted from the 15th to the 18th centuries. The fall in global temperature sufficient enough to trigger onset of an Ice Age could be result of the existence of the prolonged periods of very low solar activity, as demonstrated in previous calculations.
References:
NASA:Seasons of the Sun
http://science.nasa.gov/newhome/headlines/ast22jul99_1.htm
MEDIA RELATIONS OFFICE; February 1, 2000
http://www.jpl.nasa.gov/releases/2000/sunmagfield.html
Barycenter - NASA website:
http://spaceplace.jpl.nasa.gov/barycntr.htm
RWC Belgium, World Data Center for the Sunspot Index:
http://sidc.oma.be/index.php3
Evidence of multiresonant system, Vukcevic M.A.
http://arxiv.org/ftp/astro-ph/papers/0401/0401107.pdf
The author is physics postgraduate (M.Sc) from London University, United Kingdom.