HAL Id: halshs-01169516
https://halshs.archives-ouvertes.fr/halshs-01169516
Submitted on 29 Jun 2015
HAL is a multi-disciplinary open access archive for the deposit and dissemination of sci-entific research documents, whether they are pub-lished or not. The documents may come from
L’archive ouverte pluridisciplinaire HAL, est destinée au dépôt et à la diffusion de documents scientifiques de niveau recherche, publiés ou non, émanant des établissements d’enseignement et de
Coupling direction of the European Banking and
Insurance sectors using inter-system recurrence networks
Peter Martey Addo
To cite this version:
Peter Martey Addo. Coupling direction of the European Banking and Insurance sectors using inter-system recurrence networks. 2015. �halshs-01169516�
Documents de Travail du
Centre d’Economie de la Sorbonne
Coupling direction of the European Banking and Insurance sectors using inter-system
recurrence networks
Peter Martey ADDO
Coupling direction of the European Banking and
Insurance sectors using inter-system recurrence networks
*
Preliminary and Incomplete. Please do not QUOTE.*
Peter Martey ADDOa,b,∗
aCentre National de la Recherche Scientifique (CNRS), France
bCentre d’ ´Economie de la Sorbonne (CES) - CNRS : UMR8174 - Universit´e Paris I
-Panth´eon Sorbonne, France
Abstract
Modern financial systems exhibit a high degree of interdependence making it difficult in predicting. This has raise concerns on the correct identification of coupling direction in financial sectors of the economy. This study explores a “two–way” risk connection between the European banking and insurance sector based on geometrical closeness of observations. Specifically, the study looks at the inter-system recurrence networks in tracing dynamical transi-tions and detecting coupling direction between these sectors. The overall results shows that the banking sector is central in risk transmission com-pared to the insurance sector. A comprehensive discussion of the feasibility and relevance of the approach in studying systemic risk is provided.
Keywords: Financial institutions, Recurrence networks, Systemic risk,
Recurrence plots
∗The author gratefully acknowledge funding from the European Union’s Seventh
Framework Programme (FP7-SSH/20072013) for research, technological development and demonstration under grant agreement no320270 (SYRTO).
JEL: C40, E50, G01, G20
1. Introduction
The threat of systemic risk to the financial system has drawn attention to research on uncovering dependencies among financial sectors, institutions, and economic regions/cross-borders (Hartmann et al. (2005); Cummins and Weiss (2014)). Large bank failures and insurer distress due to the recent global financial crisis have raise concerns on the proper identification of cou-pling direction between the banking and insurance sectors. Identifying sys-temic linkages through the financial sectors of the economy is relevant in understanding risk transmissions to enhance policymaking. The convergence of financial activities in the banking and insurance sectors has raised macro-prudential concerns on the interconnectedness and systemic dependencies between these sectors to enhance proper monitoring. In other words, the identification of sources of systemic risk is of crucial importance to regula-tors for proper control.
Recent works documented in literature on systemic dependencies include Billio et al. (2012); Slijkerman et al. (2013); Cummins and Weiss (2014), among others. Most of the approaches are focused on quantification of tem-poral interrelationships of observations such as correlation methods, condi-tional mutual information methods (Addo et al. (2015)), and autoregressive models. The question that arises is whether structural characterisation based on geometrical closeness of observations provide insights to uncovering tran-sitions and causal interdependencies. In this work, we consider the inter-system recurrence networks based on geometrical considerations to analyse
systemic dependence in the financial sector.
The study examines systemic dependence between bank and insurance sectors of the financial sector to uncover the sector that poses a higher sys-temic threat to financial stability. We investigate these risk transmission considering the period prior to the global financial crisis, during the crisis, and post-crisis period. In particular, we study how these risk transmissions change over time and under different economic conditions. Uncovering cou-pling direction between these sectors is very relevant for the introduction of some regulatory measures to enhance financial stability. We claim that the identification of such coupling direction is crucial in identifying sources of instabilities or potential risks in the financial system. Overall, our findings points that risk transmissions have mainly been from the banking sector to the insurance sector and not the vice versa. To the best of our knowledge, this work marks the first application of inter-system recurrence networks in economics and finance.
The structure of the remainder of this paper is as follows. Section 2.1 presents a description of the considered datasets used in studying the cou-pling direction. Section 2.2 presents an overview of inter-system recurrence networks and it’s associated complex network measures useful in studying nonlinear dynamics of underlying time series data. Section 2.3 provides in-formation on available programming packages for the implementation of the method. The empirical application of the method to studying the dynamics and coupling direction prior and during the global financial crisis and the European Sovereign debt crisis is then provided. Finally, in Section 3, we discuss the results and provide concluding remarks on the advantages of this
approach in the area of economics and finance.
2. Data & Method 2.1. Data description
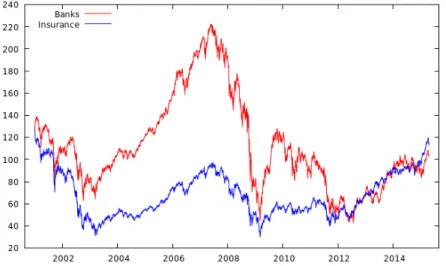
The data used in our empirical analysis consist of daily EMU (European Economic and Monetary Union) MSCI Bank sector equity total return index and Insurance sector equity total return index over the period (29/12/2000– 23/04/2015). The start date of the sample is chosen in order to study cou-pling direction dynamics prior and during the global financial crisis and the European Sovereign debt crisis. Our daily data are sourced from Macrobond database.
Figure 1: Daily EMU (European Economic and Monetary Union) MSCI Bank sector equity total return index and Insurance sector equity total return index over the period (29/12/2000–23/04/2015).
2.2. Inter-System Recurrence Network & Measures for Coupling direction Recurrence network analysis has been successfully used in tracing dy-namical transition in non-stationary time series based on mutual proximity of state vectors (observations) in phase space (Marwan et al. (2009); Don-ner et al. (2010b, 2011b)). Recurrence networks make use of the geometrical closeness in phase space via recurrence structure of the underlying time series by representating these structures as a connectivity pattern of an associated
complex network (Donner et al. (2011a); Donges et al. (2012)). Let {bi}Ni=1b
and {sj}Nj=1s represent realisations of banking sector B and insurance sector S
recorded at times ti (i = 1, 2, · · · , Nb) and tj (j = 1, 2, · · · , Ns), respectively.
Here bi = B(ti) and si = S(tj). The recurrence matrix associated with the
banking sector (similarly the insurance sector) is given by
RBij(εb) = Θ(εb− kbi− bjk), (1)
and the cross-recurrence matrix for both sectors defined by
CRBS
ij (εbs) = Θ(εbs− kbi− sjk), (2)
where k·k denotes a suitable distance norm (i.e. say the supremum norm),
and Θ(·) is the Heaviside function. The threshold ε· for the recurrence
anal-ysis is chosen to be equal to σ√m/10 , where σ is the fluctuation level in
signal, m is the embedding dimension of the signal (Letellier (2006)). This
choice of ε· is such that the value corresponds to 10% of the maximum phase
space diameter or such that the recurrence rate is 10% (Schinkel et al. (2008); Thiel et al. (2002); Marwan et al. (2007)). Measures based on the emergence of line structures of the plot of the recurrence matrix (1) are known as recur-rence quantification analysis (RQA) Zbilut and Webber (1992); Marwan and
Kurths (2002); Marwan et al. (2007). These measures are useful in charac-terising the dynamics and tracing transitions in the underlying time series. The concept of recurrence plots have been extended to complex network per-spective by defining an adjacency matrix associated with equation (1) as
ABij = RBij(εb) − δij, (3)
where δi,j denote Kronecker’s delta (δi,j = 1 if i = j, otherwise δi,j = 0).
The adjacency matric can be viewed as the recurrence matrix with self-loops removed. The equation (3) defines the recurrence network of an underlying data (Marwan et al. (2009); Donner et al. (2010b, 2011b)). These networks have been successfully used in the identification of dynamical transitions in marine palaeoclimate records (Donges et al. (2011)). The first application of recurrence networks and its associated network measures in economics was in Addo (2015). The feasibility of this network approach in studying spatial dependencies, and tracing dynamic transitions in sovereign credit default swaps and government bond yields prior and during the European debt crisis was introduced in Addo (2015). In this work, we focus on an inter-sectoral analysis by the means of inter-system recurrence networks as a new extension to the application of recurrence networks in economics.
Using the definition of cross-recurrence matrix (2) and recurrence network (3), the inter-system recurrence network is defined by
where ISR is the inter-system recurrence matrix given by ISR(ε) = RB(ε b) CRBS(εbs) CRSB(ε bs) RS(εs) (5) with ε = εb εbs εbs εs
, N = Nb + Ns, IN is the N -dimensional identity
ma-trix, and CRBS denoting the cross-recurrence matrix between the banking
sector and the insurance sector. It is worth pointing out that RB = CRBB,
RS = CRSS, CRSB = [CRBS]T by definition (Feldhoff et al. (2012)). The
threshold ε for each sector is chosen to be equal to σ/10 , where σ is the
fluctu-ation level in signal (Letellier (2006); Schinkel et al. (2008)), with εbs chosen
to be the min{εb, εs}. Given the presence of noise in the macro-financial
time series, and following a confirmed rule of thumb for RQA (Schinkel et al. (2008)), the recurrence threshold ε is chosen such that the link density is close to 0.05 with the internal recurrence rates . 10% (Donner et al. (2010a); Schinkel et al. (2008)). From a complex network perspective, the inter-system recurrence network (4) provides a novel way of studying the mutual inter-relationships between different sectors. Unlike other methods of time series analysis including recurrence plot and RQA, recurrence networks rely on ge-ometric considerations and do not require time information. This feature is essential in the area of economics & finance where variables of interest could have different sampling frequency. For instance, in studying the coupling direction between macroeconomic indices (usually sampled quarterly) verses financial sector indices sampled at relatively higher frequencies. We now dis-cuss how measures associated with the inter-system recurrence network will
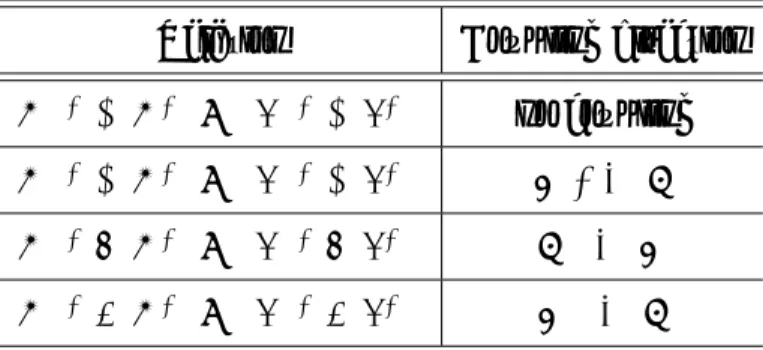
be useful in identifying coupling direction between the banking sector and insurance sector. In Table (2), the expected signatures of inter-system recur-rence network measures in different coupling situation is provided (Feldhoff et al. (2012); Donges et al. (2012)). The coupling directions are based on the definitions of global cross-clustering coefficient and cross-transitivity co-efficient presented in Table (1). In general, the transitivity coco-efficient is a more robust measure than the global clustering coefficient especially in short time series (Newman (2002); Saramaki et al. (2007); Donner et al. (2010b); Donges et al. (2011)). Name Definition cross-degree kBS v = P q∈VSAvq
local cross-clustering coefficient CBS
v = 1 kBS v (kvBS−1) P p,q∈VSAvpApqAqv, C BS v = 0 iff kBSv < 2
global cross-clustering coefficient CBS = hCBS
v iv∈VB cross-transitivity TBS = P v∈VB ;p,q∈VSAvpApqAqv P v∈VB ;p,q∈VSAvpAvq
Table 1: Measures for inter-system recurrence network (Feldhoff et al. (2012); Donges et al. (2012)) based on the adjacency matrix (4), where v ∈ VB and p, q ∈ VS denote vertices
of intra-recurrence network of Banking Sector and Insurance Sector respectively. h·iv∈VB denotes the average over all vertices v ∈ VB in Sector B. Similarly CSB and TSB can be
obtained by definition.
2.3. Implementation
In the implementation of the recurrence networks and calculation of complex network measures, we make use of the Python programming lan-guage, and in particular the package “pyunicorn”. The Python packages
Relation Coupling direction
TBS ≈ TSB, CBS ≈ CSB no coupling
TBS ≈ TSB, CBS ≈ CSB B ←→ S
TBS > TSB, CBS > CSB S −→ B
TBS < TSB, CBS < CSB B −→ S
Table 2: Signatures of Coupling based on the global clustering coefficient and cross-transitivity recurrence network measures. TSB and CSBdenotes the cross transitivity and
global cross-clustering coefficient of S with respect to B respectively. The unidirectional coupling is denoted by the arrow “−→”, whilst the arrow “←→” denotes a bidirectional coupling. See Donges et al. (2012); Feldhoff et al. (2012) for a detailed discussion.
“NetworkX” and “PyGraphviz” have been used for the visualization of net-work graphs. Following Addo (2015), we make use of the Los Alamos Na-tional Laboratory (lanl) internet routes algorithm for the graphical represen-tation of the complex networks based on the adjacency matrices.
In the section that follows, we will present the results on detecting cou-pling directions in banking and insurance sectors by means of inter-system recurrence networks described in Section (2.2). A discussion of the feasi-bility and relevance of the approach in studying “two–way” (bivariate) risk connections among sectors is then presented.
3. Discussion of Results & Concluding Remarks
In this section, we present results on the empirical application of inter-system recurrence networks in detecting coupling direction between two sec-tors of the European financial sector. Figure 1 shows the plot of the daily
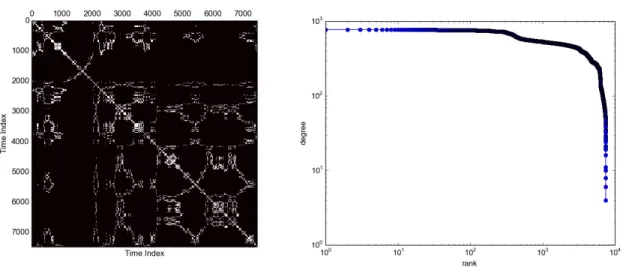
EMU MSCI Bank sector equity total return index and Insurance sector eq-uity total return index over the period (29/12/2000–23/04/2015). In general, the banking sector returns were relatively higher compared to the insurers especially between year 2003–2009. From this figure, it is evident that the banking sector was strongly hit during the recent global financial crisis. This could be due to risk exposures arising from banking operations on the in-terbank market and banking assets. The recurrence plots associated with the banking and insurance sectors are displayed in Figure 2a and Figure 2b respectively. We refer to these plots as the “intra-sectoral” recurrence plots. The butterfly-like structures on the diagonal of the recurrence plots in Fig-ure 2 mark times of distress in these financial sectors of the economy (Addo et al. (2013)). Figure 3 shows the cross recurrence plot for the sectors and the graphical representation of the inter-sector recurrence network. The cross re-currence plot displays times that observations in both sectors simultaneously recur. The recurrence plot of the inter-sector recurrence matrix is provided in Figure 4a and the associated degree rank plot in Figure 4b. The recurrence network measures in Table 3 indicates the presence of assortativity patterns with variations in the average path length implying dynamic transitions in the financial system. The results on the coupling direction for the banking and insurance sector across time is presented in Table 4. Overall, we find a coupling direction from the banking sector to the insurance sector which implies the direction of risk transmission between these sectors.
The correct identification of coupling direction in financial sectors of the economy is one of the main challenges in studying in the high degree of inter-dependence in the financial system. In this paper, we consider a structural
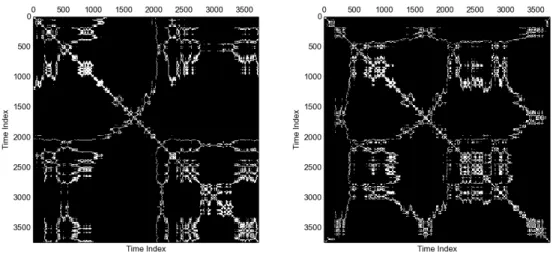
(a) Bank Sector Recurrence Plot (b) Insurance Sector Recurrence Plot
Figure 2: The recurrence plot of the adjacency matrices of the recurrence network as-sociated with the Banking and Insurance Sectors respectively over period 29/12/2000– 23/04/2015. This can also be referred to as the “intra-sectoral” recurrence plots. The time indexes corresponds to the following calender dates: “500”= 11/28/2002, “1000” = 10/28/2004, “1500”= 9/28/2006, “2000”= 8/28/2008, “2500”= 7/29/2010, “3000”= 6/28/2012, “3500”= 5/29/2014.
characterisation of non-stationary multivariate data based on geometrical closeness of observations in providing insights to uncovering transitions and causal interdependencies. Unlike the wide class of methods which are based on the quantification of temporal interrelationships between observations, recurrence networks takes into account the mutual proximity relationships of observations and does not require stationarity or any pre-processing of the original data (Addo (2015)). We have shown the usefulness of recurrence networks in identifying dynamical transitions (regime/structural change) (see
(a) Bank and Insurance Sector Cross-Recurrence Plot
(b) Graphical representation of the inter-sector recurrence network.
Figure 3: The recurrence plot of the cross-recurrence of the Banking and Insurance Sec-tors over period 29/12/2000–23/04/2015. The time indexes corresponds to the following calender dates: “500”= 11/28/2002, “1000” = 10/28/2004, “1500”= 9/28/2006, “2000”= 8/28/2008, “2500”= 7/29/2010, “3000”= 6/28/2012, “3500”= 5/29/2014. Figure (3b) is the recurrence network with the Internet lanl Routes representation.
Figure 2 and Table 3), which can serve as systemic risk indicators or early warning measures. Specifically, we have provided a comprehensive feasibility of the application of inter-system recurrence networks in identifying coupling direction in the field of economics. Without providing a verdict on whether banks should be designated as systemically important, our analysis indicates that the EMU banking sector is relatively more important than the EMU insurance sector when it comes to its contribution to systemic risk trans-mission. In other words, our findings suggest that risk transmissions have
(a) Recurrence Plot of the inter-sector recur-rence matrix.
(b) Degree rank plot of the inter-sector recurrence net-work.
Figure 4: A graphical representation of the inter-sector recurrence matrix and the degree rank plot.
Dates Assortativity Link density Average path length RRB, RRS
– 2007 0.8476 0.0469 15.5910 (0.0709, 0.0785)
2007–2009 0.8042 0.0421 13.9078 (0.0728, 0.0687)
2007–2012 0.6827 0.0538 10.5838 (0.0825, 0.0767)
2007–2014 0.6515 0.0590 7.2976 (0.0937, 0.0710)
2007–2015* 0.6851 0.0608 7.3827 (0.0948, 0.0719)
Table 3: Recurrence network measures for the inter-sector interconnectedness of banks and insurers shown in Figure 4a. RRB, RRSin the last column denotes the internal recurrence rate for the bank sector and insurance sector respectively. For detailed background on these measures, we refer the reader to Newman (2002, 2003); Donner et al. (2010b); Addo (2015).
Dates TBS TSB CBS CSB Coupling direction – 2007 0.7875 0.9434 0.5491 0.4627 Bank ,→ Insurance 2007–2009 0.7702 1.000 0.1854 0.9119 Bank −→ Insurance 2007–2012 0.7565 1.000 0.3724 0.9738 Bank −→ Insurance 2007–2014 0.7601 1.000 0.4858 0.9804 Bank −→ Insurance 2007–2015* 0.7620 1.000 0.5907 0.9820 Bank −→ Insurance 2010–2012 0.7525 1.000 0.3538 0.9923 Bank −→ Insurance 2010–2014 0.7645 0.8379 0.6712 0.8331 Bank −→ Insurance 2010–2015* 0.7688 0.7704 0.7729 0.7670 Bank ,→ Insurance
Table 4: Coupling direction of the banking and insurance sector across time. The date “ – 2007” denotes the start date of the sample until the last recorded value for year 2006. The time window of the format “20AA”–“20BB” denotes the period from the start date of year “20AA” to the end date of year “20BB”. The last recorded date for the analysis is 2015-04-23 denoted by “2015*”. Coupling directions are based on the signatures presented in Table (2). Coupling direction based on only the cross-transitivity network measure T is represented by the hook arrow “,→”.
mainly been from the banking sector to the insurance sector and not the vice versa.
To conclude, possible extensions and applications of the approach to sys-temic risk would be to formulate syssys-temic dependence between two sectors conditional on dependencies among other sectors. In other words, the in-troduction of a conditional inter-system recurrence network and associated measures to investigate systemic dependencies between two financial sub-system (sectors) in the presence of other sectors. In addition, an introduction
pling direction could serve as a new topic for research. In terms of empirical applications, the proposed approach is not only useful for sectoral systemic dependencies, it could be extended to cross-regional/border analysis to pro-vide insights to systemic risk.
References
Addo, P. M., 2015. Insights to the european debt crisis using recurrence quantification and network analysis. Centre d’Economie de la Sorbonne (CES) Working Paper (2015.35).
Addo, P. M., Billio, M., Gu´egan, D., 2013. Nonlinear dynamics and
recur-rence plots for detecting financial crisis. The North American Journal of Economics and Finance 26, 416–435.
Addo, P. M., Gatfaoui, H., Peretti, P. D., Runge, J., 2015. The kiss of information theory that captures systemic risk. Centre d’Economie de la Sorbonne (CES) Working Paper (14069r).
Billio, M., Getmansky, M., Lo, A. W., Pelizzon, L., 2012. Econometric mea-sures of connectedness and systemic risk in the finance and insurance sec-tors. Journal of Financial Economics 104, 535–559.
Cummins, J. D., Weiss, M. A., 2014. Systemic risk and the us insurance sector. Journal of Risk and insurance 81 (3), 489–527.
Donges, J. F., Donner, R. V., Rehfeld, K., Marwan, N., Trauth, M. H., Kurths, J., 2011. Identification of dynamical transitions in marine
palaeo-climate records by recurrence network analysis. Nonlinear Processes Geo-physics. 18, 545–562.
Donges, J. F., Heitzig, J., Donner, R. V., Kurths, J., 2012. Analytical frame-work for recurrence netframe-work analysis of time series. Physical Review E: Statistical, Nonlinear, and Soft Matter Physics 85, 046105.
Donner, R. V., Heitzig, J., Donges, J. F., Zou, Y., Marwan, N., Kurths, J., 2011a. The geometry of chaotic dynamics –a complex network perpective. European Physical Journal B 84 (4), 653.
Donner, R. V., Small, M., Donges, J. F., Marwan, N., Zou, Y., Xiang, R., Kurths, J., 2011b. Recurrence-based time series analysis by means of com-plex network methods. Int. J. Bifurcation Chaos 21, 1019–1046.
Donner, R. V., Zou, Y., Donges, J. F., Marwan, N., Kurths, J., 2010a. Ambiguities in recurrence-based complex network representations of time series. Physical Review E 81, 015101(R).
Donner, R. V., Zou, Y., Donges, J. F., Marwan, N., Kurths, J., 2010b. Recurrence networks– a novel paradigm for nonlinear time series. New J. Physics 12, 033025.
Feldhoff, J. H., Donner, R. V., Donges, J. F., Marwan, N., Kurths., J., 2012. Geometric detection of coupling directions by means of inter-system recurrence networks. Physics Letters A (376), 3504–3513.
Hartmann, P., Straetmans, S. T., de Vries, C. G., 2005. Banking system stability: a cross-atlantic perspective. European Central Bank Working
Letellier, C., 2006. Estimating the shannon entropy: recurrence plots versus symbolic dynamics. Physical Review Letters, 96:254102.
Marwan, N., Donges, J. F., Zou, Y., , Donner, R. V., Kurths, J., 2009. Complex network approach for recurrence analysis of time series. Phys. Letters A 373, 4246–4254.
Marwan, N., Kurths, J., 2002. Nonlinear analysis of bivariate data with cross recurrence plots. Physics Letters A 302 (5-6), 299–307.
Marwan, N., Romano, M. C., Thiel, M., Kurths, J., 2007. Recurrence plots for the analysis of complex systems. Physics Reports 438 (5–6), 237–329. Newman, M. E. J., 2002. Assortative mixing in networks. Phys. Rev. Letters
89, 208701.
Newman, M. E. J., 2003. The structure and function of complex networks. SIAM Rev 45 (2), 167–256.
Saramaki, J., Kivela, M., Onnela, J. P., Kaski, K., Kert´esz, J., 2007.
General-izations of the clustering coefficient to weighted complex network. Physical Review E 75, 027105.
Schinkel, S., Dimigen, O., Marwan, N., 2008. Selection of recurrence thresh-old for signal detection. European Physical Journal-Special Topics 164 (1), 45–53.
Slijkerman, J. F., Schoenmaker, D., de Vries, C. G., 2013. Systemic risk and diversification across european banks and insurers. Journal of Banking & Finance 37, 773–785.
Thiel, M., Romano, M. C., Kurths, J., Meucci, R., Allaria, E., Arecchi, F. T., 2002. Influence of observational noise on the recurrence quantifica-tion analysis. Physica D 17 (3), 138–152.
Zbilut, J. P., Webber, J. C. L., 1992. Embeddings and delays as derived from quantification of recurrence plots. Physics Letters A (171), 199–203.