HAL Id: inserm-00903866
https://www.hal.inserm.fr/inserm-00903866
Submitted on 13 Nov 2013
HAL is a multi-disciplinary open access
archive for the deposit and dissemination of
sci-entific research documents, whether they are
pub-lished or not. The documents may come from
teaching and research institutions in France or
abroad, or from public or private research centers.
L’archive ouverte pluridisciplinaire HAL, est
destinée au dépôt et à la diffusion de documents
scientifiques de niveau recherche, publiés ou non,
émanant des établissements d’enseignement et de
recherche français ou étrangers, des laboratoires
publics ou privés.
Mehmet Samur, Parantu Shah, Xujun Wang, Stéphane Minvielle, Florence
Magrangeas, Hervé Avet-Loiseau, Nikhil Munshi, Cheng Li
To cite this version:
Mehmet Samur, Parantu Shah, Xujun Wang, Stéphane Minvielle, Florence Magrangeas, et al.. The
shaping and functional consequences of the dosage effect landscape in multiple myeloma.. BMC
Genomics, BioMed Central, 2013, 14 (1), pp.672. �10.1186/1471-2164-14-672�. �inserm-00903866�
R E S E A R C H A R T I C L E
Open Access
The shaping and functional consequences of the
dosage effect landscape in multiple myeloma
Mehmet K Samur
1,2†, Parantu K Shah
1†, Xujun Wang
3, Stéphane Minvielle
4, Florence Magrangeas
4,
Hervé Avet-Loiseau
4, Nikhil C Munshi
5*and Cheng Li
1*Abstract
Background: Multiple myeloma (MM) is a malignant proliferation of plasma B cells. Based on recurrent aneuploidy such as copy number alterations (CNAs), myeloma is divided into two subtypes with different CNA patterns and patient survival outcomes. How aneuploidy events arise, and whether they contribute to cancer cell evolution are actively studied. The large amount of transcriptomic changes resultant of CNAs (dosage effect) pose big challenges for identifying functional consequences of CNAs in myeloma in terms of specific driver genes and pathways. In this study, we hypothesize that gene-wise dosage effect varies as a result from complex regulatory networks that translate the impact of CNAs to gene expression, and studying this variation can provide insights into functional effects of CNAs.
Results: We propose gene-wise dosage effect score and genome-wide karyotype plot as tools to measure and visualize concordant copy number and expression changes across cancer samples. We find that dosage effect in myeloma is widespread yet variable, and it is correlated with gene expression level and CNA frequencies in different chromosomes. Our analysis suggests that despite the enrichment of differentially expressed genes
between hyperdiploid MM and non-hyperdiploid MM in the trisomy chromosomes, the chromosomal proportion of dosage sensitive genes is higher in the non-trisomy chromosomes. Dosage-sensitive genes are enriched by genes with protein translation and localization functions, and dosage resistant genes are enriched by apoptosis genes. These results point to future studies on differential dosage sensitivity and resistance of pro- and anti-proliferation pathways and their variation across patients as therapeutic targets and prognosis markers.
Conclusions: Our findings support the hypothesis that recurrent CNAs in myeloma are selected by their functional consequences. The novel dosage effect score defined in this work will facilitate integration of copy number and expression data for identifying driver genes in cancer genomics studies. The accompanying R code is available at http://www.canevolve.org/dosageEffect/.
Keywords: Copy number alteration, Dosage effect, Multiple myeloma, Hyperdiploid, Integrative genomics
Background
Multiple myeloma (MM or myeloma) is a malignant pro-liferation of plasma B cells that contain prevalent genomic alterations [1,2]. Based on copy number alterations and translocations, myeloma is divided into two main sub-types. The hyperdiploid multiple myeloma (HMM) is
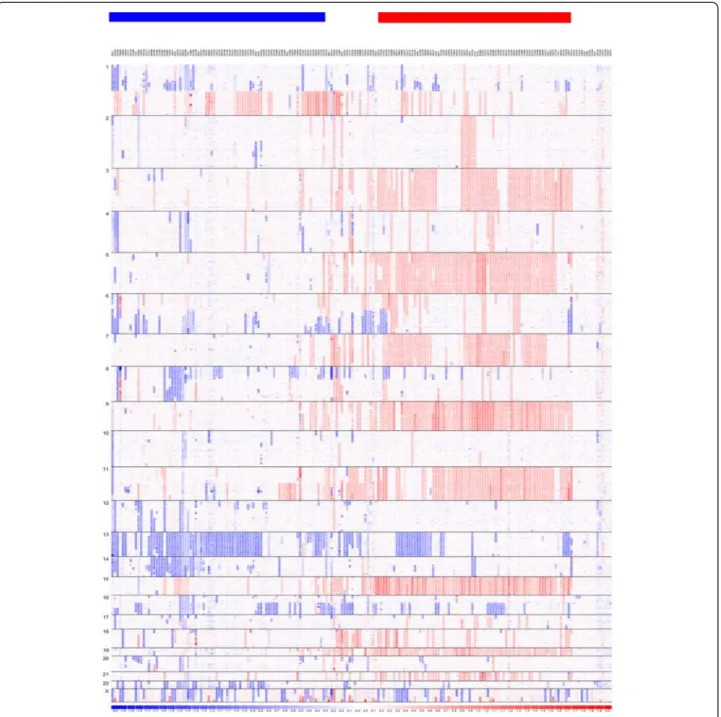
characterized by the trisomy (three copies) of eight chromosomes, 3, 5, 7, 9, 11, 15, 19 and 21, and the non-hyperdiploid multiple myeloma (NHMM) is often associ-ated with chromosome 13 hemizygous deletion and translocations between the immunoglobulin heavy chain gene and proto-oncogenes [3]. The copy number alter-ations (CNAs) in other chromosome regions such as 1q, 6q, 8p, and 16q occur in both subtypes (Figure 1).
Excessively present in myeloma, CNAs are also fre-quent genomic alteration events in most hematological cancers and many solid cancers [4]. How CNAs arise and whether they contribute to cancer cell evolution is actively debated [5,6]. Some argue that CNAs are a benign side
* Correspondence:Nikhil_Munshi@dfci.harvard.edu;lch3000@gmail.com
†
Equal contributors
5
Department of Medical Oncology, Dana-Farber Cancer Institute and Harvard Medical School, VA Boston Healthcare System, Boston, MA 02215, USA
1Department of Biostatistics and Computational Biology, Dana-Farber Cancer
Institute and Harvard School of Public Health, Boston, MA 02215, USA Full list of author information is available at the end of the article
© 2013 Samur et al.; licensee BioMed Central Ltd. This is an open access article distributed under the terms of the Creative Commons Attribution License (http://creativecommons.org/licenses/by/2.0), which permits unrestricted use, distribution, and reproduction in any medium, provided the original work is properly cited.
effect of genomic instability during cancer development, which results in many types of mutations and chromo-some mis-segregation [7]. Others propose that CNAs have functional consequences on survival and proliferation of cancer cells [8,9], and therefore could be subjected to se-lection during cancer cell evolution. The eight non-random trisomy chromosomes that characterize HMMs, and better patient survival rates in HMM than in NHMM
support the functional selection of CNAs in myeloma [10]. More substantial analysis is needed to identify candi-date driver genes or pathways affected by CNAs and de-sign experiments that interfere with these candidates to study their functional effects on cancer cells. However, thousands of genes located in the CNA regions in mye-loma have altered mRNA expression levels directly in-duced by copy number changes, a phenomenon termed
Figure 1 SNP copy number-based clustering provides an overall view of myeloma genomic heterogeneity and subtypes. Myeloma samples in the IFM dataset are clustered based on their SNP-array copy numbers from left to right. SNPs are ordered by chromosome positions from top to bottom. Blue color indicates copy number loss, white color indicates copy number close to normal, and red color indicates copy number gains. The horizontal bars on the top indicate samples clusters with copy number features of NHMM (blue) and HMM (red).
copy number dosage effect [11]. In addition, among the genes with dosage effect, transcription factors and epigen-etic modifiers could further modulate mRNA expression of their many downstream genes [12]. These large number of directly and indirectly affected genes by CNAs pose big challenges for identifying functional consequences of CNAs in myeloma in terms of specific driver genes and pathways, and for studying the interplay between these driver genes and other genetic mutations during myeloma cell evolution.
Technological development in genomics has promoted multi-scale and integrative studies of cancer [13]. In par-ticular, paired gene expression and copy number profiling for the same cancer samples has helped identifying driver cancer genes in CNA regions, expression signatures that correlate with particular CNAs, and new cancer subtypes [4,14-16]. Copy number dosage effect has been a direct or implied question in such studies, which have shown the dosage effect of genes in various cancer types such as leukemia, lymphoma, liver cancer and breast cancer [17-20]. In myeloma, Dickens and colleagues have identi-fied 170 genes with homozygous deletions and corre-sponding loss of expression using paired gene expression and copy number alteration profiles [21]. Cell death net-work is over-represented in these genes, and patients with these deletions have worse overall survival. Agnelli and colleagues have compared myeloma samples with and without chromosome 13 deletions and identified 67 down-regulated genes of which 44 maps to chromosome 13 [22]. These genes are involved in protein biosyn-thesis, ubiquitination and transcriptional regulation. Many genes and pathways are differentially expressed between the HMM and NHMM subtypes, which have distinct CNA profiles [23,24]. These results support that CNAs have functional consequences through affecting gene ex-pression and may contribute to myeloma cell evolution through cancer-related pathways.
When the extent of CNAs spans multiple chromo-somes and hundreds or thousands of genes, such as in myeloma, current dosage effect studies integrating gene and copy number data have limitations. First, they tend to identify pathways with broad functions such as prolifer-ation and apoptosis, whose gene members are enriched in the genes with dosage effect. Although these pathways provide insights into possible contribution of CNAs to cancer, they do not suggest specific therapeutic targets to improving current treatment regimes. Second, regulatory feed-back loops and dosage compensation mechanisms may attenuate the dosage effect of many genes [25], caus-ing them missed by correlation analysis between copy number and expression or differential expression analysis between CNA groups.
Based on these observations, we hypothesize that gene-wise dosage effect varies as a result from complex
regulatory networks that translate the impact of CNAs to gene expression, and studying this variation can provide insights into functional effects of CNAs. We propose a gene-wise dosage effect score to measure the prevalence of concordant copy number and expression changes across the samples in a dataset. Applied to two myeloma datasets, a genome-wide karyotype plot of the dosage ef-fect reveals the variation of dosage efef-fect between genes and across chromosomes. We then study the potential causes of these variations in terms of gene’s overall expres-sion level and chromosomes’ CNA frequency. Unexpect-edly, four non-trisomy chromosomes (13, 14, 16, and 22) emerge as having the highest proportion of their genes that are dosage sensitive. Dosage sensitive genes and dos-age resistant genes are enriched with different functional pathways. In particular, the apoptosis pathway is enriched in dosage resistant genes, raising interesting hypothesis about the mechanism of this phenomenon and its utility as a prognosis marker. Taken together, our findings sup-port that recurrent CNAs in myeloma are selected by their functional consequences. The proposed dosage effect ana-lysis method will facilitate many genomics studies inte-grating gene copy number and expression data.
Methods
Microarray datasets
We used two datasets providing paired genome-wide profiles of copy number alterations and gene expres-sion for newly diagnosed myeloma patients. The first is the IFM (Intergroupe Francophone du Myelome) dataset with 170 patients profiled in our laboratory by high-density Affymetrix 500 K SNP arrays and Exon ST 1.0 expres-sion arrays (GEO identifiers GSE12896 and GSE39754). Patient characteristics and clinical information have been reported previously [2]. The second is the Dickens dataset with 71 patients profiled by Affymetrix 500 K SNP ar-rays and Human Genome U133 Plus 2.0 expression arar-rays (GSE15695) [21].
Primary analysis of gene expression and copy number data
The gene expression and copy number profiling data were preprocessed with the dChip software [26,27] to obtain expression and copy number estimates. The gene expression profiles were quantile-normalized and model-based signals were computed [26,27]. Gene probe set in-tensity values were averaged when more than one probe sets per gene were available. To assess the impact of al-ternative methods for handling Affymetrix array probe sets on Dosage effect scores, we also obtained alternative expression estimates for the IFM dataset from a CDF (HuEx-1_0-st-v2,coreR3,A20071112,EP.CDF) provided by Purdom et. al. [28]. This CDF, available form aroma. affymetrix website, groups Affymetrix “core” probesets into
18,708 transcript clusters. In this setting, each exon and probe is uniquely mapped to only one transcript cluster, allowing for a unique gene expression value for each indi-vidual gene after pre-processing and eliminating the need to use avarage value for each gene.
A gene’s copy number was obtained by averaging the copy numbers of the SNPs within 5 kb of the gene’s transcription region. Further analysis was done with the R programming environment. We created gene expres-sion and copy number data matrices based on unique gene symbols, and then identified the gene symbols common between the two data matrices for dosage ef-fect analysis: 12836 genes for the IFM dataset and 12359 genes for the Dickens dataset.
Hyperdiploidy status
Since there were no published hyperdiploidy data deter-mined by FISH for both datasets, the myeloma hyper-diploidy status was defined using the copy number information from SNP arrays. To determine the threshold for separating samples in to two subtypes, we plotted the distribution of the median copy number of the trisomy chromosomes. We observed a bimodal distribution with two peaks at 2 and 2.6. The HMM samples have a peak near 2.6 (and not 3) due to the normalization effect across arrays. We chose the midway value (2.3) between the two peaks as the cutoff to call HMM and NHMM samples from the copy number data. 77 of 170 IFM samples, and 42 of 71 Dickens samples were called as HMM, and the rest samples were called as NHMM.
Defining dosage effect score (DES)
We defined a gene-wise dosage effect score (DES) to iden-tify genes whose copy number changes modulate their own expression. The DES is the ratio between “dosage ef-fect sample number” and “CNA sample number”. The “CNA sample number” of a gene, is the number of samples in a dataset that have CNA at the gene (copy number < 1.7 or > 2.3, considering signal noise and normal cell contam-ination). The “dosage effect sample number” of the gene is defined using two steps. First, using the samples with no copy number changes at the gene (copy number within 1.7 and 2.3), the mean (normal_mean) and standard deviation (normal_sd) of the gene expression values is calculated. Next, we count the total number of samples that have CNA at this gene and their expression levels at the gene change more than random in the same direction as their CNA (i.e. the samples whose gene expression value are higher than normal_mean + normal_sd for amplification samples or lower than normal_mean – normal_sd for dele-tion samples). The number of these samples is the “dosage effect sample number” at the gene.
Being a ratio, DES ranges between 0 and 1. Larger DES indicates stronger dosage effect at the gene in the
sense that a larger proportion of CNA samples have concordant expression changes. To ensure reliability, DES is computed only for genes whose CNA sample number is greater than 10% of all samples. As an ex-ample, the gene EIF3K has CNA in 55.88% of samples in the IFM data set. Utilizing mean +/− 1 SD criteria, the percent of samples with both copy number alteration and concordant expression changes are 25.29%. EIF3K has the DES of 0.45 (.2559/.5588) in the IFM dataset.
Differential and functional enrichment analysis
Differential expression was identified with the LIMMA Bioconductor package, and Benjamini-Hochberg mul-tiple hypothesis correction was carried out using the R package multtest. Differential gene expression was called at the adjusted p-value < 0.05. We used the DAVID web server for gene function enrichment analysis using gene ontology (GO) categories (GOTERM_BP_FAT, GOTERM_ CC_FAT and GOTERM_MF_FAT) [29].
Results
Differentially expressed genes between HMM and NHMM are enriched in the trisomy chromosomes
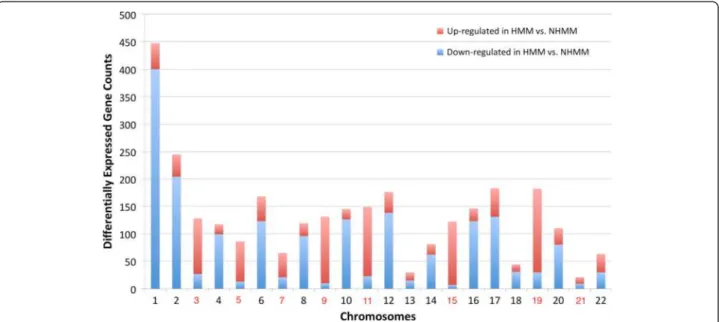
A primary difference between the HMM and NHMM sub-types is the presence of three copies (trisomy) of eight spe-cific chromosomes in HMM and normal copy numbers for them in NHMM (Figure 1). To check whether the trisomy chromosomes influence the expression of the genes lo-cated within them, we compared the HMM and NHMM samples of the IFM dataset for differentially expressed genes. The trisomy chromosomes contained more HMM up-regulated genes than HMM down-regulated genes (Figure 2). Specifically, 744 of the 4702 (15.8%) tri-somy chromosome genes are up-regulated in HMM, while only 416 of the 8134 (5.1%) non-trisomy chromo-some genes are up-regulated in HMM (Fisher’s exact test p-value < 2.2e-16).
In contrast, genes down-regulated in HMM are signifi-cantly depleted from the trisomy chromosomes (140 of 1798 down-regulated genes locate in the trisomy chro-mosomes, p-value < 2.2e-16). Such enrichment is not due to that expressed genes in myeloma preferentially locate in the trisomy chromosomes. The reason is as fol-lows: when the expressed genes in myeloma is defined as the top 50% genes ranked by median expression level across the IFM samples, 51.4% (2418 genes) of the tri-somy chromosome genes are expressed and 49.2% (3999 genes) of the non-trisomy chromosomes are expressed (p-value = 0.014).
Chromosome 1q amplification is observed in ~40% of myeloma patients (e.g. Figure 1) and many genes on 1q21 have been reported as over-expressed when com-paring myeloma against normal. In the IFM data, we ob-serve much more down-regulated genes than up-regulated
genes from chromosome 1 when comparing HMM vs. NHMM samples (Figure 2). This can be due to more fre-quent amplification of chromosome 1q in NHMM than in HMM (Figure 1). These results suggest that chromosome copy number changes in myeloma could have direct effect on the expression level of a substantial number of genes.
Widespread but variable dosage effect in myeloma
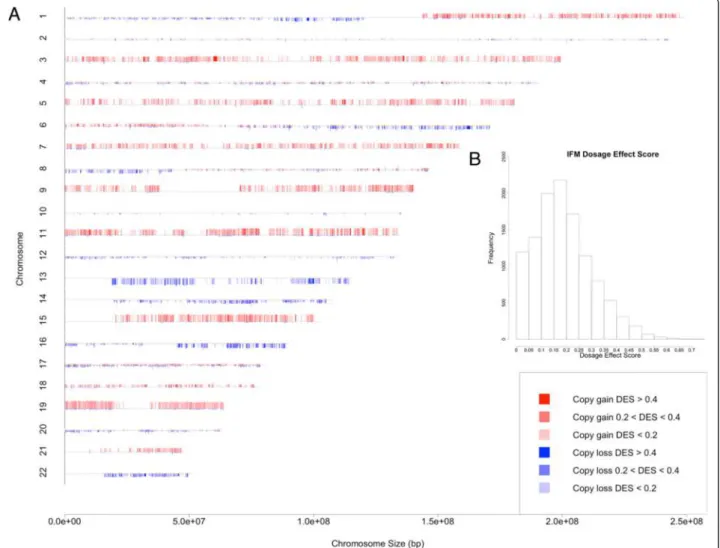
To understand the global and spatial patterns of how copy number alterations (CNAs) affect gene expression in myeloma, we integrated paired gene expression and copy number profiling data from two myeloma datasets. We defined a dosage effect score (DES) for each gene as the proportion of CNA samples that have concordant copy number and gene expression changes (see Methods), and then visualized the gene-wise CNA frequencies and DES in a genome-wide karyotype plot (Figures 3A and 4A). The plots show that the dosage effect in mye-loma patients is widespread and there is an overall similar dosage effect patterns between the IFM and Dickens datasets. The impact of dosage on gene expression can be observed at most chromosomes, such as the trisomy chro-mosomes 9, 11 and 15, and chrochro-mosomes 13, 14 and 16, which contain hemizygously deleted regions.
DES ranges between 0 and 1, and summarizes con-cordant copy number and gene expression changes. A value close to 0 and 1 indicates weak and strong dosage effect, respectively. The distribution of DES in the IFM data shows a large variation of DES across genes: 58% genes have low dosage effect (DES < 0.2, Figure 3B), 37% have medium dosage effect (DES between 0.2 and 0.4), and
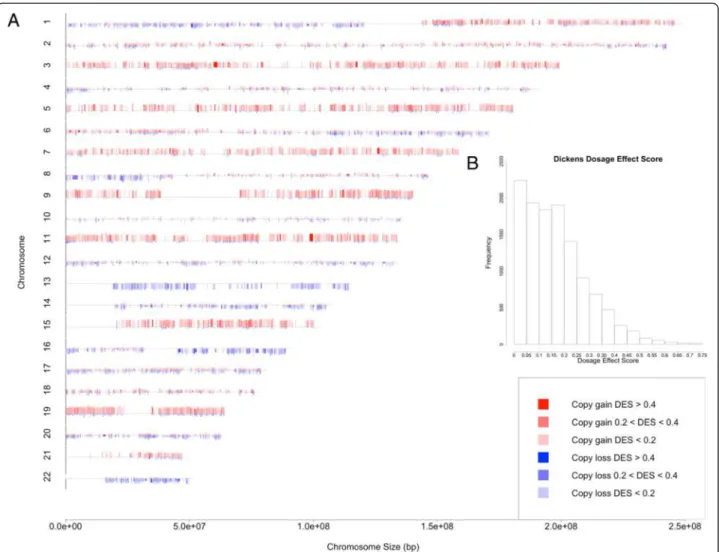
only 5.2% (611 genes) have high dosage effect (DES > 0.4). For the Dickens data the distribution is similar: 64%, 30%, and 5.5% (655) genes have low, medium and high dosage effect, respectively (Figure 4B). The high dos-age effect genes from the two datasets have 123 genes in common (Fisher’s exact p-value < 2.2e-16). The top 100 dosage-sensitive as well as resistant-genes for IFM and Dickens datasets are reported in Additional files 1 and 2. Deletion in chromosome 13 is a prognostic fac-tor in MM [3]. Therefore genes showing strong dos-age effect on this chromosome may be important for MM. A list of dosage sensitive genes on this chromo-some is available in Additional file 3. ELOVL7, PTDSS1, POLR1D, TBC1D22A, CCNC and TCF25 are some of the interesting genes with cancer related functions identified from the DES analysis. Additional file 4 summarizes cancer related functions based on PubMed for top 50 dosage sen-sitive genes in both IFM and Dickens datasets.
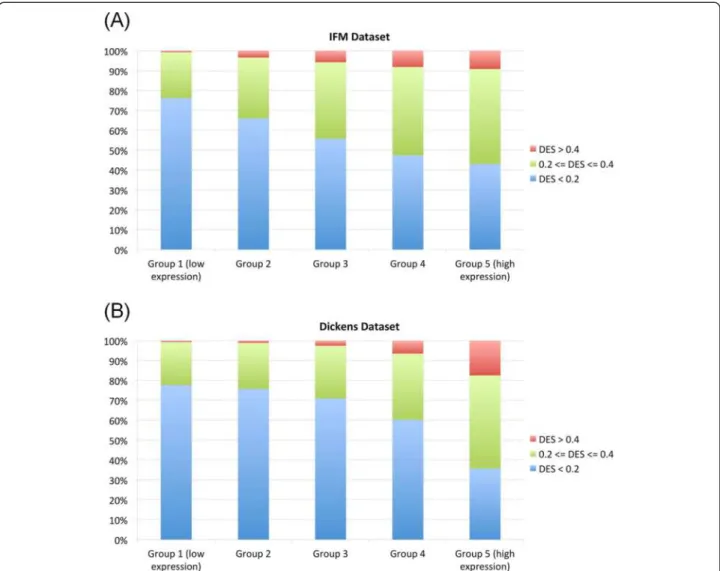
Higher gene expression level is associated with stronger dosage effect
To explain the variation of dosage effect for the genes with similar CNA frequencies, such as those in the same trisomy chromosome (Figure 3A), we correlated gene expression levels with the DES. The motivation is that some genes are expressed at higher level than others, and genes that are not expressed in myeloma will not exhibit any dosage effect. We first ordered all the genes by their median expression levels across samples and divided the genes into five equal-size groups (Figure 5, X-axis), and then compared the proportion of genes
Figure 2 The number of differentially expressed genes between HMM and NHMM by chromosome. Red and blue bars represent up-regulated genes and down-regulated genes in HMM samples compared to NHMM samples, respectively. No normal samples are available or used for this dataset. On the X-axis label, trisomy chromosomes in HMM are colored in red.
having low, medium and high dosage effect across the groups (Figure 5, Y-axis). We found that for both datasets, higher expressed gene groups contain significant larger proportion of genes with high dosage effect (Cochran-Armitage p-value < 2.2e-16 for both datasets).
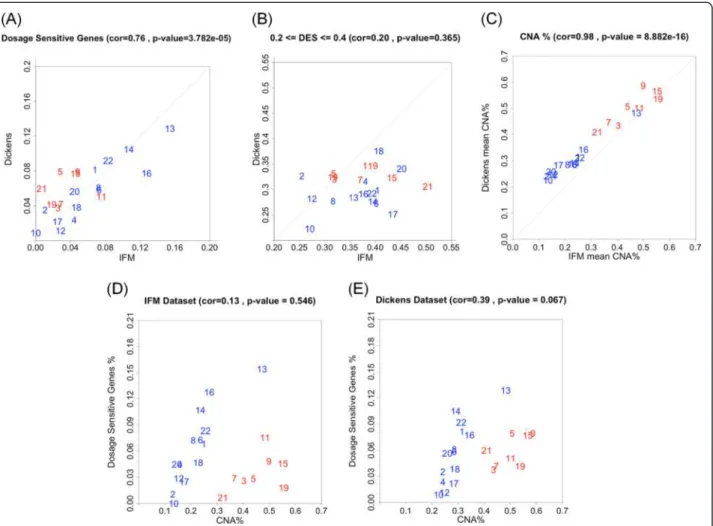
Higher chromosomal CNA frequency is correlated with higher proportion of dosage sensitive genes
The proportion of dosage sensitive genes (DES > 0.4) in each chromosome also varies across chromosomes, ran-ging from about 2% for chromosome 17 to >12% for chromosome 13 (Figure 6A). These proportions strongly correlate between the two datasets. Interestingly, the chromosomal proportion of dosage sensitive genes is highest for four non-trisomy chromosomes (chromo-somes 13, 14, 16 and 22) and lower for the trisomy chro-mosomes (marked red in Figure 6A). In contrast, the proportion of genes with medium dosage effect in each
chromosome is not correlated between the two datasets (Figure 6B).
Because the pattern of recurrent chromosomal gains and losses in myeloma are conserved across different datasets (Figures 1 and 6C), we asked whether the variation in the proportion of dosage sensitive genes across chromosomes is correlated with the myeloma CNA patterns. We com-pared the proportion of dosage sensitive genes with the proportion of genes with CNA across chromosomes. For non-trisomy chromosomes (marked blue in Figure 6D, 6E), we observed that larger CNA proportions associate with higher proportion of dosage sensitive genes.
Both dosage sensitive genes and differentially expressed genes between HMM and NHMM are enriched by protein translation and localization processes
To explore the functional consequences of dosage effect, we performed functional enrichment analysis for dosage
Figure 3 The CNA frequency and dosage effect karyotype plot for the IFM dataset. (A) The chromosomes are numbered from 1 to 22 and marked by gene locations. For each gene, the height of red and blue bars represents the percent of samples with copy number gain and copy number loss, respectively. The height of gray bars at the beginning of chromosomes indicates 100%. The colors represent the dosage effect score (DES) of genes, which measures concordant copy number and expression changes. (B) The distribution of gene dosage effect scores.
sensitive genes (DES > 0.4, genes listed in Additional file 1 and 2 for the IFM and Dickens dataset respectively) using the DAVID gene ontology Web server. Translation, protein localization, and proteolysis processes are enriched in dos-age sensitive genes from the IFM dataset (Additional file 5: Table S1). Translation, protein localization and mitochon-drial processes are enriched in dosage sensitive genes from the Dickens dataset (Additional file 5: Table S2).
Since the distinct CNA patterns in the HMM and NHMM subtypes can induce subtype specific expression changes through dosage effect, we asked how dosage ef-fect analysis compares to differential expression analysis. We compared 2958 differentially expressed genes be-tween HMM and NHMM (Figure 2) and 611 dosage sensitive genes (DES > 0.4) from the IFM dataset. Their overlap of 306 genes is highly significant (Fisher’s exact test p-value < 2.2e-16). Gene ontology groups enriched in HMM up-regulated genes include translation and
RNA-binding, and those enriched in NHMM up-regulated genes include protein localization, proteolysis, cell cycle, RNA processing and histone modification (Additional file 5: Table S3). These results suggest that differentially expressed genes between the two myeloma subtypes are mainly driven by dosage sensitive genes located in distinct CNA regions of the two subtypes.
Dosage resistant genes are enriched by the apoptosis process
Compared to dosage sensitive genes, dosage resistant genes (Additional file 1 and Additional file 2) may be subjected to more stringent dosage compensatory net-works such as feedback loops. Dosage resistant genes were defined as the top 20% of highly expressed genes (Group 5 from Figure 5) that have DES < 0.2 (genes listed in Additional files 1 and 2). Gene ontology enrich-ment analysis of dosage resistant genes identified processes
Figure 4 The CNA frequency and dosage effect karyotype plot for the Dickens dataset. (A) The chromosomes are numbered from 1 to 22 and marked by gene locations. For each gene, the height of red and blue bars represents the percent of samples with copy number gain and copy number loss, respectively. The height of gray bars at the beginning of chromosomes indicates 100%. The colors represent the dosage effect score (DES) of genes, which measures concordant copy number and expression changes. (B) The distribution of gene dosage effect scores.
such as translation and organelle lumen, which are com-monly enriched in both dosage sensitive and resistant genes. However, apoptosis emerged as a distinct process only enriched in dosage resistant genes in both datasets (Additional file 5: Table S4, Table S5).
Alternative pre-processing of Affymetrix Exon arrays does not impact dosage effect score substantially
It is valuable to assess impact of alternative methods for handling Affymetrix Exon array probe sets on DES. Therefore, we obtained alternative expression estimates for the IFM dataset from a CDF provided by Purdom et al. [28]. For the IFM dataset, the Pearson correlation coefficient for the mean of gene expression estimates across the samples of dChip and aroma.affymetrix normal-ized data is 0.86 (12192 genes; p < 2.2e-16) and the correl-ation for DES scores is 0.81 (10960 genes; p < 2.2e-16).
Moreover, the results from functional enrichment ana-lysis of DES scores from the IFM dataset derived using aroma.affymetrix expression estimates overlap signifi-cantly with those obtained from dChip expression esti-mates (Additional file 5: Figure S1A and S1B, Additional file 5: Table S6 and S7). In addition, we can observe simi-lar DES patterns for chromosomal locations (Figure 3 and Additional file 5: Figure S2). Please see Additional file 5 for detailed enrichment results. Thus, conclusions from our analysis are robust against different pre-processing methods.
Discussion
Cancer genomes such as those of multiple myeloma har-bor many types of genomic aberrations. Among them, CNAs of entire chromosomes or focal chromosomal re-gions have been extensively detected from many cancer
Figure 5 The correlation between dosage effect and gene expression level. (A) The IFM dataset, and (B) the Dickens dataset. Group 1 includes the 20% genes that have lowest overall expression across samples, and Group 5 includes the 20% genes that have highest overall expression.
types in the past decade through microarrays and mas-sively parallel sequencing technologies. Paired copy num-ber and gene expression profiling of the same cancer samples has enabled integrative analysis identifying driver oncogenes, improving classification of cancer subtypes, and provided better understanding of molecular pathways dysregulated in cancer [4,15,19,30]. In myeloma genomes, prevalent and recurrent patterns of 8 trisomy chromo-somes and deletions of specific chromochromo-somes (1p, 6q, 8p, 13, 16q; see Figure 1) provide a model system to study the effect of CNAs on gene expression. Although previous studies hinted at the copy number dosage effect in various cancer types including myeloma [11,18], in this study we have for the first time defined dosage effect score, highlighted its variation across genes and chromosomes, and studied the potential consequence of these variations in terms of dosage sensitive genes and dosage-resistant genes. Other genomic changes such as copy-neutral loss of
heterozygosity can be inferred from SNP array data, and they could affect gene expression levels. Study of these al-terations can be followed up in the future.
Defining a gene-wise dosage effect score (DES) allows us to compare and visualize the impact of CNAs on gene expression at the level of individual genes, across the genome and between datasets. The DES score was calcu-lated only for those genes that have copy number alter-ations in at least 10% of patients and vary their expression beyond the mean expression +/− one SD, as a safeguard in the process. Because cis-regulatory factors may reduce the gene expression output even if the copy number has in-creased, using higher SD values could result in significantly higher amount of false negatives. In practice, users of our method can use any suitable threshold of choice. The visualization of distribution of DES along chromosomes suggests that dosage effect in myeloma is widespread and variable across the genome (Figures 3 and 4). Most genes
Figure 6 The correlation between dosage sensitive genes and CNA frequency across chromosomes. (A) The proportion of genes in each chromosome that are dosage sensitive (DES > 0.4). X-axis: the IFM dataset, Y-axis: the Dickens dataset. (B) The proportion of genes in each chromosome that have medium dosage effect (0.2 < = DES < = 0.4). X-axis: the IFM dataset, Y-axis: the Dickens dataset. (C) Copy number alteration frequency in each chromosome compared between the two datasets. Each point represents the CNA (copy number <1.7 or > 2.3) frequency of a gene across samples, averaged over all the genes in a chromosome. (D, E) The proportion of dosage sensitive genes (Y-axis) is plotted against the average CNA frequency (X-axis) for different chromosomes, for the IFM data (D) and the Dickens data (E).
show low or moderate dosage effect, and only about 5% of genes are highly dosage sensitive. We analyze two contrib-uting causes for such variation: highly expressed genes are more likely to have higher dosage effect (Figure 5), and higher frequency of CNAs in a chromosome correlates with higher proportion of dosage sensitive genes (Figure 6D and 6E). Interestingly, although three non-trisomy chro-mosomes (14, 16, 22) have lower frequency of CNAs than the 8 trisomy chromosomes, the proportion of dosage sen-sitive genes in these non-trisomy chromosomes are higher than in the trisomy chromosomes (Figure 6D and 6E). This could be due to that 3-copy gains in trisomy chromosomes lead to 1.5 fold expression changes, while 1-copy losses in non-trisomy chromosomes lead to 2 fold expression changes. The larger relative impact on gene expression of copy number losses may lead to higher proportion of dosage sensitive genes in non-trisomy chromosomes.
Dosage sensitive genes are enriched by genes with function in protein translation and localization. Recently, dosage effects of protein translation and transport genes are reported for plasma cell leukemia, a cancer closely related to myeloma [31]. Overdrive of translation machines is a feature of cancer cell proliferation [32-34]. Dosage sen-sitivity of the genes in translation processes indicates their expression levels are not subject to tightly controlled dos-age compensation and are susceptible to the influence of copy number alteration. These results support that CNA patterns in myeloma, such as the eight characteristic tri-somy chromosomes in about half of all myeloma patients, are not a by-product of myeloma genomic evolution but have functional and consequential effects that contribute to the pathogenesis of myeloma.
We find that gene ontology groups enriched in dosage sensitive genes are similar to those enriched in the dif-ferential expressed genes between HMM and NHMM subtypes (Additional file 5: Tables S1, S2 and S3), and these two gene sets overlap significantly. Previous gene expression studies comparing HMM and NHMM have found similar enriched pathways. Chng et. al. reported over-expression of ribosomal protein and protein biosyn-thesis genes in HMM relative to NHMM [24]. Agnelli et. al. reported that up-regulated genes in HMM com-pared to NHMM are mainly involved in protein biosyn-thesis, encoding for ribosomal proteins and mitochondrial ribonucleoproteins [23], and these genes mainly mapped to the hyperdiploid chromosomes. Therefore, distinct CNA patterns in HMM and NHMM are likely to be the cause for most differentially expressed genes between the two subtypes through dosage effect.
We also identify specific dosage sensitive genes that may play critical roles in myeloma development. For ex-ample (Additional files 1, 2 and 3), Tamura et. al. [35] showed that EVOLV7 could be involved in prostate cancer growth and survival. Camps et. al. [36] identified that loss
of POLR1D function affects cell viability in colorectal cers. Cell cycle role of CCNC and its effect on several can-cer types were reported by several authors [37,38]. Steen et. al. previously reported the role of NULP1 (TCG25) in cell death control and tumor growth [39]. Additional file 4 includes literature search for the top 50 dosage sensitive genes for both IFM and Dickens dataset.
A less studied phenomenon in integrative genomics is dosage resistance or compensation. Essential genes whose expression level must be tightly regulated may achieve dosage resistance through feedback loops that compensate for copy number changes [40]. A recent study reports that amplified genes may be over-expressed, unchanged or down-regulated in cervical cancer [41]. Signaling and receptor activity functions are enriched in genes whose ex-pression negatively correlates with copy number in glio-blastoma [42]. In our analysis, we found apoptosis as an enriched category in dosage resistant genes but not in dos-age sensitive genes. The gene ontology category “apoptosis” encompasses a large number of genes with both “signaling” and other functions. This ontology as any categorization is subjective and incomplete with gaps in knowledge. The apoptosis pathway is often mutated or inhibited in cancer cells for its tumor suppressing function [43]. Dickens et al. have identified 170 “cell death” signature genes whose homozygous deletions and corresponding loss of expres-sion in myeloma are adverse to overall survival [21]. These results point to future studies on differential dosage sensi-tivity and resistance of pro- and anti-proliferation pathways and their variation across patients as therapeutic targets and prognosis markers.
There are several limitations of this study. First, we haven’t considered indirect effects of CNAs. CNAs could directly alter the expression level of transcription factors and signaling transduction genes, which in turn affect their downstream genes’ expression. Partly alleviating this limi-tation, our identification of dosage-resistant genes may be reflection of indirect effects. Second, parameters and thresholds used in the analysis are chosen based on empir-ical distributions and consideration for reducing noise, such as computing DES only for genes with CNA fre-quency >10% and regarding genes as dosage-sensitive at DES > 0.4, but choosing other parameters may lead to dif-ferent results. We have used DSE > 0.3 to select dosage sensitive genes and obtained similar enriched pathways in dosage sensitive genes. The agreement between the two myeloma datasets with different patient cohorts also sup-ports the robustness of the analysis method and parame-ters used. These limitations point to directions for further improvement of dosage effect analysis.
Conclusions
In summary, dosage effect score is a gene-wise meas-ure that integrates copy number alteration with gene
expression in a quantitative manner. It could be an im-portant tool to understanding the functional impact of CNAs in tumor development. Our results indicate that CNAs in myeloma impact the gene expression level of a substantial number of genes. Interestingly, our analysis suggests that even though differentially expressed genes between HMM and NHMM are enriched in the trisomy chromosomes, chromosomal proportion of dosage sensi-tive genes is highest for non-trisomy chromosomes. Also, higher expression levels associated with stronger dosage effect. The dosage sensitive genes are enriched by protein translation and localization processes, and dosage resistant genes are enriched by genes with function in apoptosis. These results support that CNAs exert functional effect in cancer transcriptome in part through direct dosage effect of CNA-affected genes, and therefore recurrent CNAs can be selected during cancer clonal evolution due to their dosage effect on specific pathways. The gene lists identi-fied in our analysis will help identify functional targets in myeloma. The R code is available at http://www.canevolve. org/dosageEffect/ for applying this method to other stud-ies profiling paired gene expression and copy number can-cer samples.
Availability of supporting data
All supporting data are included as Additional files 1, 2, 3, 4 and 5. The data sets supporting the results of this article are available in the Gene Expression Omnibus (GEO) re-pository, GSE12896, GSE39754 and GSE15695 at http:// www.ncbi.nlm.nih.gov/geo/.
Additional files
Additional file 1: List of top 100 dosage sensitive and resistant genes for the IFM dataset and dosage effect scores of apoptosis pathway member genes.
Additional file 2: List of top 100 dosage sensitive and resistant genes for the Dickens dataset and dosage effect scores of apoptosis pathway member genes.
Additional file 3: Genes showing strong dosage effect on chromosome 13 for the IFM and Dickens datasets. Additional file 4: Cancer-related functions of top 50 dosage sensitive genes in the IFM and Dickens datasets.
Additional file 5: Supplementary tables and figures.
Competing interests
The authors declare that they have no competing interests. Authors’ contributions
MKS, PKS, NCM and CL designed the study. MKS implemented the methodology. PKS and MKS analyzed the data. SM, FM and HA-L generated the IFM dataset. XW contributed to data analysis. MKS, PKS and CL wrote the manuscript. All authors reviewed and approved the manuscript.
Acknowledgments
We thank Dr. Osman Saka for supporting MK Samur’s visit to Cheng Li’s group and his work on this project. We thank Norman Huang’s input during
the early stage of this work. We also thank two anonymous reviewers who provided critical comments to help improve this work.
Grant support
Grant support are from NIH R01 GM077122 (C Li), National Basic Research Program of China (973 Program; No. 2010CB944904) (X Wang), and Claudia Adams Barr Program in Innovative Basic Cancer Research and the Multiple Myeloma Career Development award (PK Shah). This work is also supported in part by grants from the National Institutes of Health Grants RO1-124929, PO1-155258, P50-100007 and PO1-78378 to NC Munshi and C Li and from the Dept. of Veterans Affairs Merit Review Awards to NC Munshi. S Minvielle and F Magrangeas were supported by French National Research Agency, Grant R08079NS.
Author details
1Department of Biostatistics and Computational Biology, Dana-Farber Cancer
Institute and Harvard School of Public Health, Boston, MA 02215, USA.
2Department of Biostatistics and Medical Informatics, Akdeniz University,
Antalya, Turkey.3Department of Bioinformatics, School of Life Sciences and Technology, Tongji University, Shanghai, China.4Inserm UMR892, CNRS 6299,
Université de Nantes; Centre Hospitalier Universitaire de Nantes, Unité Mixte de Genomique du Cancer, Nantes, France.5Department of Medical
Oncology, Dana-Farber Cancer Institute and Harvard Medical School, VA Boston Healthcare System, Boston, MA 02215, USA.
Received: 12 May 2013 Accepted: 30 September 2013 Published: 2 October 2013
References
1. Anderson KC, Carrasco RD: Pathogenesis of myeloma. Annu Rev Pathol 2011, 6:249–274.
2. Avet-Loiseau H, Li C, Magrangeas F, Gouraud W, Charbonnel C, Harousseau JL, Attal M, Marit G, Mathiot C, Facon T, et al: Prognostic significance of copy-number alterations in multiple myeloma. J Clin Oncol 2009, 27:4585–4590. 3. Munshi NC, Avet-Loiseau H: Genomics in multiple myeloma. Clin Cancer
Res 2011, 17:1234–1242.
4. Huang N, Shah PK, Li C: Lessons from a decade of integrating cancer copy number alterations with gene expression profiles. Brief Bioinform 2011, 13:305–316.
5. Gordon DJ, Resio B, Pellman D: Causes and consequences of aneuploidy in cancer. Nat Rev Genet 2012, 13:189–203.
6. Weaver BA, Cleveland DW: Does aneuploidy cause cancer? Curr Opin Cell Biol 2006, 18:658–667.
7. Hede K: Which came first? Studies clarify role of aneuploidy in cancer. J Natl Cancer Inst 2005, 97:87–89.
8. Holland AJ, Cleveland DW: Boveri revisited: chromosomal instability, aneuploidy and tumorigenesis. Nat Rev Mol Cell Biol 2009, 10:478–487. 9. Weaver BA, Cleveland DW: Aneuploidy: instigator and inhibitor of
tumorigenesis. Cancer Res 2007, 67:10103–10105.
10. Avet-Loiseau H, Attal M, Moreau P, Charbonnel C, Garban F, Hulin C, Leyvraz S, Michallet M, Yakoub-Agha I, Garderet L, et al: Genetic abnormalities and survival in multiple myeloma: the experience of the Intergroupe Francophone du Myelome. Blood 2007, 109:3489–3495.
11. Agnelli L, Mosca L, Fabris S, Lionetti M, Andronache A, Kwee I, Todoerti K, Verdelli D, Battaglia C, Bertoni F, et al: A SNP microarray and FISH-based procedure to detect allelic imbalances in multiple myeloma: an integrated genomics approach reveals a wide gene dosage effect. Genes Chromosomes Cancer 2009, 48:603–614.
12. Rudin CM, Durinck S, Stawiski EW, Poirier JT, Modrusan Z, Shames DS, Bergbower EA, Guan Y, Shin J, Guillory J, et al: Comprehensive genomic analysis identifies SOX2 as a frequently amplified gene in small-cell lung cancer. Nat Genet 2012, 44:1111–1116.
13. Cancer Genome Atlas Research N: Comprehensive genomic
characterization defines human glioblastoma genes and core pathways. Nature 2008, 455:1061–1068.
14. Tomlins SA, Mehra R, Rhodes DR, Cao X, Wang L, Dhanasekaran SM, Kalyana-Sundaram S, Wei JT, Rubin MA, Pienta KJ, et al: Integrative molecular concept modeling of prostate cancer progression. Nat Genet 2007, 39:41–51.
15. Garraway LA, Widlund HR, Rubin MA, Getz G, Berger AJ, Ramaswamy S, Beroukhim R, Milner DA, Granter SR, Du J, et al: Integrative genomic
analyses identify MITF as a lineage survival oncogene amplified in malignant melanoma. Nature 2005, 436:117–122.
16. Akavia UD, Litvin O, Kim J, Sanchez-Garcia F, Kotliar D, Causton HC, Pochanard P, Mozes E, Garraway LA, Pe’er D: An integrated approach to uncover drivers of cancer. Cell 2010, 143:1005–1017.
17. Hungermann D, Schmidt H, Natrajan R, Tidow N, Poos K, Reis-Filho JS, Brandt B, Buerger H, Korsching E: Influence of whole arm loss of chromosome 16q on gene expression patterns in oestrogen receptor-positive, invasive breast cancer. J Pathol 2011, 224:517–528.
18. Sellmann L, Scholtysik R, Kreuz M, Cyrull S, Tiacci E, Stanelle J, Carpinteiro A, Nuckel H, Boes T, Gesk S, et al: Gene dosage effects in chronic lymphocytic leukemia. Cancer Genet Cytogenet 2010, 203:149–160. 19. Monti S, Chapuy B, Takeyama K, Rodig SJ, Hao Y, Yeda KT, Inguilizian H,
Mermel C, Currie T, Dogan A, et al: Integrative analysis reveals an outcome-associated and targetable pattern of p53 and cell cycle deregulation in diffuse large B cell lymphoma. Cancer Cell 2012, 22:359–372.
20. Roessler S, Long EL, Budhu A, Chen Y, Zhao X, Ji J, Walker R, Jia HL, Ye QH, Qin LX, et al: Integrative genomic identification of genes on 8p associated with hepatocellular carcinoma progression and patient survival. Gastroenterology 2012, 142:957–966. e912.
21. Dickens NJ, Walker BA, Leone PE, Johnson DC, Brito JL, Zeisig A, Jenner MW, Boyd KD, Gonzalez D, Gregory WM, et al: Homozygous deletion mapping in myeloma samples identifies genes and an expression signature relevant to pathogenesis and outcome. Clin Cancer Res 2010, 16:1856–1864.
22. Agnelli L, Bicciato S, Fabris S, Baldini L, Morabito F, Intini D, Verdelli D, Callegaro A, Bertoni F, Lambertenghi-Deliliers G, et al: Integrative genomic analysis reveals distinct transcriptional and genetic features associated with chromosome 13 deletion in multiple myeloma. Haematologica 2007, 92:56–65.
23. Agnelli L, Fabris S, Bicciato S, Basso D, Baldini L, Morabito F, Verdelli D, Todoerti K, Lambertenghi-Deliliers G, Lombardi L, Neri A: Upregulation of translational machinery and distinct genetic subgroups characterise hyperdiploidy in multiple myeloma. Br J Haematol 2007, 136:565–573. 24. Chng WJ, Kumar S, Vanwier S, Ahmann G, Price-Troska T, Henderson K,
Chung TH, Kim S, Mulligan G, Bryant B, et al: Molecular dissection of hyperdiploid multiple myeloma by gene expression profiling. Cancer Res 2007, 67:2982–2989.
25. Birchler JA: Reflections on studies of gene expression in aneuploids. Biochem J 2010, 426:119–123.
26. Li C, Wong WH: Model-based analysis of oligonucleotide arrays: expression index computation and outlier detection. Proc Natl Acad Sci USA 2001, 98:31–36.
27. Lin M, Wei LJ, Sellers WR, Lieberfarb M, Wong WH, Li C: dChipSNP: significance curve and clustering of SNP-array-based loss-of-heterozygosity data. Bioinformatics 2004, 20:1233–1240.
28. Purdom E, Simpson KM, Robinson MD, Conboy JG, Lapuk AV, Speed TP: FIRMA: a method for detection of alternative splicing from exon array data. Bioinformatics 2008, 24:1707–1714.
29. da Huang W, Sherman BT, Lempicki RA: Bioinformatics enrichment tools: paths toward the comprehensive functional analysis of large gene lists. Nucleic Acids Res 2009, 37:1–13.
30. Kuijjer ML, Rydbeck H, Kresse SH, Buddingh EP, Lid AB, Roelofs H, Burger H, Myklebost O, Hogendoorn PC, Meza-Zepeda LA, Cleton-Jansen AM: Identification of osteosarcoma driver genes by integrative analysis of copy number and gene expression data. Genes Chromosomes Cancer 2012, 51:696–706.
31. Mosca L, Musto P, Todoerti K, Barbieri M, Agnelli L, Fabris S, Tuana G, Lionetti M, Bonaparte E, Sirchia SM, et al: Genome-wide analysis of primary plasma cell leukemia identifies recurrent imbalances associated with changes in transcriptional profiles. Am J Hematol 2013, 88:16–23. 32. Zismanov V, Drucker L, Attar-Schneider O, Matalon ST, Pasmanik-Chor M,
Lishner M: Tetraspanins stimulate protein synthesis in myeloma cell lines. J Cell Biochem 2012, 113:2500–2510.
33. Yamasaki S, Anderson P: Reprogramming mRNA translation during stress. Curr Opin Cell Biol 2008, 20:222–226.
34. Silvera D, Formenti SC, Schneider RJ: Translational control in cancer. Nat Rev Cancer 2010, 10:254–266.
35. Tamura K, Makino A, Hullin-Matsuda F, Kobayashi T, Furihata M, Chung S, Ashida S, Miki T, Fujioka T, Shuin T, et al: Novel lipogenic enzyme ELOVL7
is involved in prostate cancer growth through saturated long-chain fatty acid metabolism. Cancer Res 2009, 69:8133–8140.
36. Camps J, Pitt JJ, Emons G, Hummon AB, Case CM, Grade M, Jones TL, Nguyen QT, Ghadimi BM, Beissbarth T, et al: Genetic amplification of the NOTCH modulator LNX2 upregulates the WNT/beta-catenin pathway in colorectal cancer. Cancer Res 2013, 73:2003–2013.
37. van Delft FW, Horsley S, Colman S, Anderson K, Bateman C, Kempski H, Zuna J, Eckert C, Saha V, Kearney L, et al: Clonal origins of relapse in ETV6-RUNX1 acute lymphoblastic leukemia. Blood 2011, 117:6247–6254. 38. Miyata Y, Liu Y, Jankovic V, Sashida G, Lee JM, Shieh JH, Naoe T, Moore M, Nimer SD: Cyclin C regulates human hematopoietic stem/progenitor cell quiescence. Stem Cells 2010, 28:308–317.
39. Steen H, Lindholm D: Nuclear localized protein-1 (Nulp1) increases cell death of human osteosarcoma cells and binds the X-linked inhibitor of apoptosis protein. Biochem Biophys Res Commun 2008, 366:432–437. 40. Veitia RA, Bottani S, Birchler JA: Cellular reactions to gene dosage
imbalance: genomic, transcriptomic and proteomic effects. Trends Genet 2008, 24:390–397.
41. Vazquez-Mena O, Medina-Martinez I, Juarez-Torres E, Barron V, Espinosa A, Villegas-Sepulveda N, Gomez-Laguna L, Nieto-Martinez K, Orozco L, Roman-Basaure E, et al: Amplified genes may be overexpressed, unchanged, or downregulated in cervical cancer cell lines. PLoS One 2012, 7:e32667. 42. Wang RT, Ahn S, Park CC, Khan AH, Lange K, Smith DJ: Effects of
genome-wide copy number variation on expression in mammalian cells. BMC Genomics 2011, 12:562.
43. Cotter TG: Apoptosis and cancer: the genesis of a research field. Nat Rev Cancer 2009, 9:501–507.
doi:10.1186/1471-2164-14-672
Cite this article as: Samur et al.: The shaping and functional consequences of the dosage effect landscape in multiple myeloma. BMC Genomics 2013 14:672.
Submit your next manuscript to BioMed Central and take full advantage of:
• Convenient online submission
• Thorough peer review
• No space constraints or color figure charges
• Immediate publication on acceptance
• Inclusion in PubMed, CAS, Scopus and Google Scholar
• Research which is freely available for redistribution
Submit your manuscript at www.biomedcentral.com/submit