Shining a light on species delimitation in the tree genus Engelhardia
Leschenault ex Blume (Juglandaceae)
Can-Yu Zhang
a,i, Shook Ling Low
b, Yi-Gang Song
c,e, Nurainas
d, Gregor Kozlowski
e,
Truong Van Do
f, Lang Li
a,g,j, Shi-Shun Zhou
g, Yun-Hong Tan
g,j, Guan-Long Cao
a,i, Zhuo Zhou
h,
Hong-Hu Meng
a,g,⁎, Jie Li
a,g,j,⁎a Plant Phylogenetics and Conservation Group, Center for Integrative Conservation, Xishuangbanna Tropical Botanical Garden, Chinese Academy of Sciences, Kunming 650023, China
b CAS Key Laboratory of Tropical Forest Ecology, Xishuangbanna Tropical Botanical Garden, Chinese Academy of Sciences, Mengla 666303, China c Shanghai Chenshan Plant Science Research Center, Chinese Academy of Sciences, Shanghai 201602, China
d Department of Biology, Faculty of Math. & Nat. Sci. Andalas University, Padang 25163, West Sumatra, Indonesia e Department of Biology and Botanic Garden, University of Fribourg, Chemin du Musée 10, CH-1700 Fribourg, Switzerland f Vietnam National Museum of Nature, Vietnam Academy of Science & Technology, 18 Hoang Quoc Viet, Hanoi, Viet Nam g Southeast Asia Biodiversity Research Institute, Chinese Academy of Sciences, Nay Pyi Taw 05282, Myanmar
h CAS Key Laboratory for Plant Diversity and Biogeography of East Asia, Kunming Institute of Botany, Chinese Academy of Sciences, Kunming 650201, China i University of Chinese Academy of Sciences, Beijing 100049, China
j Center of Conservation Biology, Core Botanical Gardens, Chinese Academy of Sciences, Mengla 666303, China
A R T I C L E I N F O Keywords: Species delimitation Integrative taxonomy Engelhardia Morphology
Tropical and subtropical Asia
A B S T R A C T
Enhanced efficacy in species delimitation is critically important in biology given the pending biodiversity crisis under global warming and anthropogenic activity. In particular, delineation of traditional classifications in view of the complexity of species requires an integrative approach to effectively define species boundaries, and this is a major focus of systematic biology. Here, we explored species delimitation of Engelhardia in tropical and sub-tropical Asia. In total, 716 individuals in 71 populations were genotyped using five chloroplast regions, one nuclear DNA region (nrITS), and 11 nuclear simple sequence repeats (nSSR). Phylogenetic trees were con-structed and relationships among species were assessed. Molecular analyses were then combined with 14 morphological characteristics of 720 specimens to further explore the species boundaries of Engelhardia. Integrating phylogenetic and morphological clusters provided well-resolved relationships to delineate seven species. The results suggested that: first, that E. fenzelii, E. roxburghiana, E. hainanensis, E. apoensis, and E. serrata are distinct species; second, E. spicata var. spicata, E. spicata var. aceriflora, E. spicata var. colebrookeana, and E. rigida should be combined under E. spicata and treated as a species complex; third, E. serrata var. cambodica should be raised to species level and named E. villosa. We illuminated that bias thresholds determining the cluster number for delimiting species boundaries were substantially reduced when morphological data were incorporated. Our results urge caution when using the concepts of subspecies and varieties in order to prevent confusion, particularly with respect to species delimitation for tropical and subtropical species. In some cases, re- ranking or combining subspecies and/or varieties may enable more accurate species delimitation.
1. Introduction
Species are the fundamental units of biology, providing the most practical metric for distinguishing habitats and tracking the progress of Earth’s biodiversity (Costello et al., 2013). Therefore, effective re-cognition of species is the first step in the fields of phylogeny, evolution, biogeography, and biodiversity conservation (de Queiroz, 2005; Mayr,
1982). However, mistakes are inevitable when determining species, and can result in erroneous interpretations in research that uses species- based information. In particular, mistakes of plant identification in tropical regions are very common (Goodwin et al., 2015) and can ad-versely affect recognition and understanding of species diversity in global biodiversity hotspots. Moreover, associated biased factors may result in higher costs or unpredictable waste of effort in species and/or
⁎Corresponding authors at: 88 Xuefu Rd., Wuhua, Kunming, Yunnan, China.
E-mail addresses: menghonghu@xtbg.ac.cn (H.-H. Meng), jieli@xtbg.ac.cn (J. Li).
http://doc.rero.ch
Published in "Molecular Phylogenetics and Evolution 152(): 106918, 2020"
which should be cited to refer to this work.
biodiversity conservation (Su et al., 2015).
Indeed, previous research has emphasised that use of only a single line of evidence to delimit species may result in the detection of more or fewer species than are actually present (Edwards and Knowles, 2014). Perspectives on morphological classification are often biased by re-searcher preferences or weighting characteristics. Widespread species tend to be more morphologically diverse compared with narrowly en-demic species, which can easily lead to more varieties (Darwin, 1859). Moreover, similar traits can appear in lineages that are not closely re-lated owing to parallel evolution (Schluter et al., 2004), which leads to distinct lineages clustering together. Although phylogenetic analyses can substantially enhance our understanding of the relationships among species, they do not provide a complete solution to species delimitation, as the number and nature of clusters often depend on arbitrary thresholds or parameters (Posso-Terranova and Andrés, 2018). Owing to the shortcomings of using a single parameter (e.g., morphological or molecular data) to delimit species boundaries, an integrative approach should be developed as a major tool in modern systematics (Wiens, 2007). The rationale for this is that a separate and evolving metapo-pulation lineage is the primary property defining species, and integra-tion of multiple operaintegra-tional approaches (morphology, genetics, etc.) to define and validate this property can increase the efficiency and accu-racy of species delimitation greatly (de Queiroz, 2007). Recently, in-tegrative methods, such as the multivariate clustering of morphological, genetic data, have helped define species boundaries in animals and plants (Carstens and Satler, 2013; Damasco et al., 2019; Misiewicz and Fine, 2014; Posso-Terranova and Andrés, 2018; Prata et al., 2018).
However, species delimitation within the family Juglandaceae re-mains a challenge, as hybridization and frequent gene flow have com-monly occurred in its complex evolutionary history (Bai et al., 2014; Dong et al., 2017; Zhao et al., 2018). In particular, apparently con-tinuous species intergradations are problematic among the well-studied temperate groups in the family (Kozlowski et al., 2018; Stone et al., 2009). Moreover, delimitation of tropical species remains daunting because of the extent of plant diversity in the tropics and the paucity of comprehensive floristic accounts (Ulloa, 2017), with on average more than 50% of tropical specimens likely to be identified incorrectly (Goodwin et al. 2015). Thus, integrative methods and comprehensive sampling are needed to relieve the problems with the delimitation of tropical and subtropical Juglandaceae species.
Engelhardia is a genus of deciduous or evergreen trees in the walnut
family (Juglandaceae) and is considered to be one of the primitive genera of the tribe Engelhardieae (Song et al., 2020). The genus occurs in tropical and subtropical East Asia, the Indo-China Peninsula, and the Malay Archipelago; while the tribe also contains Oreomunnea and
Al-faroa, both of which are distributed in Central America. The taxonomy
and phylogeny of Engelhardia have been explored for decades, but are still subjects of disagreement (Manos and Stone, 2001; Manos et al., 2007; Stone, 2010). In particular, Engelhardia remains poorly under-stood due to inaccessibility of study material, large ocean separation, and vast latitudinal distribution in tropical and subtropical Asia.
A relatively comprehensive classification of the genus Engelhardia was conducted by Manning (1966) based on herbarium materials, but there was a lack of comprehensive field investigations and molecular analyses. Most of the studies related to Engelhardia have focused mainly on fossils (Hermsen and Gandolfo, 2016; Manchester, 1987; Manchester et al., 1994; Meng et al., 2015), or taxonomic affinities at higher levels such as the tribe or family (Manos and Stone, 2001; Manos et al., 2007). Consequently, Flora of China (FOC) indicated that the number of species of Engelhardia is an open question and the taxonomy of the genus suffers from a lack of good specimens across its vast geographic range (Lu et al., 1999). Moreover, the taxonomy of Engelhardia is complicated further by the use of multiple synonymous names in different areas (Manning, 1966; Sidiyasa, 2015).
Additionally, previous taxonomy has been mainly focused on mor-phological traits such as inflorescences and leaflets, which has led to the
proposal of subdivisions in Engelhardia (e.g., Manning, 1966). Five species of Engelhardia collected across the entire distribution area were identified with this focus: the widely distributed E. roxburghiana, E.
spicata, and E. serrata, and the more narrowly endemic E. rigida and E. apoensis. In addition, some varieties have been recognised by Jacobs (1960) and Manning (1966). The species listed in FOC are somewhat different: E. roxburghiana (including E. fenzelii), E. hainanensis, E. spicata (including E. spicata var. aceriflora, E. spicata var. colebrookeana), and E.
serrata var. cambodica (Lu et al., 1999). Moreover, the taxonomic pla-cement of E. roxburghiana is controversial, with Iljinskaya (1993) pro-posing that it should be considered as a new monotypic genus,
Alfar-opsis. However, Alfaropsis was considered to be synonymous with Engelhardia (Lu et al., 1999), and its position remains unresolved (Manos and Stone, 2001; Manos et al., 2007; Stone, 2010). It is also notable that E. roxburghiana, E. spicata, and the varieties occur in mixed communities, and there may be hybridization among them. E. apoensis is probably the rarest species of Engelhardia, having been collected only 12 times, and E. serrata has included apprently excessive numbers of varieties in previous research (Manning, 1966). These aspects of
En-gelhardia taxonomy also require further investigation. The
character-istics and distributions of previously recognised Engelhardia taxa are provided in Table S1 and Fig S1.
Accordingly, this study aims to explore species delimitation within
Engelhardia using evidence from integrative chloroplast DNA (cpDNA),
nuclear ribosomal DNA (nrDNA), nuclear simple sequence repeats (nSSR) analyses, and morphology across its entire geographic dis-tribution in tropical and subtropical Asia. Our results enabled us to, (1) provide insight into species concepts and delimitation within
Engelhardia; (2) explore integrative approaches, particularly methods
involving integrating molecular and morphological data to define spe-cies boundaries; and (3) reveal how many spespe-cies within Engelhardia. 2. Materials and methods
2.1. Sample collection
Sampling was undertaken for Engelhardia taxa recognised by Manning (1966), the FOC (Keren and Lu, 1979; Lu et al., 1999), Flora
Malesiana (Jacobs, 1960), and websites such as the CVH (Chinese Virtual Herbarium: http://www.cvh.ac.cn/class), POWO (Plants of the World Online: http://powo.science.kew.org), Tropicos (http://www.tropicos. org), and the GBIF (Global Biodiversity Information Facility: https:// www.gbif.org). A total of 716 individuals of Engelhardia were collected from 71 populations, representing ten taxa from across tropical and subtropical Asia (Fig. 1, see Table S2 for the geographic coordinates). Our sampling scale covered almost the entire distribution of Engelhardia from south of the Yangtze River to Indonesia. However, we did not sample from Nepal, the Philippines, the Malay Peninsula, and New Guinea. The nrDNA and cpDNA sequence variation and nSSR analyses were performed using genetic materials from each sample collected.
2.2. DNA fragments and nSSR sequenced
Total genomic DNA was extracted using a Plant Genomic DNA Kit (Tiangen Biotech, China). Five cpDNA regions (psbA-trnH, trnL-trnF, rps16,
trnS-trnG, and rpl32-trnL), and the nrITS region, were sequenced (Table
S3). In addition, 11 selected nSSR loci were amplified: HQ23, HQ49, HQ54, HQ89, JC4833, JC6576, WGA27, WGA79, WGA089, WGA202, and WGA321. Detailed information on lab protocols is provided in Table S4. All targeted chloroplast sequences were concatenated and edited manually using Geneious v6.1.2 (https://www.geneious.com/).
2.3. Network and phylogenetic analyses of DNA sequences
The combined cpDNA haplotypes (H) and nrDNA ribotypes (R) were analysed using DNASP v6 (Rozas et al., 2017), with the lineage
relationships between the haplotypes and ribotypes inferred by median- joining network as implemented in NETWORK v2.0 (Bandelt et al., 1999) and Splits Tree v4.14.8 (Huson and Bryant, 2006). Both plastid DNA and ITS data sets were subjected to Bayesian analyses using MrBayes v3.1.2 (Huelsenbeck and Ronquist, 2001), and maximum- likelihood (ML) analyses were performed in RAxML-HPC BlackBox via the CIPRES portal (Miller et al., 2010). Following the phylogeny for Juglandaceae, Rhoiptelea chiliantha was selected as outgroup (Manos and Stone, 2001; Manos et al., 2007). The best-fit evolutionary model and gamma rate heterogeneity were chosen by running the datasets using the Akaike information criterion (AIC) with PAUP* v4.0b10 (Swofford, 2002) and Modeltest v3.7 (Posada and Crandall, 1998). The best-fit substitution models suggested that the combined cpDNA and nrDNA data were TIM + I + G and GTR + I + G, respectively. For Bayesian analyses, the Markov chain Monte Carlo (MCMC) algorithm was run for 5 × 10⁶ generations with one cold and three heated chains, starting from random trees and sampling one out of every 500 gen-erations. Examination of the log-likelihood values suggested that sta-tionarity was reached in about 5 × 10⁵ generations. For ML analyses, the confidence levels of the nodes supporting the trees were determined using the fast bootstrapping option with 1000 bootstrap replicates.
2.4. Neighbour-joining (NJ) phylogenetic analyses and population genetic structure based on nSSR
Microsatellite data (nSSR) were edited and formatted in GenAlEx v6.3 (Peakall and Smouse, 2012) (see Table S5 for the data). The
phylogenetic relationships of the sampled populations were determined using the NJ method with Powermarker v3.25 (Liu and Muse, 2005). Inference of genetic structure from the microsatellite data was con-ducted with Structure v2.3 (Pritchard et al., 2003). The simulation was run with a cluster number (K) ranging from 1 to 20 for each set. Each run consisted of a burn-in of 2 × 10⁴ iterations, followed by 105 iterations. Results and convergence of the MCMC procedure were subject to repeated testing by carrying out a series of 10 replicate runs for each K-prior value. The K-prior value was evaluated in log-like-lihood form using Structure Harvester v0.6.8 (Earl and von Holdt, 2012).
2.5. Statistical analyses of morphology
Basic morphological information was also obtained by measuring the specimens with flowers and seeds during the field survey, as well as herbarium specimens from the herbaria (Tables S6 and S7). We first observed and measured 25 characteristics from 720 individuals, in-cluding 13 quantitative traits and 12 qualitative traits (Table S8), based on important morphological features from the literature (Jacobs, 1960; Keren and Lu, 1979; Lu et al., 1999; Manning, 1966; Manos and Stone, 2001; Stone, 2010). To determine which traits provided useful in-formation, we examined statistically significant morphological differ-ences using AMOVA (Table S6). A total of 25 morphological char-acteristics were used to test placement of the specimens in the multivariate space based on Discriminant Analysis. Data collected from the field were selected to estimate the morphological differences among Fig. 1. (a) The geographic distribution of Engelhardia. A total of 71 locations were collected across tropical and subtropical Asia. (b) The blue shadows denote the entire geographic distribution areas of Engelhardia (adopted from Meng et al., 2015; Manchester, 1987). (For interpretation of the references to colour in this figure legend, the reader is referred to the web version of this article.)
populations and compared against the descriptions available for each taxon (Li et al., 2019), with highly labile population traits removed from the analyses. Finally, a total of 14 characters were used for prin-cipal components analysis (PCA, Wold et al., 1987). All calculations were performed in the IBM SPSS Statistics v22.0 statistical software package (SPSS, Armonk, NY: IBM Corp).
2.6. BPP and iBPP analyses
Molecular fragments were also used to test species delimitation hypotheses with the model-based species delimitation program BPPX v1.2.2 (Rannala and Yang, 2003; Yang and Rannala, 2010). We used uniform rooted trees that were used as the species model prior, and the parameter set as ancestral population size θ and tree age τ: θ = G(1, 10) and τ = G(1, 10); θ = G(1, 10) and τ = G(2, 2000); θ = G(2, 2000) and τ = G(1, 10); θ = G(2, 2000) and τ = G(2, 2000). The MCMC chains for 5 × 10⁵ generations with parameter samples were taken
every five generations, with a burn-in period of 2 × 10⁵ generations. (Sukumaran and Knowles, 2017; Yang et al., 2019). A joint Bayesian inference based on molecular and morphological data was used to analyse species delimitation hypotheses by integrative Bayesian Phy-logenetics and Phylogeography (iBPP). The parameters θ and τ were also applied in four different prior combinations (as for BPP). A non-informative conjugate prior distribution with parameters ν0 = 0 and
κ0 = 0 was used for the trait variances and ancestral means. The MCMC
chains for 5 × 10⁵ generations with parameter samples were taken
every five generations with a burn-in period of 105 generations (Solis-
Lemus et al., 2015).
3. Results
3.1. The network and phylogeny of cpDNA haplotypes and nrDNA ribotypes
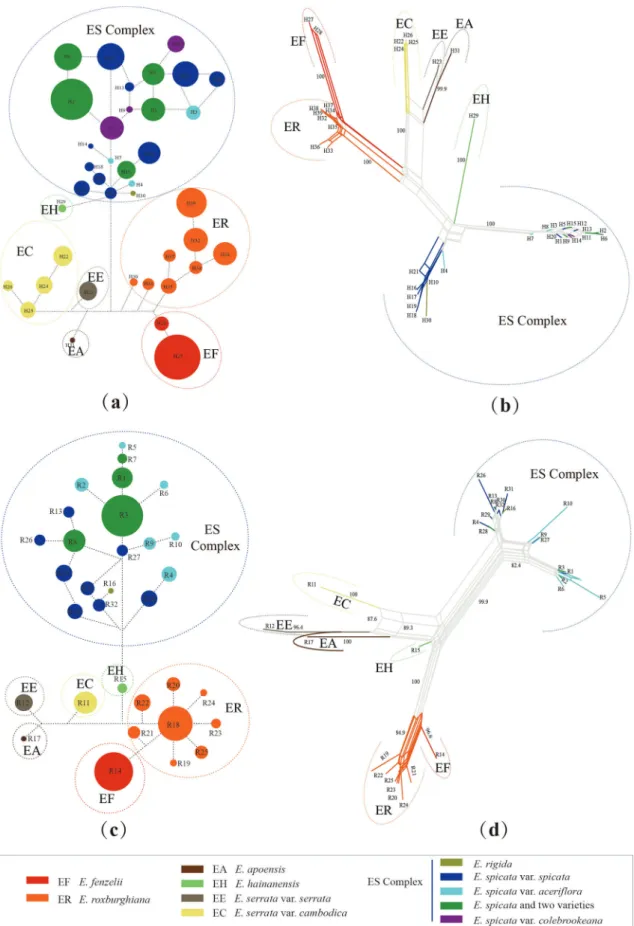
A total of 716 samples were sequenced, and we obtained 687 combined cpDNA sequences and 659 ITS sequences. The five aligned cpDNA spacers consisted of 4647 base pairs and a total of 39 haplotypes were determined from all individuals sampled (Fig. S2). The nrITS consisted of 755 base pairs and 32 ribotypes were determined (Fig. S3). All sequences are deposited in Genbank, and the accession numbers are MN307497—MN307736. The basic haplotype and ribotype informa-tion of the 71 populainforma-tions is summarised in Tables S2 and S9. The re-lationships of E. rigida and E. spicata varieties were more complicated than those of the other taxa (Fig. 2). The geographic distribution of cpDNA haplotypes and nrDNA ribotypes showed E. hainanensis is en-demic to Hainan Island. E. fenzelii is only distributed in the southeast of China. Indonesian endemic species included E. rigida and E. apoensis, whereas the rest of the sampled species were widespread (Figs. S2 and S3).
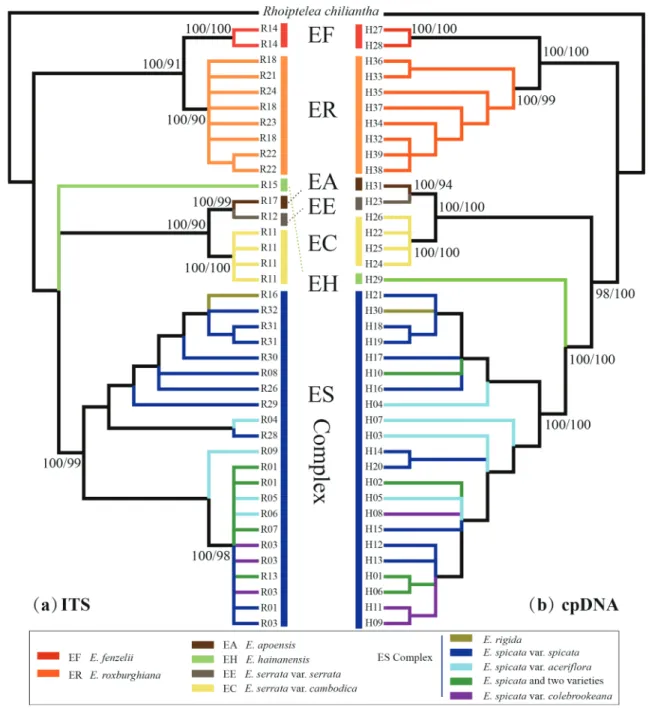
In general, the multi-locus DNA analyses provided a well-resolved phylogenetic backbone for the major clades of Engelhardia. The topol-ogies of the phylogenetic trees based on Bayesian and ML methods were nearly identical (Figs. 3 and S4), with no major topology conflicts be-tween the cpDNA tree and the nrDNA tree, and the results revealed seven clades (Fig. 3). A deep split in the sample identified branches leading to subclades of E. roxburghiana and E. fenzelii as sister lineages, which was distinctive to a larger clade containing the remaining species of Engelhardia. This was well supported in the ITS and cpDNA trees, supporting the subclades of E. roxburghiana and E. fenzelii as two spe-cies. The clades recovered in the ITS and cpDNA analyses indicated that
E. apoensis + E. serrata var. serrata was sister taxon to E. serrata var. cambodica. In contrast, E. spicata var. spicata, E. spicata var. aceriflora, E. spicata var. colebrookeana, and E. rigida formed a complex, intermixed
clade in both analyses. In addition, E. hainanensis was a well-supported sister taxon to the E. spicata complex (Fig. 3).
3.2. Genetic clustering and structure of nSSR
The NJ tree based on 11 microsatellite loci produced similar results to the phylogenetic trees based on cpDNA and nrDNA, with seven clearly defined clades: (1) E. roxburghiana; (2) E. fenzelii; (3) E.
haina-nensis; (4) E. apoensis; (5) E. serrata var. serrata; (6) E. serrata var. cambodica; and (7) the E. spicata var. spicata, E. spicata var. aceriflora, E. spicata var. colebrookeana, and E. rigida complex (Fig. 4). Uneven sampling can often lead to erroneous inferences with respect to hier-archical structure and downward-biased estimates of the true numbers of subpopulations. In particular, distinct subpopulations that have been under-sampled tend to merge together, while individuals from more extensively sampled subpopulations are generally subdivided into more clusters (Puechmaille, 2016). To avoid such errors in sampling bias and clearly identify clades for controversial species, we divided all of the populations into three groups to estimate their genetic structure. The first group included E. roxburghiana and E. fenzelii (Fig. S5 and Table S10). The second group included E. spicata var. spicata, E. spicata var.
aceriflora, E. spicata var. colebrookeana, and E. rigida (Fig. S6 and Table S10). The third group included E. hainanensis, E. apoensis, E. serrata var.
serrata, and E. serrata var. cambodica (Fig. S7 and Table S10). With this division, the structure showed that E. roxburghiana and E. fenzelii were separate species with few gene mixtures between them (Fig. S5). The genetic structure of E. rigida was identical to that of E. spicata var.
spicata, E. spicata var. aceriflora, and E. spicata var. colebrookeana (Fig. S6). E. apoensis and E. serrata var. serrata showed a similar genetic structure. In contrast, E. hainanensis and E. serrata var. cambodica dis-played distinctly different genetic plots (Fig. S7).
3.3. Morphological clustering
Morphological traits from 720 specimens were explored using PCA (Fig. 5a) and Discriminant Analysis (Fig. 5b). The first three principal components identified by PCA accounted for 70.55% of the variation across all characters, with the first principal components explaining 43.49% of the variation (Fig. 5a). The morphological traits aligned to the first PCA axis (with an absolute value score > 0.5) were fruit hairs, inflorescence of old/new branches, terminal/lateral inflorescences, terminal bud hairs, number of leaflets, branchlet hairs, petiole length, leaflet hairs, and leaflet arrangement. The second principal component explained 15.58% of the total morphological information and included the traits were leaflet hairs, leaflet apex, leaflet thickness, and leaflet length/width ratio. The third principal component explained 11.48% of the information and was associated with twigs colour, leaflet arrange-ment, and leaflet margins. The PCA identified seven distinct groups from all species of Engelhardia, in which all species were well-identified except for E. rigida and three varieties of E. spicata. E. roxburghiana was most similar to, but still distinct from E. fenzelii. E. apoensis, E. serrata var. serrata, E. hainanensis, and E. serrata var. cambodica all exhibited clear species boundaries based on these morphological traits (Fig. 5a). In Discriminant Analysis, the Group Centroid showed that the groups were separated from each other except the species of E. rigida and three varieties of E. spicata (Fig. 5b). The analysis of these char-acters produced a good discriminant function, with a total of 88.0% of original grouped cases and 84.8% of cross-validated grouped cases correctly classified (Table S6).
3.4. Species tree inference
The Bayesian species delimitation analyses of the molecular data by BPP. And combined molecular and morphological data were explored by iBPP. These two methods independently gave posterior probabilities of 1.0, indicating strong support for seven species-level clades within
Engelhardia. Regardless of genetic data alone or combined data, the
results supported (1) the separation of E. fenzelii from E. roxburghiana;
Fig. 2. Networks of Engelhardia. (a and c) Estimates from NETWORK. Each circle indicates a single haplotype and ribotype (a and b from cpDNA; c and d from nrITS) sized in proportion to its frequency. (b and d) Estimates from Splits Tree. The number of major branches showing bootstrap support values (> 90% values).
(2) the status as independent species of E. hainanensis, E. apoensis, E. serrata var. serrata, and E. serrata var. cambodica; (3) The combination into a single species, without clear infrataxa, of the others (E. rigida and the three E. spicata varieties) (Fig. 6).
4. Discussion
4.1. Insight into species concepts and delimitation
The modern age of species concepts began with the use of the term ‘concepts’ to describe several different approaches to species identifi-cation (Mayr, 1942). This resulted in a long list of alternative species concepts (Hey et al., 2003). Indeed, just as there are “a thousand Hamlets in a thousand people's eyes”, so it is with the species concepts. Recent decades have also witnessed increasing categories of species concepts and associated debates, including the biological, evolutionary, genetic, phylogenetic species concept, and many others, with Zachos
(2016) reporting 32 widely recognised species concepts. Furthermore, species delimitation has been confused by a problem involving the concept of the species itself, namely that the process of speciation is continuous and will thus create inherently fuzzy boundaries, while in practice clear delineation of boundaries is required (Zachos, 2016).
If nature is discontinuous, species delimitation should be possible to identify limits between clusters of organisms once the organisms have been described as thoroughly as possible (Galtier, 2019). Therefore, using Engelhardia as a case for integrative approaches to species delimi-tation, we would expect to obtain a clearer definition of species bound-aries. However, it has been argued that scientists should not confuse the detection of species with a theoretical understanding of the way in which species exist (de Queiroz, 1998, 2007). This argument points to the dif-ficulties of studying real species, and asserts that the best understanding of species includes recognition acceptance of their indistinct nature. Consequently, it is a challenge separating detection methods from more basic ideas on the existence of species (Hey et al., 2003).
Fig. 3. Bayesian consensus tree based on nrDNA ITS (a; left) and the combined cpDNA haplotypes (b; right). Posterior probability support of Bayesian (before) and bootstrap support values from ML analyses (after) are given above the major branches (> 90% values).
To prevent confusion and simplify classification, particularly with respect to species delimitation of tropical species, we suggest that the concept of subspecies and varieties should be used cautiously. For ex-ample, within Engelhardia, E. serrata has been attributed four varieties and E. spicata three (Manning, 1966). In contrast, our results statisti-cally identified independent or combined lineages, according to a large number of morphological and molecular data analyses. For example, indicating the status of E. serrata var. cambodica as an independent species. Given that cryptic species are sometimes not distinguishable morphologically due to character convergence, and that more than one species may be present in a group with unclear limits between them. Our results suggest that E. rigida, and varieties of E. spicata, should be treated instead as a species complex.
In the study of plant speciation, multiple lines of evidence are ty-pically used to re-rank ambiguous morphological variation, but rarely refer to intraspecific classification (Hong, 2010; Hu et al., 2015; Posso- Terranova and Andrés, 2018). Indeed, identifying and analysing genetic
clusters is a widely accepted approach, however, whether or not they should be called species, subspecies, or populations is often considered to be an uninteresting secondary issue (Galtier, 2019). The species ca-tegory is objective, whereas subspecies and varieties are not, and in-traspecific classifications do not have ontological status as evolutionary units, rendering them as superfluous evolutionary research (Zachos, 2016). Accordingly, we prefer to recognise only species, or species complexes here.
4.2. Mutual utilization and promotion from morphological and molecular data
The cluster numbers of species depend on arbitrary thresholds or parameters (Posso-Terranova and Andrés, 2018). Research on
Lepto-lalax species (Megophryidae) based on extensive geographic and
taxo-nomic sampling showed that molecular data alone could not resolve the number of species (Chen et al., 2018). Based on the hypothetical and Fig. 4. Phylogenetic analyses of the Neighbor-joining method (NJ) based on nSSR. The colours represent different species as in Fig. 2. The coloured backgrounds enclose individuals belonging to the same cluster.
simplified divergence tree presented in Fig. 7, different subdivisions of monophyletic clades can easily alter the number of species. For ex-ample, the following three taxonomic options all allow for monophyly: (1) populations A–B as one species, and populations C–G as one species, are considered as a two-species option (Fig. 7a); (2) populations A–B, population C, population D, and populations E–G representing separate species, are considered as a four-species option (Fig. 7b); and (3) if the branches A–G represent one species each, the clades would indicate a seven-species option (Fig. 7c).
Our genetic data analyses reflected the possible relationships within
Engelhardia. Combining the molecular and morphological characters
refined their results by suggesting species boundaries, such as E.
roxburghiana and E. fenzelii separated into two lineages, while E. spicata
varieties and E. rigida combined as a single species (Figs. 3 and 5). These results have therefore helped to clarify an issue that has plagued species delimitation in Engelhardia for many years and we suggest that adopting integrated approaches from multiple-locus DNA and morphological datasets is the most efficient way to delimit the species boundaries, especially in taxa where traditional approaches have not been effective. The advantage of this approach is that the molecular data provide a basic phylogenetic framework for the re-cognition of lineages, while the addition of morphological data helps to further support the precision and accuracy of systematic and species delimitation.
4.3. Species delimitation in Engelhardia
In this study, the data from the specimens deposited in the herbaria and the large-scale field samples collected throughout the range pro-vide more solid epro-vidence to help resolve the species boundaries in
Engelhardia.
Engelhardia fenzelii has been considered to be a synonym of E. rox-burghiana (Lu et al., 1999; Manning, 1966). However, our results re-vealed that E. fenzelii should be recognised as a clearly separate species based on plastid DNA, ITS region, and nSSR data (Figs. 2–4 and 6). Furthermore, structural analysis showed two independent genetic po-pulation structures (Fig. S5), and Discriminant Analysis and PCA in-dicated that their morphological clusters were distinct (Fig. 5). Al-though both species have similar, terminal inflorescences and glabrous flowers and fruits, E. fenzelii possesses greyish white twigs, 1–2 pairs of leaflets, and 4 (3–6) pairs of secondary veins on each leaflet. The twigs of E. roxburghiana are dark brown or black, with 3–5 pairs of leaflets and 7 (5–13) pairs of secondary leaflet veins (Fig. S5; see also Keren and Lu, 1979). It is worth noting that herbarium specimens generally do not show detailed information such as colour, possibly contributing to the historical combination of these two species. Additionally, the geo-graphical distribution of these two species does not overlap (Fig. 1): E.
fenzelii is restricted to eastern China, while E. roxburghiana is
dis-tributed widely across tropical and subtropical Asia. The classification and phylogenetic relationships within the two species contributed new evidence to distinguish their close affinity, but not their identity (Figs. 2–6). Also, this study contributes new evidence to address the classification of E. roxburghiana (Alfaropsis roxburghiana). The results do expand on the phylogenetic break within the genus, and recognise two basic clades (Figs. 3, 4 and 6).
Engelhardia rigida shared an identical genetic structure, phylogenetic
relationships, network, and morphological characteristics with E.
spi-cata var. spispi-cata (Figs. 2–6 and S6) and their geographic distribution overlaps (Manning, 1966). Indeed, a previous study indicated that the difference between the two species only includes the intangible lengths of fruiting catkins, the number of stamens, and monoecy vs. dioecy, which suggested that E. spicata and E. rigida are the same species. In addition, the specimens of E. rigida collected from New Guinea were identified as E. spicata (Manning, 1966). We found the only apparent differences between samples identified as E. rigida and E. spicata were the size of leaves, flowers and inflorescences (Fig. S6), and these dif-ferences were affected by environmental factors such as rainfall (Dudley, 1996). Therefore, we consider that E. rigida should be syno-nymised with E. spicata.
Engelhardia spicata var. aceriflora and E. spicata var. colebrookeana
used to be considered independent species (Keren and Lu, 1979), but were subsequently maintained as varieties (e.g., Lu et al., 1999). E.
spicata and its infrataxa exhibit highly variable, intergrading
mor-phology without any geographical pattern, leading Jacobs (1960) to suggest that the varieties were of no taxonomic value. Similarly, both Discriminant Analysis and PCA showed that the E. spicata varieties are not supported by morphology (Fig. 5). The species occupies a broad range of habitats and the variation in leaflet morphology reflects this. E. Fig. 5. (a) Scatterplots based on principal component analysis (PCA) scores for
each individual (shown as a dot) evaluated. The coloured and dotted circles enclose individuals belonging to the same component. (b) Canonical dis-criminant analysis. The blue squares represent each group centroid of classifi-cation, and the dots represent off-centre individuals. The list of taxa and colour scheme are the same in (a) and (b). (For interpretation of the references to colour in this figure legend, the reader is referred to the web version of this article.)
spicata var. spicata is a part of evergreen forest tree communities in hilly regions, but during our fieldwork in Indonesia, we found specimens with entire adult leaflets but serrated juvenile ones, similar to those of E. serrata (Fig. S8). In addition, more hirsute leaflets of E. spicata var.
colebrookeana seem to be associated with steep dry slopes on sandy
soils, whereas the thick leathery leaflets of E. spicata var. aceriflora limit the evaporation of water. However, regardless of leaflet morphology, their terminal buds, inflorescences, and fruit are identical. Indeed, the present phylogenetic analyses and species tree inference suggested that all evolved recently (Figs. 3–4 and 6); and the cpDNA and nrDNA data highlight their complex genetic network (Fig. 2). The genetic structure indicates that some E. spicata var. aceriflora populations are related to either E. spicata var. colebrookeana or E. spicata var. spicata (Fig. S6). This morphological complexity seems to indicate repeated divergences with incomplete reproductive isolation and high levels of reticulate interspecific gene flow. As non-monophyly may result from hybridiza-tion, incomplete lineage sorting and/or insufficient genome sampling, we recommend that E. spicata be treated as a species complex that
includes E. spicata var. aceriflora, E. spicata var. colebrookeana, and E.
rigida.
Engelhardia hainanensis, E. apoensis, E. serrata var. serrata, and E. serrata var. cambodica all represent clear, separate evolutionary lineages
(Figs. 2–6, Fig. S7), although E. apoensis was sister to E. serrata in the phylogenetic trees, their morphology is completely different. The leaf-lets of E. apoensis are large, thick, entire, lightly hirsute, oblique at the base, and similar in size on the same branch, whereas E. serrata leaflets are subsessile, serrate, decrease in size distally, and have a lightly hir-sute rachis (Lu et al., 1999; Manning, 1966). Our field observations of E.
apoensis further identified additional unique characteristics, including
convex scales on the leaflet surface (Figs. S1 and S7). The placement of
E. apoensis with E. serrata in the analyses might reflect historical gene
flow between geographically close populations, or small sample size reducing the accuracy of the phylogeny (Edwards and Knowles, 2014). Small sample size is a problem for rare species with narrow distribu-tions (Federman et al., 2018), a distinct possibly since we only found a single population of E. apoensis with two trees, and a total of 14 trees of
E. serrata in our field survey. Actually, low sample sizes have always
restricted understanding of their gene phylogeny, but increasing in the number of samples may support more solid species delimitation. In this study, it is difficult to determine whether each clade represents one species in the phylogenetic trees, which are based on few samples (Fig. 7c). However, better subdivisions of monophyletic clades will increase the accuracy of species delimitation when additional samples are (Fig. 7a). E. hainanensis is endemic to Hainan Island and shows well- differentiated morphology (Fig. 5), phylogenetic clustering (Figs. 2–4), and Bayesian species delimitation (Fig. 6). Structural analysis (Fig. S7) assisted in separating the evolutionary lineage from other Engelhardia. There is also supportive evidence for E. serrata var. cambodica, in-cluding a monophyletic group in the phylogenetic tree (Figs. 2–4, 6) and statistically significant differences in morphologies (Fig. 5), sug-gesting that this variety should be reranked as a species and resumed E.
villosa Kurz (Kurz, 1877). E. villosa was treated as a synonym of E.
serrata var. cambodica (Manning, 1966). According to the International
Code of Nomenclature for algae, fungi, and plants (Turland et al., 2018), and the results from comprehensive analyses in this study, E. villosa should be resumed an independent species.
In summary, the genus Engelhardia contains seven genetically and morphologically supported species, i.e., E. roxburghiana, E. fenzelii, E.
apoensis, the E. spicata complex, E. hainanensis, E. serrata, and E. villosa.
A key to the species of Engelhardia is provided after the Conclusions section.
5. Conclusions
In recent years, modern methods for species delimitation have provided biologists with an increased ability to assess diversity more accurately. However, species delimitation still remains a challenge worldwide, especially in biodiversity hotspots such as tropical and subtropical Asia. An integrative method based on multiple-locus genetic Fig. 6. Schematic of the species delimitation hypotheses inferred. The BPP
analyses used molecular data and the iBPP analyses used combined molecular and morphological data sets. Numbers at each node of the tree represent the posterior probability for that node inferred by BPP (before) and iBPP analyses (after). The numbers from upper to lower correspond to analyses with the four different priors: θ = G(1, 10) and τ = G(1, 10); θ = G(1, 10) and τ = G(2, 2000); θ = G (2, 2000) and τ = G(1, 10); θ = G(2, 2000) and τ = G(2, 2000). The E. spicata complex includes E. spicata var. spicata, E. spicata var. aceriflora, E. spicata var. colebrookeana, and E. rigida.
Fig. 7. A hypothetical and simplified flow chart for phylogenetic analyses based on DNA haplotype. A–G are operational taxonomic units. Three taxonomic options allow for monophyly: (a) denotes a two-species option; (b) denotes a four-species option; (c) denotes a seven-species option.
data and morphological analyses was used to delimit seven species within Engelhardia. Four species (E. hainanensis, E. apoensis, E. serrata, and E. roxburghiana) retain their current taxonomic status. E. fenzelii is resurrected from E. roxburghiana, and E. spicata is expanded to become a variable species complex to include E. spicata var. aceriflora, E. spicata var. colebrookeana, and E. rigida. Finally, E. serrata var. cambodica is re- ranked as an independent species. This study further highlights the importance of mutual utilization and promotion of morphological and molecular data. That is, morphological statistics can be used to solve the problem of defining criteria suitable for evaluation within a phy-logenetic framework without defined lineages. Also, our study suggests that the recognition of infraspecific taxa should be done with caution in order to simplify classifications and prevent confusion. Specifically, re- ranking or combining subspecies and/or varieties may, in some cases, enable more accurate species delimitation.
Key to the species of Engelhardia
1. Inflorescences terminal; pistillate flowers and fruits glabrous, prominently stalked; bracts at fruit base; terminal bud glabrous, comb-like; leaves evergreen; leaflets entire, glabrous, conspicuously stalked.
2. Twigs dark brown or black; leaflets usually 3–5 pairs, the majority shortly acu-minate at apex, the secondary leaflet veins 7(5–13) pairs. ……….. ……….….E. roxburghiana
2. Twigs grayish white; leaflets only 1–2 pairs; the majority acuminate at apex; the secondary leaflet veins 4 (3–6) pairs.
……….……….………….….E. fenzelii 1. Inflorescences lateral; pistillate flowers and at least the base of fruit hairy, typically
subsessile; bracts cover the fruit; terminal bud hirsute; leaves evergreen or dec-iduous; leaflets serrate or entire, glabrous or hirsute, stalked or sessile. 3. Leaflets entire, lightly hirsute, elliptic at apex, oblique at base; similar leaflet size
on same branch…….…...E. apoensis
3. Leaflets entire or serrate, glabrous or hirsute, acuminate or elliptic at apex, rou-nded or oblique at base; the lower leaflets reduced in size or gradually becoming smaller.
4. Leaflets usually entire or serrate just in the sapling, somewhat variable in size and shape, glabrous to densely hirsute, acuminate or elliptic at apex, usually the l-ower leaflets reduced in size. ……….…...…E. spicata complex
4. Leaflets serrate, glabrous or hirsute, acuminate at apex, leaflets gradually beco-ming smaller or lower leaflets strongly reduced in size.
5. Leaflets sessile, glabrous to slightly pubescent along midvein abaxially; lower le-aflets strongly reduced in size; branchlet glabrous..
……….E. hainanensis
5. Leaflets sessile or subsessile; glabrous or hirsute; leaflets gradually becoming s-maller; branchlet hirsute.
6. Leaflets sessile, glabrous, branchlet lightly hirsute; the secondary leaflet veins 7-(6–10) pairs.
………E. serrata
6. Leaflets sessile or subsessile, densely hirsute, branchlet densely hirsute; the seco-ndary leaflet veins 6 (5–10) pairs….…... E. villosa
CRediT authorship contribution statement
Can-Yu Zhang: Conceptualization, Investigation, Writing - original draft, Writing - review & editing, Visualization. Shook Ling Low: Investigation, Writing - review & editing. Yi-Gang Song: Writing - re-view & editing. Nurainas: Investigation, Resources. Gregor Kozlowski: Writing - review & editing. Truong Van Do: Investigation, Resources. Lang Li: Investigation, Resources. Shi-Shun Zhou: Investigation, Resources. Yun-Hong Tan: Writing - review & editing. Guan-Long Cao: Investigation, Resources. Zhuo Zhou: Investigation, Resources. Hong-Hu Meng: Conceptualization, Investigation, Writing - original draft, Writing - review & editing, Supervision. Jie Li: Conceptualization, Writing - review & editing, Supervision.
Declaration of Competing Interest
The authors declare that they have no known competing financial interests or personal relationships that could have appeared to
influence the work reported in this paper. Acknowledgements
Many thanks to the following people for their kind help in this study: Dr John Conran for English language revision, Ismail, Dasriel Effendi, and Harry for assistance in the field, Dr Richard Chung-Cheng Kong for access to digital herbarium specimens, and Xiao-Long Jiang, Bin Tian, Jian-Li Zhao, Li Li, Wu-Mei Xu, Yong-Ling Yin, Xiu-Yan Feng, Hang-Hui Kong, Han-Yang Lin, Jian-Hua Xiao, Chao-Nan Cai, Zhi-Fang Liu, and Jian-Lin Hu for assistance with data collection and analysis. This work was supported by the National Natural Science Foundation of China (No. 41701056); Yunnan Fundamental Research Projects (No. 2018FB032); Southeast Asia Biodiversity Research Institute, Chinese Academy of Sciences (No. Y4ZK111B01); Youth Innovation Promotion Association, Chinese Academy of Sciences (No. 2018432); the CAS “Light of West China” Program; and the Program of the Chinese Academy of Sciences (No. 2017XTBG-T03).
Appendix A. Supplementary material
Supplementary data to this article can be found online at https:// doi.org/10.1016/j.ympev.2020.106918.
References
Bai, W.N., Wang, W.T., Zhang, D.Y., 2014. Contrasts between the phylogeographic pat-terns of chloroplast and nuclear DNA highlight a role for pollen-mediated gene flow in preventing population divergence in an East Asian temperate tree. Mol.
Phylogenet. Evol. 81, 37–48.
Bandelt, H.J., Forster, P., Röhl, A., 1999. Median-joining networks for inferring
in-traspecific phylogenies. Mol. Biol. Evol. 16, 37–48.
Carstens, B.C., Satler, J.D., 2013. The carnivorous plant described as Sarracenia alata
contains two cryptic species. Biol. J. Linn. Soc. 109, 737–746.
Chen, J.M., Poyarkov, N.A., Suwannapoom, C., Lathrop, A., Wu, Y.H., Zhou, W.W., Yuan, Z.Y., Jin, J.Q., Chen, H.M., Liu, H.Q., et al., 2018. Large-scale phylogenetic analyses provide insights into unrecognized diversity and historical biogeography of Asian leaf-litter frogs, genus Leptolalax (Anura: Megophryidae). Mol. Phylogenet. Evol. 124, 162–171.
Costello, M.J., May, R.M., Stork, N.E., 2013. Can we name earth's species before they go
extinct? Science 339, 413–416.
Damasco, G., Daly, D.C., Vicentini, A., Fine, P.V.A., 2019. Reestablishment of Protium
cordatum (Burseraceae) based on integrative taxonomy. Taxon 68, 34–46.
Darwin, C., 1859. On the origin of species, first ed. Cambridge University Press,
Cambridge, UK.
de Queiroz, K., 1998. The general lineage concept of species, species criteria, and the process of speciation: a conceptual unification and terminological recommendations.
Oxford University Press, Oxford, UK, pp. 57–75.
de Queiroz, K., 2005. Ernst Mayr and the modern concept of species. Proc. Natl. Acad. Sci.
USA 102, 6600–6607.
de Queiroz, K., 2007. Species concepts and species delimitation. Syst. Biol. 56, 879–886.
Dong, W.P., Xu, C., Li, W.Q., Xie, X.M., Lu, Y.Z., Liu, Y.L., Jin, X.B., Suo, Z.L., 2017. Phylogenetic resolution in Juglans based on complete chloroplast genomes and
nu-clear DNA sequences. Front. Plant Sci. 8, 1148.
Dudley, S.A., 1996. Differing selection on plant physiological traits in response to
en-vironmental water availability: a test of adaptive hypotheses. Evolution 50, 92–102.
Earl, D., von Holdt, B., 2012. STRUCTURE HARVESTER: a website and program for vi-sualizing STRUCTURE output and implementing the Evanno method. Conserv. Genet.
Resour. 4, 359–361.
Edwards, D.L., Knowles, L.L., 2014. Species detection and individual assignment in spe-cies delimitation: can integrative data increase efficacy? Proc. R. Soc. B 281,
20132765.
Federman, S., Donoghue, M.J., Daly, D.C., Eaton, D.A., 2018. Reconciling species
di-versity in a tropical plant clade (Canarium, Burseraceae). PLoS One 13, 1–20.
Galtier, N., 2019. Delineating species in the speciation continuum: A proposal. Evol. Appl. 12, 657–663.
Goodwin, Z.A., Harris, D.J., Filer, D., Wood, J.R., Scotland, R.W., 2015. Widespread
mistaken identity in tropical plant collections. Curr. Biol. 25, R1066–R1067.
Hermsen, E., Gandolfo, M.A., 2016. Fruits of Juglandaceae from the Eocene of South
America. Syst. Bot. 41, 316–328.
Hey, J., Waples, R.S., Arnold, M.L., Butlin, R.K., Harrison, R.G., 2003. Understanding and confronting species uncertainty in biology and conservation. Trends Ecol. Evol. 18, 597–603.
Hong, D.Y., 2010. Peonies of the World: Taxonomy and Phytogeography. Royal Botanic
Garden Kew and Missouri Botanical Garden Press. London and St, Louis.
Hu, H., Alshehbaz, I.A., Sun, Y.S., Hao, G.Q., Wang, Q., Liu, J.Q., 2015. Species delimi-tation in Orychophragmus (Brassicaceae) based on chloroplast and nuclear DNA
barcodes. Taxon 64, 714–726.
Huelsenbeck, J.P., Ronquist, F., 2001. MRBAYES: Bayesian inference of phylogenetic
trees. Bioinformatics 17, 754–755.
Huson, D.H., Bryant, D., 2006. Application of phylogenetic networks in evolutionary studies. Mol. Biol. Evol. 23, 254–267.
Iljinskaya, I.A., 1993. Alfaropsis, a new genus of the Juglandaceae. Bot. Zhurn. 78, 79–83.
Jacobs, M., 1960. Juglandaceae. Flora Malesiana I (6), 143–154.
Keren, K., Lu, A.M., 1979. Juglandaceae. Flora of China, Chinese version, Science Press, Beijing 21, 6–44.
Kozlowski, G., Bétrisey, S., Song, Y.G., 2018. Wingnuts (Pterocarya) & walnut family. Relict trees: linking the past, present and future. Natural History Museum Fribourg, Switzerland.
Kurz, W.S., 1877. Forest Flora of British Burma 2, 491.
Li, Y.C., Wen, J., Ren, Y., Zhang, J.Q., 2019. From seven to three: Integrative species delimitation supports major reduction in species number in Rhodiola section Trifida
(Crassulaceae) on the Qinghai-Tibetan Plateau. Taxon 68, 268–279.
Liu, K., Muse, S.V., 2005. PowerMarker: an integrated analysis environment for genetic
marker analysis. Bioinformatics 21, 2128–2129.
Lu, A.M., Stone, D.E., Grauke, L.J., 1999. Juglandaceae. Flora of China, Science Press,
Beijing; Missouri Botanical Garden Press. St. Louis 4, 278–280.
Manchester, S.R., 1987. The fossil history of the Juglandaceae. Ann. Mo. Bot. Gard. 21, 1–137.
Manchester, S.R., Collinson, M.E., Goth, K., 1994. Fruits of the Juglandaceae from the Eocene of Messel, Germany, and implications for Early Tertiary phytogeographic exchange between Europe and Western North America. Int. J. Plant Sci. 155, 388–394.
Manning, W.E., 1966. New combinations and notes on Engelhardia (Juglandaceae) of the
Old World. Bull. Torrey Bot. Club 93, 34–52.
Manos, P.S., Soltis, P.S., Soltis, D.E., Manchester, S.R., Oh, S.H., Bell, C.D., Dilcher, D.L., Stone, D.E., 2007. Phylogeny of extant and fossil Juglandaceae inferred from the
integration of molecular and morphological data sets. Syst. Biol. 56, 412–430.
Manos, P.S., Stone, D.E., 2001. Evolution, phylogeny, and systematics of the
Juglandaceae. Ann. Mo. Bot. Gard. 88, 231–269.
Mayr, E., 1942. Systematics and Origin of Species. Columbia University Press, New York.
Mayr, E., 1982. The growth of biological thought: diversity, evolution, and inheritance.
Belknap Press of Harvard University Press, Cambridge, Massachusetts.
Meng, H.H., Su, T., Huang, Y.J., Zhu, H., Zhou, Z.K., 2015. Late Miocene Palaeocarya (Engelhardieae: Juglandaceae) from southwest China and its biogeographic im-plications. J. Syst. Evol. 53, 499–511.
Miller, M.A., Pfeiffer, W., Schwartz, T., 2010. Creating the CIPRES Science Gateway for
inference of large phylogenetic trees. In: grid computing environments.
Misiewicz, T.M., Fine, P.V.A., 2014. Evidence for ecological divergence across a mosaic of soil types in an Amazonian tropical tree: Protium subserratum (Burseraceae). Mol.
Ecol. 23, 2543–2558.
Peakall, R., Smouse, P.E., 2012. GenAlEx 6.5: genetic analysis in Excel. Population genetic
software for teaching and research-an update. Bioinformatics 28, 2537–2539.
Posada, D., Crandall, K.A., 1998. Modeltest: testing the model of DNA substitution.
Bioinformatics 14, 817–818.
Posso-Terranova, A., Andrés, J., 2018. Multivariate species boundaries and conservation
of harlequin poison frogs. Mol. Ecol. 27, 3432–3451.
Prata, E.M.B., Sass, C., Rodrigues, D.P., Domingos, F.M., Specht, C.D., Damasco, G., Ribas, C.C., Fine, P.V.A., Vicentini, A., 2018. Towards integrative taxonomy in Neotropical botany: disentangling the Pagamea guianensis species complex (Rubiaceae). Bot. J.
Linn. Soc. 188, 213–231.
Pritchard, J.K., Wen, X.Q., Falush, D., 2003. Documentation for STRUCTURE software. version 2.3.
Puechmaille, S.J., 2016. The program structure does not reliably recover the correct population structure when sampling is uneven: subsampling and new estimators
al-leviate the problem. Mol. Ecol. Resour. 16, 608–627.
Rannala, B., Yang, Z.H., 2003. Bayes estimation of species divergence times and ancestral
population sizes using DNA sequences from multiple loci. Genetics 164, 1645–1656.
Rozas, J., Ferrermata, A., Sanchezdelbarrio, J.C., Guiraorico, S., Librado, P.,
Ramosonsins, S.E., Sanchezgracia, A., 2017. DnaSP 6: DNA sequence polymorphism analysis of large data sets. Mol. Biol. Evol. 34, 3299–3302.
Schluter, D., Clifford, E.A., Nemethy, M., Mckinnon, J.S., 2004. Parallel evolution and
inheritance of quantitative traits. Am. Nat. 163, 809–822.
Sidiyasa, K., 2015. Jenis-Jenis Pohon Endemik Kalimantan. Balai penelitian teknologi konservasi sumber daya alam. 56.
Solis-Lemus, C., Knowles, L.L., Ane, C., 2015. Bayesian species delimitation combining
multiple genes and traits in a unified framework. Evolution 69, 492–507.
Song, Y.G., Fragnière, Y., Meng, H.H., Li, Y., Bétrisey, S., Corrales, A., Manchester, S., Deng, M., Jasińska, A., Văn Sâm8, H., Kozlowski, G., 2020. Global biogeographic synthesis and priority conservation regions of the relict tree family Juglandaceae. J. Biogeogr. 47, 643–657.
Stone, D.E., Oh, S., Tripp, E.A., Ríos G, L.E., Manos, P.S., 2009. Natural history, dis-tribution, phylogenetic relationships, and conservation of Central American black walnuts (Juglans sect. Rhysocaryon). J. Torrey Bot. Soc. 136, 1–25.
Stone, D.E., 2010. Review of New World Alfaroa and Old World Alfaropsis (Juglandaceae).
Novon 20, 215–224.
Su, X., Wu, G.L., Li, L.L., Liu, J.Q., 2015. Species delimitation in plants using the Qinghai- Tibet Plateau endemic Orinus (Poaceae: Tridentinae) as an example. Ann. Bot. 116, 35–48.
Sukumaran, J., Knowles, L.L., 2017. Multispecies coalescent delimits structure, not
spe-cies. Proc. Natl. Acad. Sci. USA 114, 1607–1612.
Swofford, D.L., 2002. PAUP*. Phylogenetic analysis using parsimony (and other
methods). Version 4.0b10.
Turland, N.J., Wiersema, J.H., Barrie, F.R., Greuter, W., Hawksworth, D.L., Herendeen, P.S., Knapp, S., Kusber, W.H., Li, D.Z., Marhold, K., et al., 2018. International Code of Nomenclature for algae, fungi, and plants (Shenzhen Code). Koeltz Botanical Books, Glashütten.
Ulloa, C.U., Acevedorodriguez, P., Beck, S., Belgrano, M.J., Bernal, R., Berry, P.E., Brako, L., Celis, M., Davidse, G., Forzza, R.C., et al., 2017. An integrated assessment of the
vascular plant species of the Americas. Science 358, 1614–1617.
Wiens, J.J., 2007. Species delimitation: new approaches for discovering diversity. Syst. Biol. 56, 875–878.
Wold, S., Esbensen, K., Geladi, P., 1987. Principal component analysis. Chemometr. Intell. Lab. 2, 37–52.
Yang, L.H., Kong, H.H., Huang, J.P., Kang, M., 2019. Different species or genetically divergent populations? Integrative species delimitation of the Primulina hochiensis
complex from isolated karst habitats. Mol. Phylogenet. Evol. 132, 219–231.
Yang, Z.H., Rannala, B., 2010. Bayesian species delimitation using multilocus sequence
data. Proc. Natl. Acad. Sci. USA 107, 9264–9269.
Zachos, F.E., 2016. Species Concepts in Biology. Historical Development, Theoretical Foundations and Practical Relevance. Springer International Publishing, Cham, Switzerland.
Zhao, P., Zhou, H.J., Potter, D., Hu, Y.H., Feng, X.J., Dang, M., Feng, L., Zulfiqar, S., Liu, W.Z., Zhao, G.F., Woeste, K., 2018. Population genetics, phylogenomics and hybrid speciation of Juglans in China determined from whole chloroplast genomes, tran-scriptomes, and genotyping-by-sequencing (GBS). Mol. Phylogenet. Evol. 126,
250–265.