HAL Id: hal-01101162
https://hal.archives-ouvertes.fr/hal-01101162
Submitted on 8 Jan 2015
HAL is a multi-disciplinary open access
archive for the deposit and dissemination of
sci-entific research documents, whether they are
pub-lished or not. The documents may come from
teaching and research institutions in France or
abroad, or from public or private research centers.
L’archive ouverte pluridisciplinaire HAL, est
destinée au dépôt et à la diffusion de documents
scientifiques de niveau recherche, publiés ou non,
émanant des établissements d’enseignement et de
recherche français ou étrangers, des laboratoires
publics ou privés.
Post-electronic irradiation measurements by PEA and
FLIMM methods on dielectric films
Xuan Truong Nguyen, S. Bouchareb, Virginie Griseri, Laurent Berquez
To cite this version:
Xuan Truong Nguyen, S. Bouchareb, Virginie Griseri, Laurent Berquez. Post-electronic irradiation
measurements by PEA and FLIMM methods on dielectric films. Electrical Insulation and Dielectric
Phenomena (CEIDP), Oct 2011, Cancun, Mexico. pp.812-815, �10.1109/CEIDP.2011.6232780�.
�hal-01101162�
Post-Electronic Irradiation Measurements by PEA
and FLIMM Methods on Dielectric Films
T. X. Nguyen, S. Bouchareb, V. Griseri, L. Berquez
Université de Toulouse, UPS, INP, LAPLACE (Laboratoire Plasma et Conversion d'Energie), 118 route de Narbonne, F-31062, Toulouse cedex 9, France
Abstract-Dielectric materials are frequently used in satellite’s
structure and especially as thermal blanket which are protecting the electronic devices embarked. Their behavior in relation to an electronic irradiation due to space environment must be clearly defined in order to prevent electrostatic discharges. Such discharges can be very harmful for the equipment. To study these materials an irradiation chamber called ‘Matspace’ has been built in the laboratory. In this study, we will focus our work on the analysis of electron behavior post irradiation in PolyTetraFluoroEthylene films of various thicknesses as they are storing charges for long period of time and they are widely employed in space industry. Space charge distribution will be recorded by mean of two complementary techniques: the Pulsed Electro-Acoustic method and the Focused Laser Intensity Modulated Method.
I. INTRODUCTION
Dielectric materials that are used in space industry can be subject to electrostatic discharges once the quantity of injected charges surpasses a critical amount [1]. In order to prevent such phenomena, studies on electron injection effect in polymeric materials need to be performed in laboratory. To do so, we decided to use several techniques of space charge detections to characterize some samples post-irradiation. Therefore measurements on PolyTetraFluoroEthylene (PTFE) performed by Pulse Electro-Acoustic (PEA) device and Focused Laser Intensity Modulated Method (FLIMM) will be presented in this paper. As it will be shown, PEA is more efficient when charges are located in the bulk whereas FLIMM is more accurate when charges are remaining close to the surface. The complementarities of both techniques will be also demonstrated. To characterize the electron beam several simple tools have been installed in the chamber and will be introduced in the next part.
II. EXPERIMENTALS SET-UPS
A. The Irradiation Chamber: MATSPACE
The irradiation chamber called ‘MATSPACE’ is made of a
vacuum chamber (Φ 500 mm, x 700mm) and a thermionic
electron gun that can produce electrons up to 100 kV (Fig. 1). The source delivers electrons in the vertical direction. The sample holder is located perpendicularly to the beam. In an area of about 10 cm diameter the irradiation can be considered to be homogeneous. The spreading of the beam is realized by the electromagnetic lens. Several samples can be irradiated
simultaneously and then analyzed by various tools. The vacuum maintained in the chamber during irradiation is of about 10-6 mbar. Filament (0 – 2 A) Bias resistor 0 – 100 kV Earth potential Wehnelt cylinder Crossover Anode Coated sample For FLIMM studies Non-coated sample for PEA studies Sample holder 10 cm Electron flux collecting electrode position Electromagnetic lens
Sample holder top view
Fig. 1. Schematic representation of the thermionic electron gun and sample holder arrangement in the irradiation chamber ‘MATSPACE’.
B. Space Charge Measurement Set-ups
In this work two methods have been selected to study the space charge distribution post-irradiation in the air. We will show that they supply complementary information. As soon as the irradiation was over, the chamber is open and the two samples are analyzed simultaneously by :
- The classic Pulsed Electro-Acoustic (PEA) device [2-3] which is composed of a pulse generator (50-400 V, 400 Hz) delivering pulses of 9 ns width, a detection system using a Poly-Vinylidene Fluoride (PVDF) transducer (9 nm thick, g33 = 216.10-3 V.m/N) to transform the acoustic wave in
electric signal, two 30 dB amplifiers and a Digital Storage Oscilloscope (Lecroy) connected to a computer. The reference signal that is necessary for the mathematical treatment is always recorded on the sample previous irradiation. No samples treatments are required.
- The Focused Laser Intensity Modulated Method (FLIMM) cell [4] that consists of irradiating the surface of a sample using an intensity modulated laser diode (45 mW, 658 nm). The laser beam induces a non-uniform thermal gradient in the bulk. Under the effect of the thermal wave a pyroelectric current due to the presence of space charge is created. A low noise preamplifier converts the current into voltage then the signal is extracted from the noise by a lock in amplifier. A mathematical deconvolution treatment is used to recover the space charge profile. Previous sample irradiation, two 16 mm
diameter gold metalized electrodes of about 30 nm-thick are coated on each side. The pyroelectric current depends on the laser beam modulation frequency, the local temperature in the sample and the charge function due to space charge or polarization. The current I (A) is described in the following equation:
I(f)=j.2π.f.A/L ∫ r(z).T(z,f).dz (1)
0 L
R(z)=p(z)-(αx-αε).ε.ε0.E(z) (2) With f (Hz) the frequency, A (m 2) the thermal spot size, L (m) the thickness, T(Z, f) (K) the simulated temperature, r(z) (C.m-3) the total charge, p(z) (C.m-3.K-1) the pyroelectric
coefficient, E(z) (V.m -1) the internal electric field, α
x αε (K-1)
the dependencies of the local expansions and the electric permittivity with the temperature in the bulk.
C. Electron flux control system
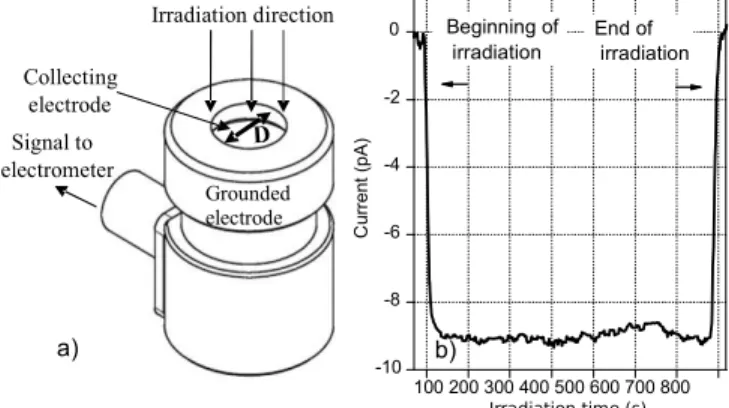
The beam flux is controlled during the irradiation by recording the current on a picoamperemeter which is connected to an electrode located in a faraday cage arrangement (Fig. 2.a). The quantity of electric charge Q (C) is obtained by integrating the area below the curve that represents the recorded current versus time. The collecting zone is of about 5.2 mm diameter (area S=21.23 mm2). It is therefore possible to define the amount of charges reaching the sample by dividing the electric charge Q by the collecting area S. It is also useful to determine the flux intensity by dividing the mean current collected by the area S. An example of measurement is given in fig. 2.b.
100 200 300 400 500 600 700 800 -10 -8 -6 -4 -2 0 Beginning of irradiation C ur re nt ( pA ) Irradiation time (s) End of irradiation b) a) Signal to electrometer Irradiation direction Grounded electrode Collecting electrode
Fig. 2. a) Electron collecting electrode in a Faraday cage arrangement used to determine the flux of the electron beam. b) Current detected by the electron
flux control system versus time during the irradiation under 90 kV.
III. RESULTS AND DISCUSSION
A. Experimental Protocol
Before sample irradiation, the electron beam energy and the flux deliver need to be settled. The energy is controlled by the applied voltage between the tungsten filament and the anode (Fig.1). The flux is controlled by collecting the current as presented in the previous section. However we found convenient to use a phosphorescent screen that allows us to control the size and the homogeneity of the irradiated area especially when the energy of the beam is modified.
For each experiment two PTFE samples of various thicknesses have been selected. For the PEA studies samples of 200 µm have been selected whereas sample of 100 µm were required for the FLIMM experiments.
All the irradiations have been performed for 10 min under vacuum. The irradiations conditions are reported in table I. Just after the irradiation, samples are brought back to atmospheric pressure and the space charge distribution measured simultaneously by PEA and FLIMM.
B. Current Measurements
In each case, the current detected by the electrode is characterized by a steep slope at the beginning and at the end of the irradiation (Fig. 2.b). The current remain quite stable during the whole irradiation period. However it was quite difficult to keep the same flux intensity for all the tests. This could eventually be adjusted by modifying the size of the irradiated area acting on the electromagnetic lens.
C. Space Charge Measurements Results obtained by PEA
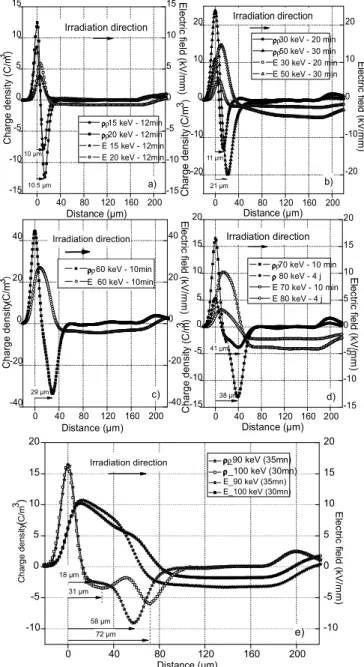
In all the cases, space charge profiles recorded by PEA show one negative peak due to the injected charges in the bulk and two positive peaks of induced charges at the interface sample/electrode. The amplitude of the peaks depends on the amount of injected charges that varies with the irradiation flux intensity. As expected, the position of the negative peak is directly linked with the electron beam energy.
In the range 0-100 keV we observe three types of charge profile. Between 15 and 50 keV the peak maximum is shifted from 10 to 21 µm (table I). The negative peak of injected charges is detected near the irradiated surface and nearly all the positive induced charges are detected on the same side (Fig. 3.a and 3.b). Due to the configuration it is difficult to separate the positive and negative charges that are located in the vicinity of the interface sample/electrode [5]. Actually, the flux of the 15 and 20 keV electron beam are higher than
100 pA/cm2 whereas the flux of the 30 keV electron beam is
of about 34 pA/cm2 and despite this large discrepancy the
negative charge profile remains in the same order of amplitude as seen in fig. 3.a. The same flux was used during the irradiation under 50 and 60 keV and the charge profile detected in the second case is higher in amplitude (Fig. 3.b and 3.c). We can see that the peak of charge is shifted toward the bulk and seems to be fully revealed.
When the energy is increased the peak due to the negative charges is detected deeper in the bulk and it becomes easier to distinguish the positive and negative charges that are therefore no so close. At first sight, it seems that during the irradiation charges are stored in the whole irradiated area Fig. 3.d. Actually a shoulder in the charge profile corresponding to the injected charges appears near the surface above 70 keV and two peaks are clearly detected in the bulk when 100 keV electrons are injected (Fig. 3.e). This means that the electron beam delivers two groups of electrons of different energy. The energy of the electrons that are stored in the peak located near the surface is estimated to be of about 60 keV. The maximum of this first peak is detected at about 31 µm from the surface.
The presence of two batches of electrons with various energies is not expected as the electron beam is supposed to be quasi-mono-energetic. It is suspected that there are some reflections of a part of the beam on the chamber wall that could explain the presence of lower energetic electrons.
0 40 80 120 160 200 -15 -10 -5 0 5 10 15 10.5 µm C ha rg e de ns ity ( C /m 3 ) E le ctr ic fie ld (k V /m m ) Distance (µm) 15 keV - 12min 20 keV - 12min E 15 keV - 12min E 20 keV - 12min Irradiation direction 10 µm a) -15 -10 -5 0 5 10 15 0 40 80 120 160 200 -40 -20 0 20 40 60 keV - 10min E 60 keV - 10min E le ctr ic fie ld (k V /m m ) C ha rg e de ns ity (C/m 3) Distance (µm) Irradiation direction 29 µm -40 -20 0 20 40 c) 0 40 80 120 160 200 -15 -10 -5 0 5 10 15 20 C ha rg e de n si ty ( C /m3 ) E le ctr ic fie ld (k V /m m ) Distance (µm) 70 keV - 10 min 80 keV - 4 j E 70 keV - 10 min E 80 keV - 4 j Irradiation direction d) -15 -10 -5 0 5 10 15 20 38 µm 41 µm 0 40 80 120 160 200 -20 -10 0 10 20 b) E le ctr ic fie ld (k V /m m ) C ha rg e de ns ity ( C /m 3) Distance (µm) 30 keV - 20 min 50 keV - 30 min E 30 keV - 20 min E 50 keV - 30 min Irradiation direction 21 µm 11 µm -20 -10 0 10 20 0 40 80 120 160 200 -10 -5 0 5 10 15 20 31 µm 18 µm C h ar g e de ns ity( C /m 3 ) E le ctr ic fie ld (k V /m m ) Distance (µm) _90 keV (35mn) _100 keV (30mn) E_90 keV (35mn) E_100 keV (30mn) Irradiation direction 58 µm 72 µm -10 -5 0 5 10 15 20 e)
Fig. 3. Charge density (ρ) and electric field (E) profiles detected by PEA post irradiation under a) 15-20 keV, b) 30-40-50 keV, c) 60 keV, d) 70-80 keV, e)
90-100 keV on PTFE 200 µm thick samples.
Results obtained by FLIMM
Just after irradiation samples were positioned in the FLIMM cell and the pyroelectric currents recorded. The real and imaginary parts of these currents are collected then they are deconvoluted to obtain the charge density profiles.
In Fig. 4.a we can see the shape of the experimental currents and the calculated ones in the case of the PTFE irradiated under 30 keV. The charge profile deduced is shown in Fig. 4.b. We can see a negative charge distribution that is due to the injected electrons. The two peaks observed at about 6
and 12.5 µm seem to show that the particles introduced in the material belongs to two groups of electrons with different energies as already mentioned before. The peaks at the surface and in the bulk could be due to the deconvolution treatment and should not be considered. The signal is rather flat in the bulk above about 40 µm that is the limit of detection by FLIMM that is why the signal won’t be presented above this distance in some figure.
100 1000 10000 -0,5 -0,4 -0,3 -0,2 -0,1 0,0 0,1 F LI M M c u rr en ts ( pA ) Frequency(Hz) Ireal Iimag Ireal Iimag Experimental Calculated a) 0 20 40 60 80 100 -30 -20 -10 0 10 20 30 40 C ha rg e de n si ty (C /m3 ) Distance(µm) 30 keV Irradiation direction b)
Fig. 4. Data obtain by FLIMM measurements on a PTFE 100 µm thick sample after an irradiation of 30 keV during 10 min. a) FLIMM currents, b) Charge
density profile.
The space charge distribution in the case of the 40 and 50 keV electron beam is similar to the one detected after the 30 keV irradiation (Fig. 5). The peaks position is shifted to the bulk proportionally to the irradiation energy. The second peaks detected after the 40 and 50 keV irradiation have been detected respectively at about 15 and 20 µm. This result is in good agreement with those obtained by PEA (Table I).
The space charge distribution recorded on the 15 keV irradiated sample show a single peak that correspond to the first one located at about 7 µm (Fig. 6.a). The first peak is not detected; it might be too close to the surface.
On the contrary after the 60 keV electron beam irradiation only the first peak is detected at about 9 µm (Fig. 6.b). According to the PEA results the second peak is expected to be located at about 29 µm which is out of the resolution limit of the FLIMM method.
0 10 20 30 40 50 -250 -200 -150 -100 -50 0 50 100 6,5 µm C ha rg e D e ns ity ( C /m 3 ) Distance (µm) 40 keV 50 keV 11 µm 15 µm 20 µm
Fig. 5. Data obtain by FLIMM measurements on a PTFE 100 µm thick sample after an irradiation during 10 min under 40 and 50 keV.
0 10 20 30 40 -80 -60 -40 -20 0 20 40 60 C ha rg e D en si ty ( C /m 3) Distance (µm) 15 keV ~ 7 µm a) 0 10 20 30 40 50 60 -50 -40 -30 -20 -10 0 10 20 b) Distance (µm) 60 keV ~ 9 µm
Fig. 6. Data obtain by FLIMM measurements on a PTFE 100 µm thick sample after an irradiation during 10 min under a) 15 keV, b) under 60 keV.
Above 60 keV the first and second peaks are too deep in the
bulk to be recorded by FLIMM. That is why no results are presented in that case.
C. Comparison with theoretical data
Experimentally we have seen that the penetration depth of the electrons depends on the energy. It is directly dependent on the electron-material interaction phenomena that can be reached by various simulation methods. In this paper, we are using the results provided by ESTAR program available
online [6]. The calculation is based on the Continuous
Slowing Down Approximation (CSDA) that represents the path length that an electron would cross when slowing down from its original energy to a stop.
The maximum penetration depth estimated by ESTAR and PEA, the first and second peaks position obtained by PEA and FLIMM are given in table I and plotted in Fig. 7. It is observed that in all cases, the second peak position correspond to the ESTAR data. From PEA data it seems that electrons go further in the bulk than predicted with ESTAR. This could be due to the resolution but it is important to notice that ESTAR does not take into account the electric field due to the injected charges. This effect is probably quite important during the irradiation as the back side of the sample is grounded and the irradiated surface is left at a floating potential. It is therefore not surprising that the electrons driven by the field are detected a bit deeper.
TABLE I
PTFE IRRADIATION CONDITIONS, PEA, FLIMMand ESTARDATA
e-beam Energy (keV) Flux Intensity (pA/cm2)
Electron Penetration Depth (µm)
Estar data (µm) PEA FLIMM
Peak Peak End Peak First Second Peak 15 157 10 26 - 7 2.9 20 111 10.5 31 - - 4.9 30 34 11 32 6 12,5 9.9 40 54 16.5 40 6,5 15 16.5 50 50 21 50 11 20 24.4 60 50 29 52 9 - 33.4 70 37 38 64 - - 43.7 80 23 41 70 - - 54.9 90 42 58 (218 (1ndst) ) 95 - - 67.2 100 43 72 (231 (1ndst) ) 105 - - 80.3 20 40 60 80 100 20 40 60 80 100 D e pt h (µ m ) Energy (keV)
ESTAR Max penetratiopn depth PEA End second peak PEA Max first peak PEA Max second peak FLIMM Max first peak FLIMM Max second peak
Fig. 7. Penetration depth versus the electron energy predicted by ESTAR [6] For PTFE (ρ=2.15g.cm-2) and data recorded by PEA and FLIMM.
IV. CONCLUSIONS AND PERSPECTVES
In this paper we have presented space charge distribution profiles recorded by PEA and FLIMM on PTFE samples irradiated in vacuum under the same conditions. It has been shown that it is possible to get a good resolution by FLIMM when the charges are located near the surface (above 7 µm) but not further than 25 µm that was the case for the electron in the range [15-50 keV]. On the contrary, PEA profiles are better defined above 29 µm that correspond to the electron energy above 60 keV. These experiments show that both techniques are complementary and can be used to study the same type of materials with different thicknesses.
In the future we intend to install the both methods in-situ in order to get a better understanding on the charge transport in dielectrics used in spatial applications.
ACKNOWLEDGMENT
T.X. Nguyen thanks the USTH for the PhD grant provided. REFERENCES
[1] V. Griseri, “Behavior of dielectric in a charging space environment and related anomalies in fight”, IEEE trans. Diel. Elec. Insul., Vol. 16, No. 3, pp. 689-695, June 2009.
[2] T. Maeno, “Calibration of the pulsed electroacoustic method for measuring space charge density”, Trans. IEE Japan, Vol. 119 –A, pp. 1114-1119, 1999.
[3] V. Griseri, “PEA method : evolution and development perspectives for space charge measurement’, Dielectric materials for electrical engineering, ISTE-Wiley, Chap. 11, pp. 229-250, ISBN 978-1-84821-165-0
[4] A. Petre, D. Marty-Dessus, L. Berquez, J.L. Franceschi, “FLIMM and FLAMM methods : localization of 3-D space charg at the micrometer scale’, Dielectric materials for electrical engineering, ISTE-Wiley, Chap. 12, pp. 251-270, ISBN 978-1-84821-165-0
[5] V. Griseri, P. Malaval, L. Berquez, T. A. Tung, S. Le Roy, L Boudou, A. Boulanger, “Charge Build-Up and Transport in Electron Beam Irradiated Polymers in a New Irradiation Chamber“, IEEE Int Conf. On Electrical Insulation and Dielectric Phenomena, pp. 388-691, October 2010 [6] http://physics.nist.gov/PhysRefData/Star/Text/ESTAR.html

![Fig. 7. Penetration depth versus the electron energy predicted by ESTAR [6]](https://thumb-eu.123doks.com/thumbv2/123doknet/14376721.505229/5.918.66.445.827.1079/fig-penetration-depth-versus-electron-energy-predicted-estar.webp)
