HAL Id: hal-01343876
https://hal.archives-ouvertes.fr/hal-01343876
Submitted on 5 Dec 2018HAL is a multi-disciplinary open access archive for the deposit and dissemination of sci-entific research documents, whether they are pub-lished or not. The documents may come from teaching and research institutions in France or abroad, or from public or private research centers.
L’archive ouverte pluridisciplinaire HAL, est destinée au dépôt et à la diffusion de documents scientifiques de niveau recherche, publiés ou non, émanant des établissements d’enseignement et de recherche français ou étrangers, des laboratoires publics ou privés.
Ethanol Electro-oxidation on Palladium Revisited Using
Polarization Modulation Infrared Reflection Absorption
Spectroscopy (PM-IRRAS) and Density Functional
Theory (DFT): Why Is It Difficult To Break the C–C
Bond?
Evans A. Monyoncho, Stephan N. Steinmann, Carine Michel, Elena A.
Baranova, Tom K. Woo, Philippe Sautet
To cite this version:
Evans A. Monyoncho, Stephan N. Steinmann, Carine Michel, Elena A. Baranova, Tom K. Woo, et al.. Ethanol Electro-oxidation on Palladium Revisited Using Polarization Modulation Infrared Reflection Absorption Spectroscopy (PM-IRRAS) and Density Functional Theory (DFT): Why Is It Difficult To Break the C–C Bond?. ACS Catalysis, American Chemical Society, 2016, 2016 (6), pp.4894–4906. �10.1021/acscatal.6b00289�. �hal-01343876�
1
Ethanol Electrooxidation on Palladium Revisited using
PM-IRRAS and DFT: Why is it difficult to break the C –
C bond?
Evans A. Monyoncho,a,b
Stephan N. Steinmann,c
Carine Michel, c
Elena A. Baranova,b*
Tom K. Woo, a and Philippe Sautet.c*
a
Department of Chemistry and Biomolecular Sciences, Center for Catalysis Research and Innovation (CCRI), University of Ottawa, 10 Marie-Curie Private, Ottawa, Ontario K1N 6N5, Canada
b
Department of Chemical and Biological Engineering, (CCRI), University of Ottawa, 161 Louis-Pasteur St., Ottawa, Ontario K1N 6N5, Canada
c
Univ Lyon, ENS de Lyon, CNRS, Université Lyon 1, Laboratoire de Chimie UMR 5182, F-69342, Lyon, France
Abstract
Insights into ethanol electrooxidation reaction mechanism on palladium in alkaline media are presented combining polarization modulation infrared reflection absorption spectroscopy (PM-IRRAS) and density functional theory (DFT) calculations. The synergy between PM-IRRAS and DFT calculations helps to explain why the C – C bond is not broken during ethanol electrooxidation, and the reaction
2
stops at acetate. Coupling chronoamperometry (CA) with in-situ PM-IRRAS enabled us to simultaneously identify ethanol electrooxidation products on the catalyst surface and in the bulk solution. We show that at lower potential it is possible to break the C – C bond on Pd/C in alkaline media to form CO2. However, the selectivity is poor due to competition towards the formation of acetate
and other side products, which gets worse at higher potentials. DFT calculations were used to complete the picture using the computational hydrogen electrode approach. The calculations highlight the pivotal role of the CH3CO intermediate that can either undergo a C – C bond scission yielding CO and then CO2
or that can be oxidized towards CH3COO
-. The latter is a dead end in the reaction scheme towards CO2
production, since it cannot be easily oxidized nor broken into C1 fragments. CH3CO is however not the
most favored intermediate formed from ethanol electrooxidation on Pd, hence limiting the production of CO2.
Keywords: Ethanol electrooxidation, Palladium, Spectroelectrochemistry, direct ethanol fuel cells, DFT,
computational hydrogen electrode
1 Introduction
Fuel cells represent a promising technology for clean power generation because they convert chemical energy (fuel) into electrical energy with high efficiency and low-to-none emission of pollutants.1–4
Direct ethanol fuel cells (DEFCs) have several advantages compared to the most studied hydrogen and methanol fuel cells. First and foremost, ethanol is a non-toxic liquid, which lowers the investment of handling facilities because the current infrastructure for gasoline can be largely used.5,6
Second, ethanol can be conveniently produced from biomass, hence is carbon neutral which mitigates increasing atmospheric CO2. Last but not least, if completely oxidized to CO2, ethanol has a higher energy density
3
than methanol since it can deliver 12 electrons per molecule following the anodic reaction in equation (1):5 CH3CH2OH +12 OH à 2 CO2 + 9 H2O + 12 e 𝐸!! = +0.19 V/RHE (1) In a DEFC, equation (1) is counterbalanced at the cathode by the oxygen reduction reaction, generating a theoretical cell voltage of 1.14 V. However, in practice ethanol is known to be partially oxidized to acetic acid (acetate in alkaline media) giving a maximum of 4 electrons as shown in equation (2): CH3CH2OH + 5 OH -à CH 3COO + 4 H2O + 4 e 𝐸!! = -0.20 V/RHE (2) The almost exclusive oxidation to acetic acid overshadows the attractiveness of DEFC considerably, as the energy density is divided by 3. The standard potential of acetic acid formation indicates that a reaction path including acetic acid, leads to inevitable potential losses of about 0.4 V (difference between ideal potential for CO2 and acetic acid "production").
7
The development of alkaline fuel cells has mainly been hampered by the lack of stable and efficient anion exchange membranes. However, this challenge has been well tackled in recent years,8,98,9
allowing the development of alkaline fuel cells (AFCs) which are of particular technological interest due to their simple designs and ability to operate at low temperatures (25-100 °C). In alkaline conditions, the kinetic of both the cathodic oxygen reduction and the anodic ethanol oxidation is facilitated. Furthermore, the expensive Pt catalyst can be replaced by the lower-cost and more active transition metals, for instance Pd.10–14
Therefore, to overcome the limitation of incomplete oxidation of ethanol to CO2, several studies have
attempted to provide a better understanding of the ethanol oxidation on Pd-based catalysts using the previous extensive work on the ethanol oxidation on Pt-based catalysts in acidic conditions as a starting point. Although the detailed understanding of ethanol electrooxidation mechanism is complex and
4
controversial, there is a general consensus on Pt-based catalysts in acidic conditions that the reaction exhibits the so-called “dual pathway mechanism”15,16
or “consecutive-parallel mechanism”.17
According to this dual path reaction scheme, two major pathways are in competition. In the C2 pathway, the C – C
bond does not break and ethanol is oxidized successively to acetaldehyde and then to acetic acid (acetate in alkaline). In the C1 pathway, the C – C bond is broken, thus generating C1 fragments. These fragments
are oxidized into CO and eventually CO2. When shifting to alkaline conditions, very few studies
provide detailed molecular information.18–23
Christensen et al. have shown in several studies that the interfacial pH drops at higher potentials due to the OH
consumption that is not completely counterbalanced by the OH
diffusion from the bulk to the interfacial region.22–24
This phenomenon leads to a transition from alkaline to effectively acidic conditions. The transition potential varies with the diffusion rate of OH
-, i.e.-, working temperature-, flow-rate and so on. They report that during electrooxidation reaction, ethanol is converted to acetate in alkaline pH while above the transition potential, i.e., in pseudo-acidic conditions, it yields acetic acid and trace amounts of CO2 as a result of
the slow C – C bond splitting.25
This is in agreement with the results from online mass-spectrometry, evidencing CO2 production over Pt and Pd in 0.01 M NaOH, where acetic acid formation is almost
absent.26
On Pd-based electrocatalysts, ethanol oxidation reactivity differs compared to Pt, which is illustrated most clearly in acidic conditions, where Pt yields mainly acetic acid and even some CO2, while Pd is
completely inactive.27
In alkaline conditions, Pd is more active and it is generally proposed that ethanol is dehydrogenated into adsorbed acetyl (CH3CO) (sometimes erroneously called ethoxy) which is further
oxidized to acetate by the hydroxyl (OH
-) species.28
This mechanism has received further credence using
in-situ attenuated total reflection surface-enhanced infrared absorption spectroscopy
(ATR-SEIRAS) measurements.19
5
scission yielding adsorbed CH3CO as a pivotal intermediate, which may be further oxidized into acetate
or, given enough time, would fragment into C1 adsorbed intermediates (due to observation of adsorbed
CO).19 These observations can be rationalized by recalling that the oxidation of acetyl to acetate is an
electrochemical step, and therefore favored by oxidative potentials, while the C – C bond cleavage is expected to be only weakly affected by the potential, assuming that this process is not coupled with an electrochemical step such as the C-OH bond formation.
To complement the experimental insights, modeling studies are also being reported. However, the complexity of the Pd/alkaline electrochemical interface not only challenges experiments but also the atomistic modeling of the underlying mechanism.29
The main ingredients are the electrolyte and its pH, both influencing the reactivity directly (state of the electrode surface) and indirectly (modifying the environment). The electrochemical potential and the inclusion of well-established equilibria, such as the reactivity of acetaldehyde (e.g., enol and aldol formation) or of CO, which can be hydrated to yield formic acid adds to the complexity of the reaction network. It is currently impossible to consider all these aspects on a consistent level in one, exhaustive, study. Furthermore, the size of the "straight forward" reaction network for ethanol oxidation already includes 128 potential C2 and 21 C1
intermediates.
The influence of co-adsorbed species and of explicit water molecules has intrigued several groups. In particular, Neurock and co-workers have modeled ethanol oxidation by O2 in alkaline conditions by
including the aqueous media explicitly and adsorbed hydroxyl on the Pd surface.30
They have shown that most of the C – H and O – H scissions of the ethanol oxidation network towards acetic acid/acetate have lower barriers when assisted by co-adsorbed hydroxyl on Pd(111) compared with the bare metal. According to their results, acetaldehyde is a first intermediate towards acetic acid. Then, two possibilities exist: (i) the geminal diol, which can be formed by hydration of the acetaldehyde in
6
solution, leads straightforwardly to acetic acid (ii) acetaldehyde is either oxidized by the direct formation of a C – OH bond, or the α-C – H bond is broken, leading to acetyl CH3CO. In a more recent
study, Hu and coworkers revisited this mechanism in the electrochemical context, but without accounting for the electrochemical potential. Their conclusions are in line with the ones of Neurock regarding the oxidation by oxygen using a more advanced description of the structure of the water solvent.31
It should be noted that under electrochemical conditions, surface OH is also formed in acidic conditions, provided the electrochemical potential is sufficiently positive.32
As a consequence, these simulations can be applied to both alkaline and acidic conditions.
In order to complement these studies, one should include the effect of the electrochemical potential. The electrochemical potential can be included at various levels of sophistication. The most important effects are due to a change in thermodynamics when electrons and protons are exchanged. This effect can be easily obtained as a posteriori correction to ab initio energies (typically periodic DFT) as originally proposed by Norskov, known as the computational hydrogen electrode.7
This approach has been used successfully for MeOH oxidation on a large range of metals33–35
and includes the thermodynamic driving force of the (H+
, OH
-) recombination into H2O. Several groups have also
proposed strategies to include the influence of the potential in the electronic structure computations.36–41
Although more accurate, these approaches are also computationally more costly since they require the inclusion of the electrolyte to mimic adequately the capacitance of the interface, either with a continuum model,42
a Poisson-Boltzmann theory,40,43
or an explicit, but static description.44
These approaches have been used for the study of small reaction path networks such as the CO2 hydrogenation to formic acid
45
in combination with continuum models for the solvent or methanol and CO oxidation at a Pt catalyst.46,47
The aim of this work is to provide insights as to why the C – C bond is not broken during ethanol electrooxidation and to propose a detailed mechanistic schematic, which can be applied in understanding
7
experimental observations. Ethanol oxidation potentials were determined by cyclic voltammetry (CV). Chronoamperometry (CA), coupled with in-situ polarization modulation infrared reflection absorption spectroscopy (PM-IRRAS), was used to identify the oxidation products both on the catalyst surface and in the bulk solution. Density functional theory (DFT) calculations are exploited to explore all possible intermediates including the electrochemical potential using the computational hydrogen electrode at an alkaline pH of 14. This setup allows us to include the thermodynamic effect of the involvement of hydroxide ions in the reaction mechanism without explicitly co-adsorbing OH on the catalyst surface. The potential energy profiles of the reactions were used to determine the most likely reaction pathway towards acetate on two different facets, Pd(111) and Pd(100). On the most active facet, a complete study of the C2 and C1 intermediates was done on the full range of the 12 electron oxidation (from ethanol to
CO2) to select the key intermediates for the C – C bond breaking. Besides, for the first time to the best of
our knowledge, we assess the C – C bond breaking from these key intermediates in the context of electro-oxidation. The energy barriers provide general strategies for improving the catalyst towards C – C bond scission.
2 Experimental and computational methods
2.1 Palladium nanoparticles synthesis and characterization
The Pd/C nanoparticles (NPs) were prepared using a polyol method reported in literature.48,49
In the synthesis, 0.25 g of anhydrous Palladium chloride (Fisher) was dissolved in 50 mL of ethylene glycol (EG) (Fisher) and the pH was adjusted to 8 by adding 0.06 M NaOH in EG. The solution was then refluxed at 160° for 2 hours to form nanoparticles. To the resulting colloids, the appropriate amount of carbon black (Vulcan XC – 72 Cabot, Corp.) was added to obtain supported catalysts of 20 wt% loading. The mixture was stirred for 48 hours to achieve high dispersion of nanoparticles in carbon. The
8
supported catalyst was thoroughly washed with de-ionized water (18 Ω cm) to remove EG and salt ions through vacuum filtration and air dried at 100 °C for 4 hours.
The details of physicochemical characterization techniques have been reported in the previous publication.49
In summary, the following techniques were used: The High-Angle Annular dark-field (HAADF) scanning transmission electron microscopy (STEM). The FEI Titan3 80-300 microscope model equipped with a CEOS aberration corrector for the probe forming lens and a monochromatic field-emission gun was used. X-ray diffraction pattern (XRD) was collected using a Rigaku Ultima IV diffractometer using a Cu Kα X-ray source (λ = 1.54183 A, 40 kV, 44 mA). X-ray photoelectron spectroscopy (XPS) measurements were performed in a KRATOS Axis Ultra DLD with a Hybrid lens mode at 140 W and pass energy of 20 eV using a monochromatic Al Kα.
2.2 Spectroelectrochemical measurements
All experiments were conducted at room temperature in a customized in-situ cell made of Teflon equipped with a hemi-cylinder CaF2 window (RJ Spectroscopy Co.). A glassy carbon (GC) electrode of
0.1962 cm2
geometric surface area was used as the current collector for carbon supported Pd NPs. All potentials were measured with respect to mercury-mercury oxide (Hg/HgO) (Koslow scientific) but reported versus the reversible hydrogen electrode (E(RHE) = E(Hg/HgO) + 0.855 vs RHE), unless otherwise
stated. A Pt wire served as a counter electrode. 1M (KOH + C2H5OH) was used as the electrolyte and
was continuously purged with nitrogen gas. The catalyst ink was prepared by dispersing 6 mg of Pd/C powder in 1 ml of de-ionized water, 200 µL of isopropanol, and 100 µL of Nafion solution. The mixture was sonicated for 10 min to form a homogeneous mixture. The ink solution (10 µL) was deposited onto the GC-electrode surface and air dried at room temperature for 15 min and used as the working electrode.
9
The PM-IRRAS measurements were performed using a Bruker Tensor 37 spectrometer equipped with an external Polarization Modulation Accessory (PMA 50 XL), nitrogen cooled mercury cadmium telluride detector (LN-MCT Narrow PMA50, Infrared Associates Inc., Stuart, FL), photoelastic modulator (PEM-100 controller with II/ZS50 ZnSe, 50 kHz optical head, Hinds Instruments, Hillsboro, OR), and a demodulator [Synchronous Sampling demodulator (SSD), GWC Instruments, Madison, WI]. Electrode potential was controlled by a BioLogic VSP potentiostat equipped with the EC-Lab software (BioLogic Science Instruments SAS, Claix, France). The cell and PMA-50 XL chamber were thoroughly purged with nitrogen gas to remove background atmospheric CO2 and water vapour.
Although the electrolyte was degassed with N2 before being introduced into the cell, it was degassed for
30 minutes once assembled in the optical path, and then the electrode was pushed against the CaF2
window without stopping the gas flow. The thin-cavity obtained was wedged in form but the average thickness was estimated 50 to be 10 μm. Background spectra were collected to track the level of CO
2 in
the system. Typically, after two hours the reference spectrum was acquired at the open circuit potential (OCP) followed by sample spectra at various ethanol oxidation potentials selected from the cyclic voltammetry (CV) profile. Sample spectra were acquired under chronoamperometry (CA) conditions at five minutes increments i.e. while holding the potential constant for up to 30 minutes before stepping to another potential.
The signal was acquired by co-addition of 256 interferograms (128 forward and 128 backward scans) collected with a resolution of 8 cm-1
. With PM-IRRAS, we are able to simultaneously measure the average reflectivity [Ravg = (Rp + Rs)/2] and the difference reflectivity [Rdif = (Rp – Rs)] channel with a
single detector because of its double-modulation scheme.51
The Rp and Rs are the reflecties for p- and
s-polarized light, respectively. Although this property comes with many advantages it presents a challenge in processing and interpretation of the data obtained. However, we have recently developed an approach
10
to overcome this challenge which significantly simplifies PM-IRRAS data interpretation. The details for data processing are presented in the supporting information under “PM-IRRAS Data Processing and Interpretation” which will also be published later together with the detailed experimental optimization procedures in a manuscript currently under preparation (“Polarization Modulation Infrared Reflection
Absorption Spectroscopy (PM-IRRAS) Utility in Electrocatalysis: Experimental and Data Processing Details” by Evans A. Monyoncho, Vlad Zamlynny, Tom K. Woo, and Elena A. Baranova) In summary,
the approach yields strong signal-to-noise ratio enabling us to see weak absorption bands with a very few scans (16 - 256). The approach also allows direct interpretation of the spectra, and gives more insights of the substrate-film system or the reaction mechanism. The signal is reported as absorbance (A) using equation 3 and 4 which corresponds to surface and bulk-solution species, respectively.
𝐴 = log ( !"#$%& (!!"#) !"#"$"%&" ! (!!"#)) vs cm -1 3 𝐴 = log ( !"#$%& !!"#) !"#"$"%&" ! (!!"#)) vs cm -1 4
With this definition, the positive and negative bands in the spectra correspond to species produced or consumed at the sampling potential, respectively with respect to the reference spectrum.
2.3 Computational methods
Density functional theory (DFT) calculations were performed with the Vienna Ab-initio Simulation Package (VASP version 5.3.3).52,53 The generalized gradient approximation of Perdew, Burke, and
Erzenhorf (PBE)54
was used to compute the exchange-correlation energy. The projected augmented wave (PAW) method 55,56
was employed to describe the core-electron interaction. A plane-wave basis set with an energy cut-off was set to 400 eV was used. The Pd surfaces were modeled by a periodic slab with a p(3x3) unit cell of five Pd layers and a vacuum regions of 10 Å. A 7x7x1 Monkhorst-Pack k-points mesh was employed for the Brillouin zone integration together with a second order
Methfessel-11 Paxton smearing method 57
with a sigma of 0.2 eV. Slabs were cut from the optimized Pd bulk unit cell with a lattice constant of a = 3.94 Å which overestimates the experimental value of 3.89 Å by 1%. In all geometry optimizations only the top-two Pd monolayers were allowed to relax whereas the bottom three monolayers were kept fixed. All optimizations were carried out to forces below 0.02 eV/Å.
All energies are referenced to the bare Pd slab, ethanol, water and hydrogen in the gas phase. The latter two serve to introduce oxygen atoms and to account for the coupled proton-electron transfers, respectively. In particular, the reaction energies of electrochemical steps (i.e. steps where the number of protons in the system is changing) are computed according to the computational hydrogen electrode,7
e.g. the reaction:
CH3CO + H2O à CH3COOH + H +
+ e
-(5) is computed as
Erxn = E(CH3COOH) - [E(CH3CO) + E(H2O) + 0.5 E(H2) + U] (6)
Where we have assumed U to be with respect to the pH insensitive RHE and a pH of 0. Note that at pH = 14, we write the same expression for the reaction energy, but formulate the reaction as
CH3CO + OH -à CH 3COOH + e - (7) Similarly, we write CH3CHO + OH à CH3CO + H2O + e -(8) in alkaline conditions and compute the reaction energy (Erxn) as
Erxn = E(CH3CO) - [E(CH3CHO) + 0.5*E(H2) + U] (9)
The transition states (TS) have been located as follows: the state with the C – C bond broken was constructed in analogy to the adsorption mode of the individual fragments. This co-adsorbed state was optimized in order to ensure that no significant lateral interactions were introduced. Then, a rough nudged-elastic band (NEB)58
12
performed, seeded by interpolations between the two states obtained by Opt'n Path code 59
which uses a combination of internal and Cartesian coordinates. After about 50 cycles of NEB, an improved guess for the transition state was obtained, which was refined by the dimer method60 and verified to be a first order
saddle point by a frequency analysis.
Infrared spectra of surface species were modeled following the same procedure, the intensities being evaluated using density functional perturbation theory.61
Infrared spectra of solution species were computed using the same DFT functional (PBE) combined with a continuum model for the water solvent (PCM)62
with a def2-TZVP basis set using the Gaussian09 version D.01 program.63
3 Results and discussion
3.1 Pd/C Nanoparticles characterization and electrochemical performance
The physical, structural, and chemical characterizations of Pd/C are shown in Figure S1; other details have been published elsewhere.49
In summary, the supported particle size was determined to be on average 4 ± 2 nm. The XRD pattern showed that the nanoparticles retained the face-centered-cubic (fcc) structure of bulk Pd with peaks at 40, 46 and 68° 2θ corresponding to (111), (200) and (220) reflections, respectively.
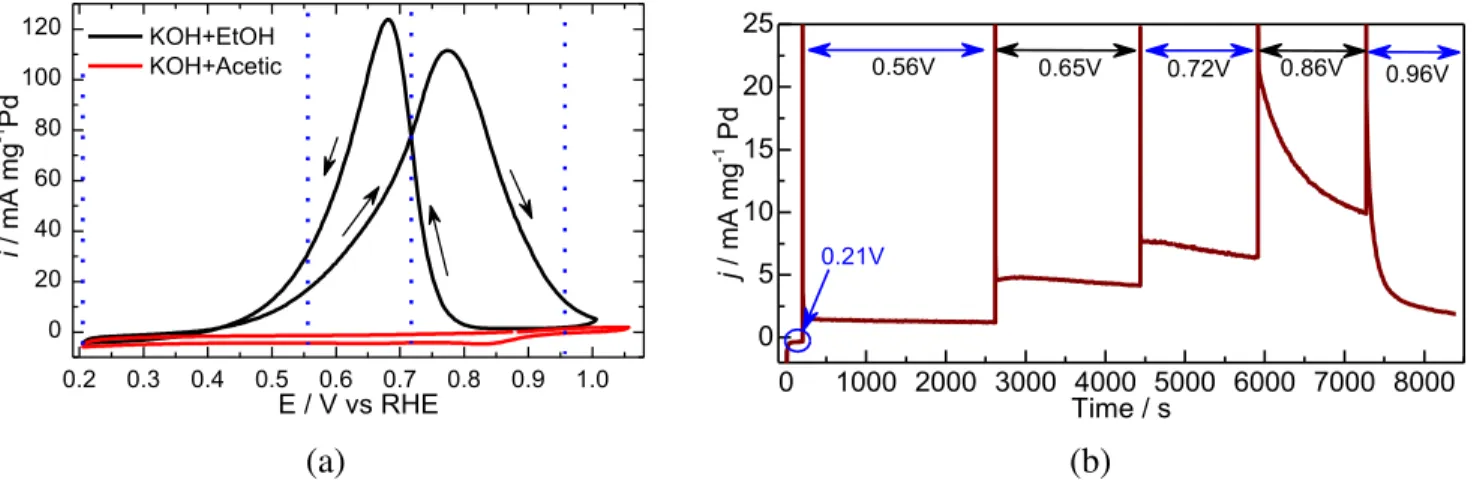
Cyclic voltammetry was used to determine ethanol oxidation current/potential profiles for Pd/C nanoparticles in alkaline conditions as shown in Figure 1b. Figure 1b shows a representative CV of Pd/C nanoparticles in 1M (KOH + CH3CH2OH) and 1M (KOH + CH3COOH) solutions at 5 mV s
-1. The slow
scanning rate helps to capture the oxidation profile with current densities close to a steady-state condition. For ethanol profile, during the anodic scan, a positive current starts at 0.39 V and increases
gradually to a maximum current density at 0.77 V, and then decreases to zero at 1.00 V. During the
13
at 0.66 V, and then decreases to zero at 0.39 V. The CV profile for acetic acid did not show any oxidation current densities, a prove that the resulting acetate (KOH + CH3COOH) is the dead end during
ethanol electrooxidation reaction.
(a) (b)
Figure 1. The CV profile for Pd/C nanoparticles in 1M (KOH + EtOH) and 1M (KOH + Acetic) at v = 5 mV s-1
(a), and the CA profile of Pd/C nanoparticles in 1M (KOH + EtOH) at various potentials as indicated by the double arrows (b). The vertical lines and double arrows (colored blue) shows the potentials whose PM-IRRAS spectra are discussed in the text.
This ethanol electrooxidation profile (Figure 1b) is typical for alcohols and is generally interpreted as a signature of species blocking the electrocatalyst surface at higher potential that can be removed while scanning back to lower potentials hence allowing oxidation of fresh ethanol molecules.19,64,65
To gain insights of the processes taking place at different potentials of the CV profile, chronoamperometry coupled with PM-IRRAS were used and the resulting data is discussed in the following section.
3.2 Identification of ethanol electrooxidation products on Pd/C surface and in the bulk electrolyte solution
Chronoamperometry measurements were coupled with in-situ polarization-modulation infrared reflection absorption spectroscopy (PM-IRRAS) to identify ethanol electrooxidation products at different potentials. Figure 1b shows the resulting current/potential CA response, in which the potential was stepped up from 0.21 V/RHE to 0.96 V/RHE while collecting spectra at each potential in
0.2 0.3 0.4 0.5 0.6 0.7 0.8 0.9 1.0 0 20 40 60 80 100 120 i / mA mg -1 Pd E / V vs RHE KOH+EtOH KOH+Acetic 0 1000 2000 3000 4000 5000 6000 7000 8000 0 5 10 15 20 25 0.21V 0.96V 0.86V 0.72V 0.65V j / m A m g -1 Pd Time / s 0.56V
14
increments of 5 minutes up to 30 minutes. The spectra collected at 0.21, 0.56, 0.72, and 0.96 V/RH are shown in Figure 2(a)-(h). As presented above and in the SI, the PM-IRRAS unlike the regular IRRAS technique allows us to distinguish between the oxidation species on/near the electrode surface (using the difference absorption intensities of p- and s-polarized reflection) and the oxidation species in the bulk/liquid-phase electrolyte within the thin-cavity between the CaF2 window and the electrode (using
the average absorption intensities of p- and s-polarized reflection). Herein, the spectra for the species on the electrode surface and spectra of the sum species in the thin-cavity will be referred to as “surface” and “bulk solution” species, respectively.66
Prior to the measurement of ethanol electrooxidation species spectra, it is important to ensure that there is no atmospheric CO2 and water vapor in the optical path which would not only decrease the IR
intensity but also would contribute to observed spectra features. Especially the presence of CO2 is
critical because it is one of the anticipated ethanol oxidation products. This objective was accomplished by purging the electrolyte and the cell chamber (PMA 50) with nitrogen gas and the level of CO2 in the
system was tracked by collecting a series of background PM-IRRAS spectra at open circuit potential i.e. no applied potential. Figure S7 shows the background surface and bulk species spectra collected at various time intervals. The first spectrum (Figure S7 curve(s) (a)) was collected at the beginning of the experiment i.e. 2.5 hours before actual measurements were started. Two other spectra were collected at 30 minutes Figure S7 curve (b) and at 3 minutes Figure S7 curve (c) before the actual measurements were done. In summary, it was determined that after 2.5 hours there was no significant background contribution to interfere with any spectra features as confirmed by the straight line of Figure S7 curve(s) c). Now we shift our attention to the spectra features obtained at the various potentials as shown in Figure 2. The potentials reported were selected from the different regions of the CV profile (Figure 1a)
15
and are meant to shed more insights of the reaction dynamics and/or intermediates/products at those regions.
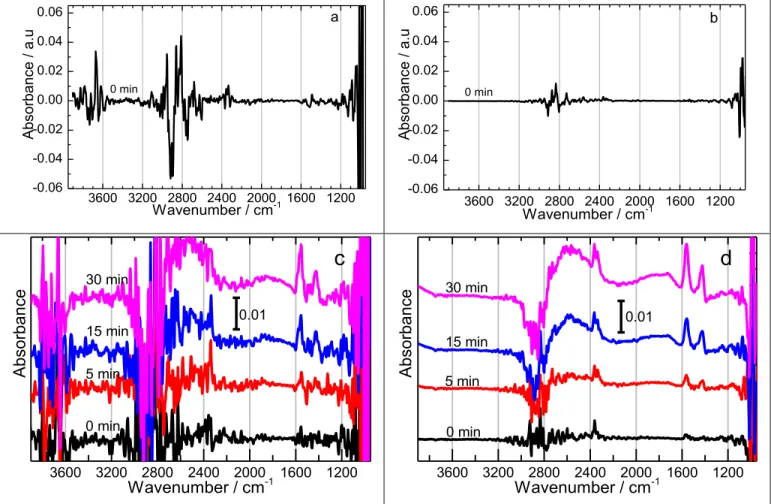
Figure 2 (a & b) shows the PM-IRRAS spectra at 0.21 V/RHE where there is no ethanol electrooxidation according to CV and CA (Figure 1). At this potential we see a negative peak centered around 2908 cm-1
which is due to breaking of the C – H bond. There are also two positive peaks centered on 2819 cm-1
and 3668 cm-1
which corresponds to C – H and H2O vibrations, respectively.
These observations tell us that there is some form of re-organization of the electrolyte molecules on the electrode surface. On the other hand, we do not see any significant structural changes features in bulk solution as shown by the straight line in Figure 2b. This is expected at this low potential.
3600 3200 2800 2400 2000 1600 1200 -0.06 -0.04 -0.02 0.00 0.02 0.04 0.06 a 0 min Ab so rb an ce / a .u Wavenumber / cm-1 3600 3200 2800 2400 2000 1600 1200 -0.06 -0.04 -0.02 0.00 0.02 0.04 0.06 b Ab so rb an ce / a .u Wavenumber / cm-1 0 min 3600 3200 2800 2400 2000 1600 1200
c
A bsorbance Wavenumber / cm-1 0.01 0 min 5 min 15 min 30 min 3600 3200 2800 2400 2000 1600 1200 0.01d
A bsorbance Wavenumber / cm-1 30 min 15 min 5 min 0 min16
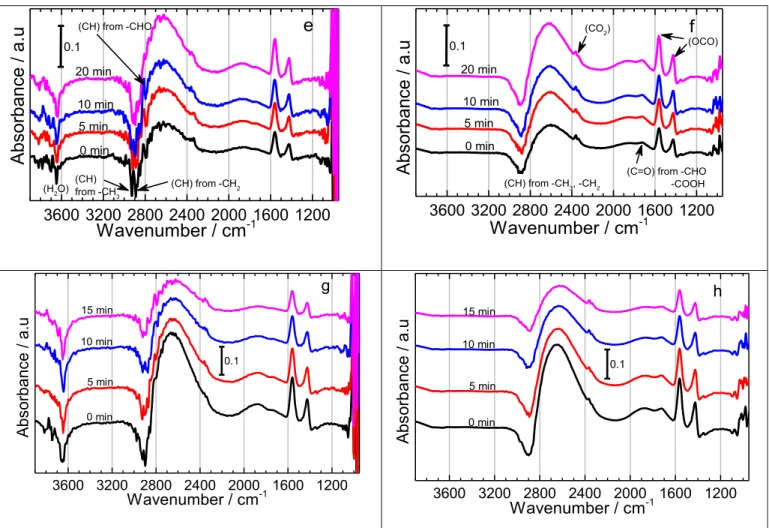
Figure 2. PM-IRRAS spectra for ethanol electrooxidation products on Pd/C nanoparticles in 1M (KOH + C2H5OH) at 0.21 V (a, b), 0.56 V (c, d), 0.72 (e, f), and 0.96 V (g, h) vs RHE. The left panels show
oxidation species on the surface and the right panels show oxidation species in the thin-cavity/bulk solution. The spectra were processed using equation 3 and the reference spectrum was collected at the open circuit potential, see SI for details. At each potential (row), the y-scale was made the same for easy/direct comparison between surface and bulk species.
Figure 2 (c & d) shows the surface and bulk solution species at 0.56 V/RHE, which is closer to the onset potential for ethanol electrooxidation. The surface species spectra look very noise compared with the bulk solution spectra. This phenomenon can be attributed to the dynamic activities taking place on the electrode surface at this potential. Of top interest at this potential, is the evidence of the C – C bond cleavage to form CO2 due to the positive peak at 2353 cm
-1
. With the PM-IRRAS we were even able to distinguish that the produced CO2 quickly desorbs/diffuses into the bulk solution as shown by the
3600 3200 2800 2400 2000 1600 1200 g Ab so rb an ce / a .u Wavenumber / cm-1 0 min 5 min 10 min 15 min 0.1 3600 3200 2800 2400 2000 1600 1200 h Ab so rb an ce / a .u Wavenumber / cm-1 15 min 10 min 5 min 0 min 0.1 3600 3200 2800 2400 2000 1600 1200 (CH) from -CHO (H2O) (CH) from -CH 3 (CH) from -CH2 0.1 Absorbance / a.u Wavenumber / cm-1 e 0 min 5 min 10 min 20 min 3600 3200 2800 2400 2000 1600 1200 (CH) from -CH3, -CH2 (CO2) f Absorbance / a.u Wavenumber / cm-1 0.1 0 min 5 min 10 min 20 min
(C=O) from -CHO -COOH (OCO)
17
intensity of the peak. The conversion of CO2 into carbonate was not evident (see Figure S2) in this work
probably due to the changing pH conditions within the thin-cavity from alkaline to neutral/acidic.67
One can notice that while the amount of CO2 increases clearly with time at lower potential (0.56V), its
accumulation is hampered or overshadowed by other species at higher potential. Although, the formation of CO during EOR on Pd in alkaline has been reported,21
we do not have evidence to support that argument in our spectra even after SNIFTIR treatment of our data as claimed in ref 21. Our data collaborates well with other similar work in literature where CO was not observed.12
Therefore, the formation of CO during C – C bond cleavage maybe regarded to be a very fast process as it is directly converted to observed CO2 at the lower potentials.
The presence of positive peaks at 1560 cm-1
(strong), 1423 cm-1
(medium), and 1350 cm-1
(weak) on the surface and bulk solution spectra in Figure 2 (c) – (h), corresponds to the asymmetric, symmetric, and C-H bending vibrations from the acetate (CH3COO
-) produced during ethanol electrooxidation in
agreement with other literature reports.19,21,68
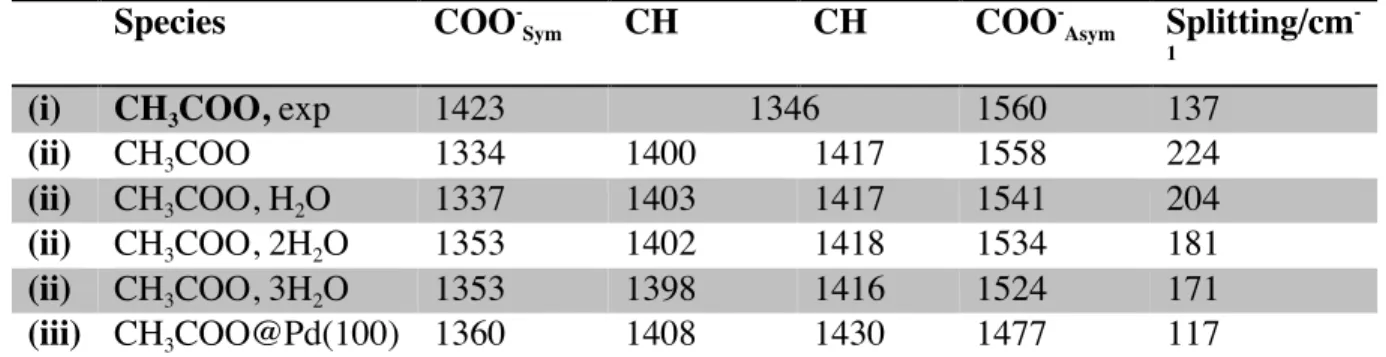
These peak assignments were confirmed with transmission infrared spectroscopy as shown in Figure S2 and the use DFT simulations as reported in Table 1. The simulated spectra in solution (continuum model) show the same three peaks (1558 cm-1
; 1410 cm-1
; 1334 cm-1
). The strongest peak is also the one at 1558 cm-1
and corresponds to the asymmetric COO
-vibrations. The corresponding symmetric mode vibrates at 1334 cm-1
and has the second highest intensity. Finally, the peak around 1410 cm-1
corresponds to bending modes of the CH3 group and
features only a weak intensity. The relative positioning of the weak C – H bending and strong COO
-symmetric stretch are inverted in the DFT computations compared to experiment. This has already been reported in the literature.69
Depending on the functional,70
the C-H bending and symmetric COO stretching frequencies are more or less mixed, leading to intensity redistributions between the C-H and COO modes, suggesting that anharmonicity should be accounted for. Due to the very high
18
computational cost of such a treatment, this is, however, beyond the scope of this paper. The COO
-symmetric stretch is red-shifted in our computations by about 100 cm-1
.
Table 1. Normal modes (in cm-1) for acetate in the region 1200-1600 cm-1 (i) as obtained experimentally
(see Figure S3) (ii) as computed as a function of the number of water molecules that solvate the COO- moiety in solution (iii) as computed for CH3COO adsorbed on a Pd(100) slab.
Species COO -Sym CH CH COO -Asym Splitting/cm -1
(i) CH3COO, exp 1423 1346 1560 137
(ii) CH3COO 1334 1400 1417 1558 224
(ii) CH3COO, H2O 1337 1403 1417 1541 204
(ii) CH3COO, 2H2O 1353 1402 1418 1534 181
(ii) CH3COO, 3H2O 1353 1398 1416 1524 171
(iii) CH3COO@Pd(100) 1360 1408 1430 1477 117
The inclusion of explicit water (see Table 1) mainly affects the COO
stretch vibrations, with the asymmetric and symmetric mode being red- and blue-shifted by 30 and 20 cm-1
, respectively. This improves the mode splitting from 224 to 171 cm-1
compared to the experimental 137 cm-1
. From Table 1, it is noticeable that the infrared spectrum of CH3COO adsorbed on a Pd(100), the asymmetric
vibration is also red-shifted by 80 cm-1
compared to the one of CH3COO using a continuum model for
the water solvent. In addition, the two other peaks are much weaker than in solution. Thus, the comparison of the DFT simulations and the PM-IRRAS spectra shows that the “surface” species signal obtained experimentally corresponds mainly to solvated species in the interfacial water zone.
There is a remarkable difference between surface species and bulk solution species in the regions 1620 – 2000 cm-1
, and 3648 cm-1
which also highlights the utility of PM-IRRAS technique. It is evident that the species absorbing at 1726 cm-1
is mainly available in the bulk solution but not on/or near the electrode surface. This peak corresponds to C=O stretching vibrations of an aldehyde/ketone or acetic acid. Our DFT simulations for acetaldehyde show a strong peak at 1720 cm-1
(C=O) but also two weak peaks between 1300-1400 cm-1
19 strong peak at 2812 cm-1
(C – H stretch), overlapping also with a broad band centered around 2600 cm-1
. The origin of the broad peak at 2600 cm-1
would be due to accumulation of combination of various intermediates (ethoxy, acetaldehyde & its hydrate form, and acetic acid) in the thin-cavity as shown in Figure S3. Figure S3a shows the simulated spectra for ethoxy (CH3CH2O), acetaldehyde (CH3CHO),
hydrated acetaldehyde (CH3CHOOH), and acetic acid (CH3COOH), which confirms that ethoxy and
hydrated acetaldehyde have bands near 2600 cm-1
. Although, the simulated spectrum for acetic acid [Figure S3 (a)] does not show any peak between 2400 cm-1
and 2700 cm-1
, the experimental spectrum [Figure S3 (b)] shows that acetic acid has three overlapping peaks within the region. Therefore, the potential candidates for the broad peak at 2400 – 2700 cm-1
would be ascribed to a combination of ethoxy, geminal-diol, and acetic acid as a result of the changing pH during the electrooxidation. Further studies are underway to confirm the true origin of this broad peak centered on 2600 cm-1
. The absence of the peak at 1726 cm-1 on the surface spectra is probably due to the low concentration of acetaldehyde
and/or its interaction with the electrode surface. The negative peak at 3648 cm-1
on the surface species spectra is the evidence for the consumed water molecules at the electrode surface. Note that at higher potential i.e. 0.96 V, where the catalyst surface is deactivated, the products accumulation decreases with time but no evidence for the formation of CO2. This observation proves that acetate is indeed the dead
end for EOR in agreement with the acetate CV in Figure 1 (a). Therefore, the cleavage of C – C bond is only possible at lower potentials.
To sum up, the PM-IRRAS spectra show that at lower potential it is possible to break the C – C bond of ethanol on Pd/C in alkaline media to form CO2. However, the selectivity is poor due to competition
towards the formation of acetate, which gets worse at higher potentials. In addition, traces of acetaldehyde are found in the bulk solution. Based on these experimental insights, we now explore the
20
most likely intermediates involved in the reaction path using DFT calculations as presented in the next sections.
3.3 Reaction mechanism
The reaction network involved in ethanol electro-oxidation is quite complex as presented above, even after simplifying it by considering only proton coupled electron transfers as electrochemical steps. There are 12 electrons to be recovered through 9 proton abstractions and 3 OH additions. Our simulations do not include explicitly the influence of the water-based electrolyte on the intermediates structures. However, the main determining factor is the role of OH
as a proton acceptor on the thermochemistry, and this is included in the computational hydrogen electrode approach.
Furthermore, the reaction only proceeds to completion if the C – C bond can be broken. Hence, we need at least to consider the following elementary reaction steps, with specific examples given for illustration in equations (10) – (13): C – H scission: CH3CH2OH@Pd + OH à CH3CHOH@Pd + e- + H2O (10) O – H scission: CH3CH2OH@Pd + OH à CH3CH2O@Pd + e- + H2O (11) C – OH formation: CH3CHOH@Pd + OH - àCH 3CH(OH)2@Pd + e- (12)
C – C scission: CH3CH2OH@Pd + Pd à CH3@Pd + CH2OH@Pd (13)
To break up the complexity into smaller manageable parts, we proceed as follows: PM-IRRAS data demonstrates that the electrooxidation of ethanol over Pd leads to identifiable acetate and traces of CO2.
Therefore, for simplicity, we start by studying the intermediates that lead to acetate on the dominant Pd(111) and the more reactive and still sufficiently abundant Pd(100) surface. A brief description of the geometric features can be found in SI, we discuss here their relative energies and the most likely reaction pathway until acetate. Then, in order to obtain a "complete" picture, we have searched the most stable C1 and C2 intermediates at each oxidation state until CO2. Based on this overview, we shed more
21
light on the reason why the reaction stops at the acetate level and why the selective cleavage of the C – C bond is difficult.
3.3.1 From ethanol to acetate
Pd(111): Figure S8 shows the adsorption structures of the most important intermediates involved in
ethanol electrooxidation on Pd(111). The structures are in line with the literature 71
and thus we focus here on the relative energies of the intermediates at a given oxidation state and their involvement in the oxidation path towards acetic acid. Figure 3 (a) shows the reaction energy profile for ethanol oxidation on Pd(111) at a potential of 0.26 V, based on the computational hydrogen electrode 7
(see Computational Details). This potential corresponds to the thermodynamic equilibrium potential for the oxidation of ethanol to CO2. In reality, over-potentials are necessarily observed but with only 0.4 V, Pd is rather
promising in terms of onset potentials. Each column in the reaction coordinate corresponds to intermediates at a given oxidation state. Intermediates below and above the dotted line are due to exothermic and endothermic processes, respectively.
The ethoxy (CH3CH2O) species is higher in energy than the α-dehydrogenated intermediate
CH3CHOH in agreement with previous reports. 71
However, Hibbits and Neurok 30
have modelled the oxidation of EtOH by O2 in which the catalyst surface was pre-covered with O and OH species and have
shown that the formation of ethoxy has the lowest activation barrier in these conditions, proving that it is an important intermediate. The CH2CH2OH is intermediate in energy. A second proton coupled electron
transfer leads to an oxidation state which is particularly challenging to describe realistically: three adsorbed intermediates are connected through well-known solution equilibria: acetaldehyde, its hydrate (the geminal diol) and the enol; the forth intermediate considered (CH3COH) is strongly bound to the
22
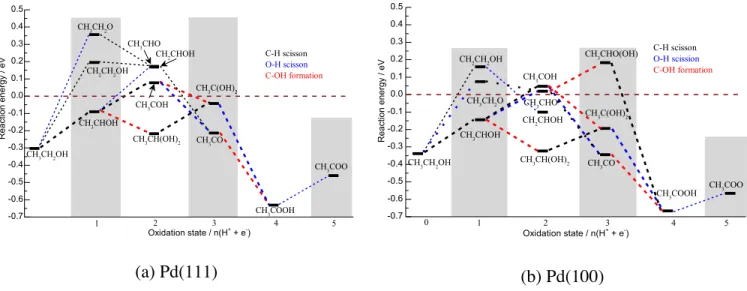
(a) Pd(111) (b) Pd(100)
Figure 3. Reaction energy profile for ethanol oxidation on (a) Pd(111) surface and (b) Pd(100) surface at a potential of 0.26 V vs RHE. Only the most important (and low lying) intermediates are shown. The dotted line connecting the intermediates are color coded according to the reaction process taking place, black and blue correspond to C – H and O – H bond scission, respectively while red corresponds to C – O bond formation
On the surface, acetaldehyde and its enol are almost iso-energetic. Since the CH2Cx intermediates at the
following oxidation states are significantly higher in energy than the CH3Cx intermediates, we consider
the enol to be a dead end, i.e., it just participates in the equilibria if formed. In fact, it is rather the hydrate which is the dominant intermediate: it is the lowest energy intermediate, is connected to the previous lowest energy intermediate and can form either in solution through acetaldehyde or on the surface by a surface OH assisted process.
The oxidation of the hydrate does not lead to the lowest energy intermediate at oxidation state +3. The lowest energy intermediate at oxidation state +3 is the acetyl (CH3CO) and it is only accessible from
higher energy intermediates of the previous oxidation state +2. Oxidation of CH3CO or CH3C(OH)2
invariably yields acetic acid, through a OH addition and a dehydrogenation, respectively. Acetic acid is by far the lowest energy intermediate on the surface at oxidation state +4 (the second lowest fragment is CH2CO at 0.86 eV higher in energy), and can desorb easily into solution. Then, in alkaline solution the
-0.7 -0.6 -0.5 -0.4 -0.3 -0.2 -0.1 0.0 0.1 0.2 0.3 0.4 0.5 CH2CHOH CH2CH2OH C-H scisson O-H scisson C-OH formation 1 CH3CH2OH CH3CH2O CH3COO CH3COOH CH3C(OH)2 CH3CO 5 4 Rea ction e n e rg y / e V Oxidation state / n(H+ + e -) 2 3 CH3CH(OH)2 CH3CHO CH3COH CH3CHOH -0.7 -0.6 -0.5 -0.4 -0.3 -0.2 -0.1 0.0 0.1 0.2 0.3 0.4 0.5 CH3CHO(OH) 0 C-H scisson O-H scission C-OH formation 1 CH3CH2OH CH3CH2O CH3COO CH3COOH CH3C(OH)2 CH3CO 5 4 Rea ction e ne rg y / e V Oxidation state / n(H2 +3 + e-) CH3CH(OH)2 CH3CHO CH3COH CH3CHOH CH2CH2OH CH2CHOH
23 formation of CH3COO
is straightforward. This reaction network explains satisfactorily the observed formation of acetic acid (or acetate at high pH values). After a quick comparison of the acetic acid formation on the Pd(100) surface, the following sections investigate the prospects to split the C – C bond in ethanol.
Pd(100): Figure S9 shows the adsorption structures of the most important intermediates involved in
ethanol electrooxidation on Pd(100). The geometry of the adsorbates is very similar to that on Pd(111) and is therefore not discussed any further.
Figure 3 (b) shows the reaction energy profile for ethanol electrooxidation on Pd(100) surface at a potential of 0.26 V. Here we highlight the differences between Pd(100) surface and Pd(111). One difference is that the reaction energies are shifted to lower energies by ca. 0.1 – 0.2 eV, meaning that the (100) surface is more reactive than the (111) surface in agreement with previous reports.72,73,74
The second difference is that the relative stability of acetaldehyde (CH3CHO) and 1-hydroxyethylidene
(CH3COH) is reversed: on the 100 surface, CH3CHO is 0.02 eV more stable than CH3COH. However, it
is doubtful that these very small energy differences are representative of the situation under electro-catalytic conditions where the solvent and the potential may easily change the relative energies by more than this difference. In any case, the geminal-diol is the lowest intermediate at this oxidation state for both surfaces. Therefore, we can conclude that investigating the Pd(100) or Pd(111) surface is qualitatively the same. Nevertheless, since the (100) surface is more active for bond formation and splitting reactions,74
and these reactions are key and highly activated on this surface (vide infra), we report only the results for Pd(100) in the remainder of this article. Based on our DFT results, we can also predict the overpotential to produce CH3COOH from EtOH on Pd catalysts and this overpotential is
in agreement with the onset potential observed experimentally. The lowest energy path is represented at various potentials in Figure 4. It starts with the generation of CH3CHOH, an endothermic step at 0.26 V.
24
It yields the gem-diol CH3CH(OH)2 at the degree of oxidation +3 that is further dehydrogenated into
CH3C(OH)2, a step that is also endothermic at this potential. The last step is strongly exothermic and
gives CH3COOH. At 0.45 V, all the steps along the most stable path to CH3COO
- are predicted being
endothermic. At that potential, even the generation of acetaldehyde starts to be exothermic. Those potentials are in line with our experimental results (CV in Figure 1 and the PM-IRRAS spectra in Figure 2) where the reaction starts at around 0.45 V and where traces of acetaldehyde are identified at 0.65 V/RHE and more intense at 0.72 V.
Figure 4. Reaction energy profiles for ethanol electrooxidation on Pd(100) surface showing the effect of the electrochemical potential (0.26 V, 0.56 V, and 0.72 V vs RHE) for the most likely C2 reaction path. 3.3.2 Intermediates beyond Acetate and Breaking the C – C bond
The chemical viability of DEFCs relies on two related aspects. First, the fuel needs to be completely oxidized in order to obtain a realistically useful energy and current density. In other words, catalysts oxidizing ethanol to acetate (acetic acid in acidic media) are not useful in practice, as they would liberate only 4 out of 12 possible electrons. Second, the kinetics needs to be efficient at a reasonably low over-potential. According to the Butler-Volmer equation, a proton coupled electron transfer is directly
-2.8 -2.4 -2.0 -1.6 -1.2 -0.8 -0.4 0.0 0.4 CH3C(OH)2
Re
ac
tio
n
en
er
gy
e
V
Oxidation state / n(H
++ e
-)
0.26 V 0.56 V 0.72 VCH3CH2OH CH3CHOH CH3CH(OH)2 CH3COOH CH3COO
25
accelerated by the over-potential. Furthermore, the barriers for formal dehydrogenation reactions are fairly small on Pd (in the order of 0.7 eV). While the C–OH formation could be somewhat more activated, it can equally be considered an electrochemical step and therefore its barrier is likely to be heavily lowered by the over-potential and the presence of surface hydroxyls. If the C-C dissociation were coupled with the formation of the C-OH bond, in a concerted mechanism with the hydroxide anion attacking from the solvent, this dissociation would also strongly depend on the electrochemical potential. However, modeling such a process would required a full description of the solvent and a complete inclusion of the electrochemical potential, which is out of the scope of this study. The direct C–C bond splitting, in contrast, is a chemical step and thus hardly affected by the electrochemical potential as extrapolated from our findings for the electro-carboxylation of ethene.75
Hence, investigating the feasibility of C – C bond splitting is key in order to understand both, incomplete oxidation and sluggish kinetics and this can be done without the inclusion of the electrochemical potential. -1.2 -0.8 -0.4 0.0 0.4 0.8 1.2 a b c d 0 11 COOCO CHOCO CHOHCO CHCO CH2CO CH3COH Rea ction e ne rg y / e V Oxidation state / n(H+ + e-) 1 2 3 4 5 6 7 8 9 10 11 12 CH3CH2OH CH3CHOH CH3CH(OH)2 CH3CO CH3COOH CH3COO CHCOOH CHOHCOOH CHOCOOH COCOOH COOHCOOH COOHCOO COOCOO
26
Figure 5. Global reaction energy profile of the most stable intermediates during ethanol electrooxidation process on Pd(100) at 0.26 V/RHE. The black squares show the most stable C2 intermediates at each oxidation state (C2 path) whose intermediates are indicated at the top. To guide the eyes, a line has been
added, in solid (resp. dotted) when the intermediates are connected (resp. not) from one oxidation state to the next. Legend: (a) Most stable C2 species, (b) C1 fragments generated from the most stable C2, (c) Most stable C1 fragments, and (d) Parent C2 species of the most stable C1 fragments which are shown at the bottom.
Let us start by addressing the first question: which is the most likely possible path that would lead from ethanol to CO2 instead of acetic acid based on thermodynamics? Figure 5 summarizes our effort to
identify the lowest energy intermediates at each of the 12 oxidation states, accounting for C – H, O – H and C – C bond activations as well as C – OH bond formation. The intermediates below the zero horizontal dashed line in Figure 5 are due to an exothermic process while those above the line are due to an endothermic process at the potential of 0.26 V i.e. the minimum potential for which ethanol oxidation is energetically feasible in terms of free energy. At each oxidation state we indicate the most stable C2
intermediate and the energy of its C – C bond broken C1 analogue. Of course, at any given oxidation
step, the lowest intermediate before the C – C bond breaking does not need to yield the lowest two C1
fragments at that oxidation step, which is indicated by the presence of open circles on Figure 5. Note that we did not consider additional "pure" chemical steps which further complicate the reaction network, e.g. by introducing formic acid (HCOOH) at the same oxidation state as CO. Similarly, the lowest energy intermediate at each oxidation state “n” is not necessarily directly related to the intermediate of oxidation state “n+1” (e.g., CH3CH2(OH)2 is the most stable intermediate at oxidation state +2, but at +3,
it is CH3CO), which is indicated by broken black lines instead of the full lines.
As mentioned in the introduction, ethanol electrooxidation mechanism is best presented in a “dual path mechanism scheme”. The C2 path does not involve the breaking of the C – C bond while in the C1
the C – C bond yielding C1 fragments. In agreement with previous reports,
31 we found a reasonably
27
changes dramatically from CH3COO to CHCOOH. Furthermore, the process is endothermic by 0.6 eV at
the thermodynamic equilibrium potential for the overall reaction. This implies that a potential of at least 0.6 V would be necessary to drive the oxidation beyond acetate (acetic acid). The fact that these intermediates are not connected would mean a further increase of the over-potential. This is in agreement with the cyclic voltammetry experiments demonstrating that acetic acid is inert for further oxidation, i.e. no current transfer was observed in the CVs with 1M (KOH+CH3COOH) solution as
shown in Figure 1. To conclude, Figure 5 indicates that it would be ideal to split the C – C bond before reaching acetate (acetic acid in acid media), which is the dead end of the reaction with the current catalysts. On the other hand, on thermodynamic grounds, the C – C bond splitting is "constantly" beneficial from oxidation state +6 onwards and, in general, passing to the C1 pathway is more likely
when the C2 fragment can be split through a de-carbonylation, generating a highly stable CO moiety.
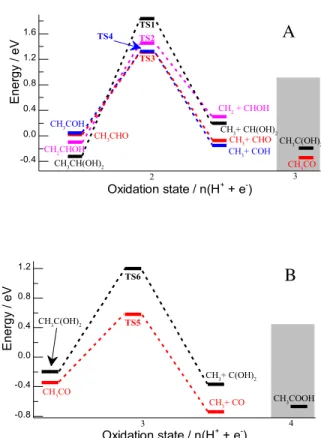
Turning to the second limitation, i.e., the sluggish kinetics, we investigate the reasons for which the C – C bond is not split before reaching acetic acid. Both for ethanol and for the first oxidative intermediate, the C – C bond breaking is highly unlikely as the thermodynamics are fairly unfavorable. However, at oxidation state +2 and +3 the breaking of the C–C bond could occur based on thermodynamic grounds. So why is it barely observed experimentally? To answer this question, we have identified transition states for breaking the C – C bond in the key intermediates at oxidation state +2 (Figure 6a) and +3 (Figure 6b).
The first, general observation is that the activation energies are quite high with about 1.3 eV, even on the Pd(100) surface which is more active than the Pd(111) surface. There are two barriers that differ significantly from this number. First, is the highest activation barrier for breaking the C – C of the hydrate, CH3CH(OH)2 (oxidation state +2) (E
‡
= 2.1 eV). This large barrier is probably due to the fact that the carbons of the reactant are not interacting with the catalyst surface, hence they are not activated.
28
Besides, the steric crowding which destabilizes both the transition state and the product, barely affects the reactant, which does not adsorb through a carbon atom but rather through the two lone-pair of electrons of the oxygen atoms. In support of this argument, we find that the energy barrier for the dehydrogenated geminal diol is significantly lower (1.4 eV).
Figure 6: Energy profile for breaking the C-C bond on Pd(100) for species at oxidation state two (A) and at oxidation state three (B), both at 0.26 V vs RHE.
In this case, the steric crowding in the reactant and product is similar, as both adsorb through the unsaturated carbon atom hence benefiting from less destabilization. Second, the lowest barrier for breaking C – C bond is found for acetyl (CH3CO) with activation energy of "only" 0.9 eV, which is
attributed to the very stable CO product on Pd surface. Note, however, that this is still a significant
-0.8 -0.4 0.0 0.4 0.8 1.2 CH3COOH TS5 TS6 En er gy / eV Oxidation state / n(H3 + + e-) 4 CH3CO CH3C(OH)2 CH3+ CO CH3+ C(OH)2 -0.4 0.0 0.4 0.8 1.2 1.6 CH2 + CHOH CH2CHOH TS2 TS4 TS3 TS1 CH3+ COH CH3+ CHO CH3+ CH(OH)2 En er gy / eV Oxidation state / n(H2 + + e-) 3 CH3COH CH3CHO CH3CH(OH)2 CH3CO CH3C(OH)2 A B
29
barrier at room temperature that cannot be lowered by the application of potential. Furthermore, the C – C splitting is in competition with the thermodynamically favorable C – OH bond formation that yields acetic acid. Playing on the structure of the catalyst, one may favor the C – C bond splitting since this is a structure-sensitive reaction that is favored on low-coordinated facets: the C – C bond splitting in CH3CO
drops from 1.4 eV on Pd(111) 76
to 0.9 eV on Pd(100) and 0.7 eV on Pd(110) 77
The reaction selectivity towards acetic acid is better understood from the aforementioned reaction energy profiles, keeping in mind the C – H and O – H bond breaking in ethanol catalyzed by Pd have a barrier lower than 0.8 eV.78
These steps can be even further activated by the presence of surface hydroxyls as shown in previous DFT studies.30,31
The thermodynamic impact of the recombination of H+
and OH
is, however, also included in our present study through the use of the computational hydrogen electrode. At oxidation state +2 the most stable intermediate (the gem-diol CH3CH(OH)2) does not
undergo C – C splitting (E‡ = 2.1 eV) and also higher lying intermediates only react slowly towards C1
products and face a strong competition with C – OH bond formation. Hence, the hydrate gets oxidized, despite the fact that this does not lead to the lowest energy intermediate at oxidation state +3. At oxidation state +3, there are three processes in competition. In one process, the CH3C(OH)2 is quickly
oxidized to acetic acid (E‡ < 0.8 eV) and the C – C bond remains intact. In the second process, the most stable but kinetically less accessible intermediate CH3CO, can undergo slow C – C bond splitting (E
‡
= 0.9 eV) and the fragments eventually be oxidized to CO/CO2. In the third process, CH3CO can be
oxidized to acetic acid as explained above, which is an electrochemical process that is favored by oxidative potentials. In other words, the necessary potentials and the unfavorable "connection" between the most stable intermediates lead to the dominance of acetic acid as a product and to the small probability of splitting the C – C bond at an early stage of the oxidation process. These results show how challenging and complex it is to design a catalyst for complete electrooxidation of ethanol to CO2.
30
3.4 Ethanol electrooxidation mechanism
In this section, we summarize the reaction scheme that results from our joint experimental and theoretical study as shown in scheme 1.
Scheme 1: General Reaction Scheme based on our results. In blue, the experimental evidences. In black, the intermediates as suggested by our DFT simulations. Most of the steps are catalyzed by the Pd electrode (single arrows) while others are solution equilibria (two one-sided arrows).
Ethanol is converted to acetaldehyde by oxidative dehydrogenation on Pd. This is a two-step processes that has been studied in details by DFT simulations including co-adsorbed species and water solvent30
To be able to screen a much larger part of the reaction network of ethanol electrooxidation into CO2, we
had to simplify our model to a Pd/vacuum interface. The effect of the co-adsorption of water are not included but expected to be negligible on the relative energies.79,80
Indeed, even if the details differ, our study leads to the same conclusion at oxidation state +2: acetaldehyde is in equilibrium with its hydrate, the gem-diol. And acetaldehyde is seen in the bulk solution by PM-IRRAS. Then, two routes are in competition. First, the gem-diol is the most stable adsorbed species at its degree of oxidation. The α-C – H bond breaking is particularly facilitated in electrochemical conditions and leads to CH3C(OH)2 that
OH OH OH O OH HO O O OH O O O CH 3CO HO O 2 CO2 O O
31
easily yields acetic acid. In the second route, acetaldehyde is dehydrogenated into acetyl, CH3CO. Since
acetaldehyde is less stable on the surface than its gem-diol, this route is disfavored. However, the acetyl is a pivotal intermediate. Its degree of oxidation is the first along the path where the key C – C bond scission can occur exothermically from the most stable C2 fragment. Moreover among all the intermediates of degree +2 and +3, it is the one that exhibits the lowest activation barrier for the C – C bond scission (0.9 eV). Hence, even though a chemical step, CH3CO decarbonylation could compete
with the C – H, O – H and C – OH rearrangements that are facilitated by the electrochemical potential. Thus, the CO2 traces we have observed experimentally at low potentials by PM-IRRAS are probably
generated from adsorbed acetyl. This is in line with the ATR-SEIRAS experiments of Yang et al.19
However, the acetyl can also easily lead to acetic acid by the formation of a C – OH bond, a process that is accelerated by oxidative potentials. This explains the experimental observation that the selectivity towards CO2 decreases at higher potential.
In summary, the C – C bond scission that is essential to open the route to a full oxidation of ethanol can occur at the degree of oxidation +3. However, it is a slow process and in competition with the faster oxidation to acetic acid. For degree of oxidation > +5, the C – C bond splitting is exothermic, opening the road to the C1 pathway. However, there is a strong disconnection on the C2 pathway between the
most stable species at degree +5 (CH3COO) and the most stable species at degree +6 (CHCOOH) that
hinders the oxidation of acetate (Figure 5), in line with the experimentally observed impossibility to oxidize acetic acid in KOH under our conditions (Figure 1).
4 Conclusion
We have presented a comprehensive study of the reaction mechanism of ethanol electrooxidation over Pd surfaces, combining cyclic voltammetry (CV), polarization modulation infrared reflection absorption
32
spectroscopy (PM-IRRAS), and density functional theory (DFT) calculations. The PM-IRRAS information (identification of surface and bulk solution species) simplified the number of possible intermediates considered in the DFT modelling, while DFT insights provided invaluable information of the elementary reaction intermediates and kinetic parameters, which was not accessible experimentally. This strategy can be easily extended to other alcohols or organic molecules on other metal surfaces.
In this work, we have solved two of the long debated puzzles: the path leading to the formation of acetate, the product obtained over a Pd catalyst in alkaline conditions, and the most likely intermediates where the C–C bond can be broken. For the formation of acetic acid, we have identified two converging paths: the most stable path, going through the gem-diol (hydrate of acetaldehyde), and the second most stable path going through the acetyl (CH3CO). Unfortunately, acetate cannot be oxidized further over Pd
according to our CV and DFT results, closing the door to the C1 path and thus the complete oxidation of ethanol. Hence, to contribute to the second debate, we have determined the most likely intermediates where the C – C bond can be broken before reaching acetate. We have demonstrated that acetyl (at oxidation state three) has by far (>0.3 eV) the lowest activation energy for the C – C bond breaking (E‡ = 0.9 eV). However, the over-potentials required for reasonable current densities are strongly accelerating the electrochemical oxidation process. This favors the C-OH formation over the C – C splitting reaction. Therefore, CH3CO is quickly oxidized to acetic acid, thereby suppressing the C – C
bond breaking, explaining the negligible amount of CO2 detected at higher potentials. In other words,
CH3CO plays a pivotal role since it can either undergo a C – C bond splitting, eventually yielding CO2,
or be oxidized towards CH3COOH, a dead end in the reaction scheme. Through this analysis, our work
has determined the conditions for a better selectivity towards CO2: destabilize the gem-diol, stabilize the
acetyl and facilitate its splitting into CH3 and CO. A large descriptor-based search of catalysts is being
33 Acknowledgement
The authors thank University of Ottawa, CNRS and ENS Lyon for support in the frame of the associated international laboratory FUNCAT "Fundamental catalysis for green chemistry: From well-defined active sites to mechanistic explorations", Natural Sciences and Engineering Research Council of Canada (NSERC) for financial support, Canada Foundation for Innovation (CFI) for equipment funding and the PSMN and Compute Canada (Sharcnet) for the computational resources.
Supporting Information Available: The physical characterization of the Pd/C nanoparticles; the PM-IRRAS background/reference and Data processing and interpretation details; FTIR transmission spectra for KOH and (KOH+ acetic acid, sodium acetate, sodium carbonate, and ethanol); most stable geometric ethanol oxidation intermediates structures and some of the key POSCAR files. This material is available free of charge via the Internet at http://pubs.acs.org
References
(1) Heinzel, A.; Cappadonia, M.; Stimming, U.; Kordesch, K. V.; Tambasco de Oliveira, J. C. In
Ullmann ’s Encyclopedia of Industrial Chemistry; Wiley-VCH, 2010.
(2) Jiang, S. P.; Wang, X. In Solid State Electrochem. II; Wiley-VCH Verlag GmbH & Co. KGaA, 2011; pp. 179–264.
(3) Steele, B. C. H.; Heinzel, A. Nature 2001, 414, 345–352.
(4) Zhang, S.; Shao, Y.; Yin, G.; Lin, Y. J. Mater. Chem. 2013, 1, 4631–4641. (5) An, L.; Zhao, T. S.; Li, Y. S. Renew. Sustain. Energy Rev. 2015, 50, 1462–1468. (6) Goldemberg, J. Science 2007, 315, 808–810.
(7) Nørskov, J. K.; Rossmeisl, J.; Logadottir, A.; Lindqvist, L.; Kitchin, J. R.; Bligaard, T.; Jónsson, H.
J. Phys. Chem. B 2004, 108, 17886–17892.
(8) Varcoe, J. R.; Atanassov, P.; Dekel, D. R.; Herring, A. M.; Hickner, M. A.; Kohl, P. A.; Kucernak, A. R.; Mustain, W. E.; Nijmeijer, K.; Scott, K.; Xu, T.; Zhuang, L.; Zhuang; Zhuang; Zhuang; Zhuang; Zhuang. Energy & Environ. Sci. 2014, 7, 3135–3191.
(9) Fujiwara, N.; Siroma, Z.; Yamazaki, S.; Ioroi, T.; Senoh, H.; Yasuda, K. J. Power Sources 2008,
185, 621–626.
(10) Ma, L.; Chu, D.; Chen, R. Int. J. Hydrog. Energy 2012, 37, 11185–11194. (11) Bianchini, C.; Shen, P. K. Chem. Rev. 2009, 109, 4183–4206.
(12) Fang, X.; Wang, L.; Shen, P. K.; Cui, G.; Bianchini, C. J. Power Sources 2010, 195, 1375–1378. (13) Xu, C.; Shen, P. kang; Liu, Y. J. Power Sources 2007, 164, 527–531.