A ut omatic all y gener at ed rough PDF by Pr oo fCheck fr om Ri ver V alle y Tec hnologies Lt d
Hamida Bouhenni
1/ Hadjer Daoudi
1/ Haidar Djemai
2,3,4/ Abdelkader Rouabah
1/
Damien Vitiello
2,3,4,5,a/ Leila Rouabah
6,aMetabolic syndrome, leptin-insulin resistance
and uric acid: a trinomial foe for Algerian
city-dweller adolescents’ health
1Laboratory of Molecular and Cellular Biology, Faculty of Natural Sciences and Life Sciences, Mentouri Brothers University,
Constantine, Algeria
2IRMES - Institute for Research in bioMedicine and Epidemiology of Sport, Paris, France
3EA 7329, Paris Descartes University, Sorbonne Paris Cité, Paris, France
4National Institute of Sport, Expertise and Performance – INSEP, Paris, France
5School of Sport Sciences, Paris Descartes University, Paris, France
6Faculty of Natural Sciences and Life Sciences, Mentouri Brothers University, Constantine, 1 Ain El Bey Street, 25000,
Constan-tine, Algeria, Tel: +213777065109„ E-mail: leilarouabah27@yahoo.fr Abstract:
Background: Adolescence is one of the critical periods where increased risk for long-term obesity-related com-plications is an important health concern. This highlights the need to perform early diagnostics based on precise biomarkers to decrease the risk of complications in adolescents with obesity.
Objective: To determine the relationships between serum levels of uric acid (UA), leptin and insulin with metabolic syndrome (MS) components in Algerian adolescents.
Subjects: Nondiabetic adolescents (n = 204).
Methods: Blood pressure (BP) and anthropometric measurements were performed using standardized tech-niques. Blood samples were taken for determination of glycemia, triglyceridemia, uricemia, cholesterolemia, leptinemia and insulinemia.
Results: The rate of MS among an excess weight group was 17.4% [95% confidence interval (CI)]. Serum levels of UA, leptin and insulin were significantly higher in the excess weight group compared to a normal weight group (279.4 ± 86.05 vs. 204.9 ± 50.34 μmol/L and 25.65 ± 14.01 vs. 4.09 ± 2.60 μg/L, p < 0.001; 24.58 ± 13.85 vs. 13.34 ± 6.41 μIU/L, p < 0.05). Serum levels of UA, leptin and insulin were significantly higher in adoles-cents with MS compared to those without MS (304.86 ± 111.41 vs. 224.72 ± 77.81 μmol/L, 30.26 ± 12.46 vs. 16.93 ± 14.97 μg/L and 30.91 ± 17.30 vs. 18.71 ± 10.14 μIU/L, p < 0.05, respectively). Significant correlations were found between UA and leptin with waist circumference (r = 0.50 and 0.76), diastolic blood pressure (r = 0.58 and 0.43), triglycerides (r = 0.42 and 0.35) and high-density lipoprotein-cholesterol (r = −0.36 and −0.35).
Conclusion: Serum levels of UA and leptin may be useful biomarkers for early diagnosis of the risk of MS in our Algerian adolescent population.
Keywords: adolescents, metabolic hormones, metabolic syndrome, obesity, uric acid DOI: 10.1515/ijamh-2017-0076
Received: May 2, 2017; Accepted: June 20, 2017
Introduction
During the last decades, the prevalence of childhood obesity has increased worldwide, reaching epidemic pro-portions and becoming a growing public health problem [1]. Adolescence is one of the critical periods for the onset or persistence of obesity and the development of its complications [2].
Obesity is a major risk factor for chronic diseases namely hypertension, dislipidemia, type II diabetes mel-litus (DM2) and cardiovascular disease [3]. The coexistence of obesity and hyperinsulinemia, glucose intoler-ance, hypertension, high serum levels of triglycerides (TG) and decreased levels of high-density lipoprotein-cholesterol (HDL-c), is known as metabolic syndrome (MS) [1]. The purpose of defining MS is to provide a
Leila Rouabah is the corresponding author.
aDamien Vitiello and Leila Rouabah contributed equally to this work.
all y gener at ed rough PDF by Pr oo fCheck fr om Ri ver V alle y Tec hnologies Lt d
simple diagnostic and clinical tool to do early detection of subjects who are at greater risk of developing DM2 and cardiovascular diseases.
The worldwide prevalence of MS has increased in the last decades. Using the International Diabetes Federa-tion (IDF) criteria, the prevalence of MS was 3.6% among Jordanian youth (16–18 years) [4], 13% among United Arab Emirates adolescents (12–18 years) [5] and 4.5% among adolescents in the United States (12–17 years) [6]. Only one study was performed in Algeria among 989 adolescent students (12–18 years) and the prevalence of the MS found was 1.3% for boys and 0.5% for girls [7]. In addition, several reports have demonstrated that 30 to 50% of overweight youth exhibit the MS phenotype [8], [9]. These estimates are suggestive of dramatically increased risk for long-term obesity-related health consequences in this population [10] and highlight the need to do early diagnostics based on precise biomarkers of MS.
Among these biomarkers, the high-level of serum uric acid (UA) is associated with cardiovascular adverse outcomes, insulin resistance, DM2 and MS [11]. Interestingly, Feig and Johnson have suggested that UA might have a role in the early pathogenesis of primary hypertension [12], a condition frequently found in subjects with obesity. Adipose tissue-derived adipokines (e.g. leptin, resistin, visfatin and adiponectin) and myokines (e.g. myostatin and interleukin 6) have been related to insulin sensitivity. Leptin has gained increasing atten-tion in pediatrics as a serum biomarker due to its correlaatten-tion to various metabolic risk factors such as insulin resistance, MS and cardiovascular disease [13]. Other authors have demonstrated that differences in the acute transcriptional response to insulin are primarily driven by obesity per se, challenging the notion of healthy obese adipose tissue, at least in severe obesity [14].
However, the relationships between UA serum concentrations and MS in adolescents have not been fully addressed. Moreover, to date, studies exploring relationships between UA serum concentration, the hormonal resistance linked to obesity and MS are lacking in adolescents. The study of these relationships may be useful to better understand the pathogenesis of MS and to improve its diagnostic among this specific population.
In this context, the aims of the present study were to estimate the prevalence of MS and to explore the rela-tionships of the components of MS with UA serum concentration and leptin-insulin resistance in adolescents from the Jijel province, Algeria.
Materials and methods
Study population
A total of 204 students from the School Health Screening Unit of the Jijel province (North-Eastern part of Al-geria) were included in the study during the school year 2015–2016. Students aged between 10 and 18.9 years were included in the study and considered as adolescents as defined by the World Health Organization (WHO) [15]. Among these students, 89 had a normal weight (NW), 17 were overweight (OW), 75 with obesity (OB) and 23 with morbid obesity (OB+). Subjects with a history of cardiovascular diseases, diabetes, liver or renal dis-eases, under medication and with a history of alcohol consumptions and smoking were excluded. A written consent was obtained from all participants and their parents and they were assured about the confidentiality of the study. The study was carried out in accordance with the Declaration of Helsinki (1989) of the World Medical Association and the research council of the Laboratory of Molecular and Cellular Biology, Faculty of Natural Sciences and Life Sciences, Mentouri brothers University (Algeria) approved the study protocol. Our experimental protocol conforms to the relevant ethical guidelines for human research.
Anthropometric measures
At the School Health Screening Unit of the Jijel province, all adolescents underwent the measurements of height (H), weight (W) [16] and waist circumference (Wc) [17].
BMI z-score
The body mass index (BMI) was calculated by dividing weight (kg) by height (m) squared (kg/m2). For the
classification of BMI, we have used the reference curves of the WHO [18] as follow: morbid obesity > +3 SD (standard deviation); obesity > +2 SD; overweight > +1 SD and normal weight −1 > SD < +1. The z-score values
A ut omatic all y gener at ed rough PDF by Pr oo fCheck fr om Ri ver V alle y Tec hnologies Lt d
Determination of the MS in the study population
The diagnosis of MS was performed according to the IDF criteria; MS was diagnosed when abdominal obesity was associated with two of the following criteria [19]: in adolescents aged between 10 and 16 years old: Wc >90th percentile, HDL-c levels < 1.03 mmol/L, TG ≥ 1.7 mmol/L, systolic blood pressure (SBP) ≥ 130 mm Hg or diastolic blood pressure (DBP) ≥ 85 mm Hg and fasting plasma glucose (FPG) ≥ 5.6 mmol/L and in adolescents aged between 16 and 19 years old: Wc ≥ 94 cm in males and ≥ 80 cm in females, HDL-c levels < 1.03 mmol/L in males and <1.29 mmol/L in females, TG ≥ 1.7 mmol/L, SBP ≥ 130 mm Hg and / or DBP ≥ 85 mm Hg and fasting glucose ≥ 5.6 mmol/L.
Blood sampling and biomarkers measurements
Venous blood samples were taken after semi supine rest for at least 15 min from all adolescents under a fasting state in the morning. Serum samples were centrifuged (1500 g, 15 min, 4 °C) and immediately frozen at −80 °C or immediately analyzed for the measurement of FPG, TG, total cholesterol (TC), HDL-c, UA and urea using colorimetric enzymatic assays and creatinine using colorimetric-kinetic assay (Spinreact, Girona, Spain). The low-density lipoprotein-cholesterol (LDL-c) was calculated according to the Friedewald formula [20]. Further plasma levels of leptin and insulin measurements were performed by enzyme-linked immunosorbent assay using specific kits (Sigma-Aldrich, Saint Quentin Fallavier, France), in 40 adolescents (20 boys and 20 girls) divided into four groups of corpulence. We also evaluated insulin resistance using the homeostasis model assessment for insulin resistance (HOMA-IR) index.
Blood pressure
Blood pressure (BP) was measured two times after rest for at least 15 min in sitting position from all adolescents using an automatic blood pressure monitor (Tensoval duo control, HARTMANN, Saintes, Belgium).
Statistical analysis
All data were analyzed with SPSS, version 20.0, software (IBM, Bois-Colombes, France). One-way ANOVA and Fisher’s least significant difference test were used to compare the difference between parameters in the study groups. The chi-squared test was used to compare the difference between prevalence of characteristics. Pear-son’s correlation was used to examine the relationships between variables. Receiver-operating characteristic (ROC) curves were also used to assess the predicted probability of UA, leptin, insulin and HOMA-IR on the presence MS. All data in the tables and figures were presented as means ± SD and as percentage. p-Value <0.05 was considered statistically significant vs. values of NW group and values of adolescents without IDF MS cri-teria.
Results
Baseline characteristics of the study population and blood parameters analysis
The W, BMI and Wc presented significant differences between OW, OB, OB+ and NW adolescents (Table 1). All the blood parameters presented significant differences between OW, OB, OB+ and NW adolescents, excepted for creatinine and urea (Table 1). For example, the HDL-c were significantly lower in OW, OB and OB+ adolescents compared to NW (−14.39%, −15.83% and −24.46%, respectively, p < 0.001). The SBP was significantly higher in OW, OB and OB+ compared to NW (+5.37 mm Hg, +14.98 mm Hg and +15.17 mm Hg, respectively, p < 0.001). The DBP was significantly higher in OW, OB and OB+ compared to NW (+4.55 mm Hg, +8.70 mm Hg and +8.66 mm Hg, respectively, p < 0.001) (Table 1). Considering the effect of gender, our results showed that UA serum levels were higher in male groups compared to female groups (261.57 ± 85.17 vs. 230.84 ± 74.23; p < 0.01) (Table 1). Our analysis of baseline characteristics and blood parameters by sex and degree of obesity demonstrated that there was a significant difference between four groups in the majority of parameters, except urea and creatinine serum levels in both sex and TC levels in female group (Table 1). Regarding a comparison between girls and boys in each corpulence group, there was a significant difference between means of UA serum levels
all y gener at ed rough PDF by Pr oo fCheck fr om Ri ver V alle y Tec hnologies Lt d
in NW group (191.45 ± 38.93 vs. 218.14 ± 56.80; p < 0.01) and between means of BMI in OB group (30.02 ± 2.37 vs. 28.40 ± 2.75; p < 0.01).
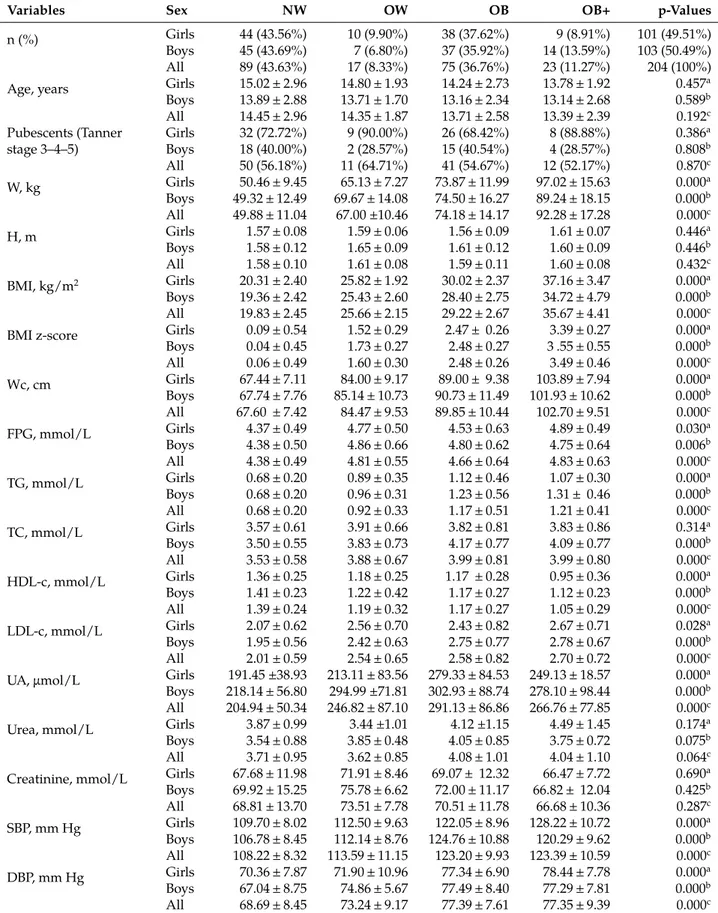
Table 1: Baseline characteristics and blood parameters of adolescents with normal weight, overweight and obesity.
Variables Sex NW OW OB OB+ p-Values
n (%) Girls 44 (43.56%) 10 (9.90%) 38 (37.62%) 9 (8.91%) 101 (49.51%)
Boys 45 (43.69%) 7 (6.80%) 37 (35.92%) 14 (13.59%) 103 (50.49%)
All 89 (43.63%) 17 (8.33%) 75 (36.76%) 23 (11.27%) 204 (100%)
Age, years Girls 15.02 ± 2.96 14.80 ± 1.93 14.24 ± 2.73 13.78 ± 1.92 0.457a
Boys 13.89 ± 2.88 13.71 ± 1.70 13.16 ± 2.34 13.14 ± 2.68 0.589b All 14.45 ± 2.96 14.35 ± 1.87 13.71 ± 2.58 13.39 ± 2.39 0.192c Pubescents (Tanner stage 3–4–5) Girls 32 (72.72%) 9 (90.00%) 26 (68.42%) 8 (88.88%) 0.386a Boys 18 (40.00%) 2 (28.57%) 15 (40.54%) 4 (28.57%) 0.808b All 50 (56.18%) 11 (64.71%) 41 (54.67%) 12 (52.17%) 0.870c W, kg Girls 50.46 ± 9.45 65.13 ± 7.27 73.87 ± 11.99 97.02 ± 15.63 0.000a Boys 49.32 ± 12.49 69.67 ± 14.08 74.50 ± 16.27 89.24 ± 18.15 0.000b All 49.88 ± 11.04 67.00 ±10.46 74.18 ± 14.17 92.28 ± 17.28 0.000c H, m Girls 1.57 ± 0.08 1.59 ± 0.06 1.56 ± 0.09 1.61 ± 0.07 0.446a Boys 1.58 ± 0.12 1.65 ± 0.09 1.61 ± 0.12 1.60 ± 0.09 0.446b All 1.58 ± 0.10 1.61 ± 0.08 1.59 ± 0.11 1.60 ± 0.08 0.432c BMI, kg/m2 Girls 20.31 ± 2.40 25.82 ± 1.92 30.02 ± 2.37 37.16 ± 3.47 0.000a Boys 19.36 ± 2.42 25.43 ± 2.60 28.40 ± 2.75 34.72 ± 4.79 0.000b All 19.83 ± 2.45 25.66 ± 2.15 29.22 ± 2.67 35.67 ± 4.41 0.000c
BMI z-score Girls 0.09 ± 0.54 1.52 ± 0.29 2.47 ± 0.26 3.39 ± 0.27 0.000a
Boys 0.04 ± 0.45 1.73 ± 0.27 2.48 ± 0.27 3 .55 ± 0.55 0.000b All 0.06 ± 0.49 1.60 ± 0.30 2.48 ± 0.26 3.49 ± 0.46 0.000c Wc, cm Girls 67.44 ± 7.11 84.00 ± 9.17 89.00 ± 9.38 103.89 ± 7.94 0.000a Boys 67.74 ± 7.76 85.14 ± 10.73 90.73 ± 11.49 101.93 ± 10.62 0.000b All 67.60 ± 7.42 84.47 ± 9.53 89.85 ± 10.44 102.70 ± 9.51 0.000c FPG, mmol/L Girls 4.37 ± 0.49 4.77 ± 0.50 4.53 ± 0.63 4.89 ± 0.49 0.030a Boys 4.38 ± 0.50 4.86 ± 0.66 4.80 ± 0.62 4.75 ± 0.64 0.006b All 4.38 ± 0.49 4.81 ± 0.55 4.66 ± 0.64 4.83 ± 0.63 0.000c TG, mmol/L Girls 0.68 ± 0.20 0.89 ± 0.35 1.12 ± 0.46 1.07 ± 0.30 0.000a Boys 0.68 ± 0.20 0.96 ± 0.31 1.23 ± 0.56 1.31 ± 0.46 0.000b All 0.68 ± 0.20 0.92 ± 0.33 1.17 ± 0.51 1.21 ± 0.41 0.000c TC, mmol/L Girls 3.57 ± 0.61 3.91 ± 0.66 3.82 ± 0.81 3.83 ± 0.86 0.314a Boys 3.50 ± 0.55 3.83 ± 0.73 4.17 ± 0.77 4.09 ± 0.77 0.000b All 3.53 ± 0.58 3.88 ± 0.67 3.99 ± 0.81 3.99 ± 0.80 0.000c HDL-c, mmol/L Girls 1.36 ± 0.25 1.18 ± 0.25 1.17 ± 0.28 0.95 ± 0.36 0.000a Boys 1.41 ± 0.23 1.22 ± 0.42 1.17 ± 0.27 1.12 ± 0.23 0.000b All 1.39 ± 0.24 1.19 ± 0.32 1.17 ± 0.27 1.05 ± 0.29 0.000c LDL-c, mmol/L Girls 2.07 ± 0.62 2.56 ± 0.70 2.43 ± 0.82 2.67 ± 0.71 0.028a Boys 1.95 ± 0.56 2.42 ± 0.63 2.75 ± 0.77 2.78 ± 0.67 0.000b All 2.01 ± 0.59 2.54 ± 0.65 2.58 ± 0.82 2.70 ± 0.72 0.000c
UA, μmol/L Girls 191.45 ±38.93 213.11 ± 83.56 279.33 ± 84.53 249.13 ± 18.57 0.000a
Boys 218.14 ± 56.80 294.99 ±71.81 302.93 ± 88.74 278.10 ± 98.44 0.000b
All 204.94 ± 50.34 246.82 ± 87.10 291.13 ± 86.86 266.76 ± 77.85 0.000c
Urea, mmol/L Girls 3.87 ± 0.99 3.44 ±1.01 4.12 ±1.15 4.49 ± 1.45 0.174a
Boys 3.54 ± 0.88 3.85 ± 0.48 4.05 ± 0.85 3.75 ± 0.72 0.075b
All 3.71 ± 0.95 3.62 ± 0.85 4.08 ± 1.01 4.04 ± 1.10 0.064c
Creatinine, mmol/L Girls 67.68 ± 11.98 71.91 ± 8.46 69.07 ± 12.32 66.47 ± 7.72 0.690a
Boys 69.92 ± 15.25 75.78 ± 6.62 72.00 ± 11.17 66.82 ± 12.04 0.425b All 68.81 ± 13.70 73.51 ± 7.78 70.51 ± 11.78 66.68 ± 10.36 0.287c SBP, mm Hg Girls 109.70 ± 8.02 112.50 ± 9.63 122.05 ± 8.96 128.22 ± 10.72 0.000a Boys 106.78 ± 8.45 112.14 ± 8.76 124.76 ± 10.88 120.29 ± 9.62 0.000b All 108.22 ± 8.32 113.59 ± 11.15 123.20 ± 9.93 123.39 ± 10.59 0.000c DBP, mm Hg Girls 70.36 ± 7.87 71.90 ± 10.96 77.34 ± 6.90 78.44 ± 7.78 0.000a Boys 67.04 ± 8.75 74.86 ± 5.67 77.49 ± 8.40 77.29 ± 7.81 0.000b All 68.69 ± 8.45 73.24 ± 9.17 77.39 ± 7.61 77.35 ± 9.39 0.000c
A ut omatic all y gener at ed rough PDF by Pr oo fCheck fr om Ri ver V alle y Tec hnologies Lt d
NW, normal weight group; OW, overweight group; OB, group with obesity; OB+, group with morbid obesity; n, number of subjects; W, weight; H, height; BMI, body mass index; Wc, waist circumference; FPG, fasting plasma glucose; TG, triglycerides; TC, total cholesterol; HDL-c, high-density lipoprotein-cholesterol; LDL-c, low-density lipoprotein-cholesterol; UA, uric acid; SBP, systolic blood pressure and DBP, diastolic blood pressure. Variables are expressed as mean ± SD and as percentage. Differences are significant at p < 0.05 between four groups of corpulence in girls (a), boys (b) and all population (c).
Fisher’s least significant difference test showed that Wc was significantly higher in OW, OB and OB+ com-pared to NW (+24.96%, +32.91% and +51.92%, respectively, in both comparisons p < 0.001). This test also showed that FPG was significantly different between the NW group and the other three groups [+9.82% (p < 0.004), +6.39% (p < 0.002) and +10.27% (p < 0.001), respectively] and so for HDL-c [+26.37% (p < 0.01), +28.36% (p < 0.001) and +34.33% (p < 0.001), respectively]. No significant difference was found between OW, OB and OB+ groups. The TG serum level was significantly higher in OW, OB and OB+ groups [+35.29% (p < 0.02), +72.06% (p < 0.001) and +77.94% (p < 0.01), respectively] compared to the NW group. Nno significant difference was found between OB and OB+ groups.
The calculated frequency of MS (the proportion of adolescents with MS in each group of corpulence) was 11.8% among OW, 16% among OB, 26% among OB+ and 0% among NW adolescents (95% CI, p < 0.001).
The assessment of UA
The serum concentration of UA was significantly increased by, respectively, 20.44%, by 42.44% and by 30.16% in OW (p < 0.05), OB and OB+ (p < 0.001) adolescents compared to NW (Figure 1). The serum concentration of UA was also 18.27% higher in OB adolescents compared to OW (p < 0.05) and no significant difference was found between OB and OB+ groups.
Figure 1: Serum concentration of uric acid in adolescents with normal weight, overweight and obesity. NW, normal weight group; OW, overweight group; OB, group with obesity; OB+, group with morbid obesity and UA, uric acid. Val-ues are expressed as mean ± SD. (a) compared to UA valVal-ues of the NW group and (b) compared to UA valVal-ues of the OW group. *p < 0.05 and ***p < 0.001.
The frequency of hyperuricemia was 26.08% among excess weight adolescents (OW, OB and OB+) and 2.3% among NW adolescents. The serum concentration of UA was significantly higher in adolescents with MS compared to their counterparts without MS in four of the five criteria of MS, namely abdominal obesity, hypertriglyceridemia, elevated BP (p < 0.001) and low HDL-c (p < 0.01) (Figure 2).
all y gener at ed rough PDF by Pr oo fCheck fr om Ri ver V alle y Tec hnologies Lt d
Figure 2: Uric acid serum concentration and IDF metabolic syndrome criteria in the study population. BP, blood pres-sure; HDL-c, high-density lipoprotein-cholesterol and UA, uric acid. IDF metabolic syndrome criteria: abdominal obesity (for adolescents aged 10–16 years: waist circumference ≥90th percentile and for adolescents aged more 16 years: waist circumference ≥94 cm in males and ≥80 cm in females); hypertriglyceridemia (triglycerides ≥ 1.7 mmol/L; low HDL-c (for adolescents aged 10–16 years: HDL-c <1.03 mmol/L and for adolescents aged more 16 years: HDL-c <1.03 mmol/L in males and <1.29 mmol/L in females); elevated BP (systolic blood pressure ≥130 mm Hg and/or diastolic blood pressure ≥85 mm Hg) and hyperglycemia (fasting plasma glucose ≥5.6 mmol/L). Values are expressed as mean ± SD. **p < 0.01 and ***p < 0.001 vs. values of adolescents without criterion.
The serum concentration of UA was significantly higher in adolescents with MS compared to those without MS (313 μmol/L vs. 239 μmol/L, p < 0.001).
There were significant positive correlations between the serum concentration of UA and BMI (0.42), Wc (0.40), SBP (0.33), DBP (0.29), TG (0.34), LDL-c (0.27) (p < 0.001) and TC (0.19) (p < 0.01) in the study population. The serum concentration of UA was also significantly negatively correlated with HDL-c (−0.26) (p < 0.001). No significant correlation was found between the serum concentration of UA and FPG.
The assessments of UA, insulin and leptin resistance
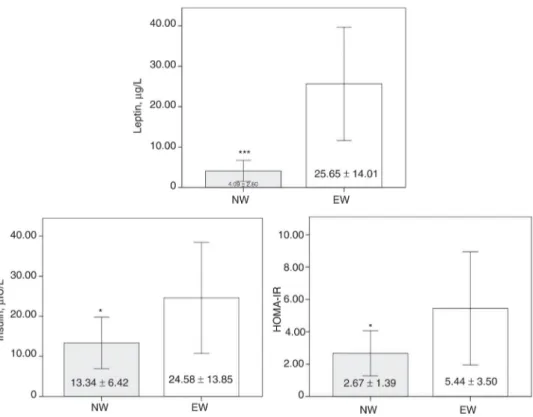
We only could assess the serum concentration of insulin and leptin in 40 (20 boys and 20 girls) among the study population. These adolescents were also divided in four groups (five boys and five girls per group) namely NW (13.70 ± 0.33 years, 80% puberty and Wc: 64.60 ± 0.99 cm ), OW (14.40 ± 0.48 years, 60% puberty and Wc: 82.70 ± 3.21 cm), OB (13.60 ± 0.43 years, 80% puberty and Wc: 90.50 ± 2.4 cm ) and OB+ (14.60 ± 0.40 years, 50% puberty and Wc: 107.10 ± 1.66 cm).
Comparisons between NW and the excess weight group (EW) (i.e. OW and OB and OB+) showed signifi-cant differences in serum concentrations of leptin (+527.14%, p < 0.001) and insulin (+84.26%, p < 0.05) and in HOMA-IR (+103.75%, p < 0.05) (Figure 3).
A ut omatic all y gener at ed rough PDF by Pr oo fCheck fr om Ri ver V alle y Tec hnologies Lt d
Figure 3: Serum concentrations of leptin and insulin and insulin resistance index in normal weight and excess weight adolescents. NW, normal weight group; EW: excess weight group (overweighed + adolescents with obesity and morbid obesity) and HOMA-IR: homeostasis model assessment of insulin resistance. Values are expressed as mean ± SD. *p < 0.05 and ***p < 0.001 values vs. NW values.
Adolescents without MS had a significant lower serum concentrations of UA (−26.29%, p < 0.01), leptin (−44.05%, p < 0.01) and insulin (−39.47%, p < 0.01) compared to their peers with MS (Figure 4). The HOMA-IR index was significantly increased in adolescents with MS compared to those without MS (+95.04%, p < 0.01) (Figure 4).
all y gener at ed rough PDF by Pr oo fCheck fr om Ri ver V alle y Tec hnologies Lt d
Figure 4: Serum concentrations of uric acid, leptin and insulin and insulin resistance index in adolescents with and with-out metabolic syndrome. HOMA-IR: homeostasis model assessment of insulin resistance and MS: metabolic syndrome. Metabolic syndrome is abdominal obesity and two other IDF criteria among abdominal obesity (for adolescents aged 10– 16 years: waist circumference ≥90th percentile and for adolescents aged more 16 years: waist circumference ≥94 cm in males and ≥80 cm in females); hypertriglyceridemia (triglycerides ≥1.7 mmol/L); low HDL-c (for adolescents aged 10–16 years: HDL-c <1.03 mmol/L and for adolescents aged more 16 years: HDL-c <1.03 mmol/L in males and <1.29 mmol/L in females); elevated blood pressure (systolic blood pressure ≥130 mm Hg and/or diastolic blood pressure ≥85 mm Hg) and hyperglycemia (fasting plasma glucose ≥5.6 mmol/L). Values are expressed as mean ± SD. **p<0.01 vs. values of adolescents without metabolic syndrome.
Relationships between UA, insulin and leptin resistance and MS
There were significant positive correlations between Wc and FPG with insulin serum concentration (p < 0.05 and p < 0.01, respectively) and between leptin and UA serum concentrations with BMI (p < 0.001 and p < 0.01, respectively), Wc (p < 0.001), TG (p < 0.05 and p < 0.01), DBP (p < 0.001), LDL-c (p < 0.01 and p < 0.05) in the 40 normal weight, overweighed and adolescents with obesity (Table 2). There were significant negative correla-tions between leptin and UA serum concentracorrela-tions, BMI and Wc with HDL-c (p < 0.05, p < 0.01, p < 0.01 and p < 0.001, respectively) (Table 2). No significant correlations were found between the serum concentrations of UA, leptin and insulin. Considering the effect of gender, there was no significant correlation between UA/in-sulin, UA/leptin and leptin/insulin serum levels among all adolescents. There was a significant correlation between UA/insulin (R = 0.53; p < 0.05) bu not between UA/leptin and leptin/insulin serum levels in boys (Ta-ble 2). There was a significant correlation between UA/leptin (R = 0.60; p < 0.01) but not between UA/insulin and leptin/insulin levels in girls (Table 2).
A ut omatic all y gener at ed rough PDF by Pr oo fCheck fr om Ri ver V alle y Tec hnologies Lt d T able 2: P earson ’s correlation coefficients betw een ant hropometric v ariables and blood par ameters and metabolic hor mones in adolescents wit h nor mal w eight, o v er w eight and obesity . N=40 V ar iables Sex BMI, kg/m 2 Wc, cm SBP ,mm Hg DBP ,mm Hg FPG, mmol/L T G, mmol/L T C, mmol/L HDL -c, mmol/L LDL -c, mmol/L U A, μ mol/L Ins, μ IU/L Wc Gir ls 0.92 c Bo ys 0.95 c All 0.92 c SBP Gir ls 0.70 c 0.60 b Bo ys 0.45 0.60 b All 0.58 c 0.60 c DBP Gir ls 0.35 0.26 0.66 c Bo ys 0.60 b 0.65 b 0.49 a All 0.47 b 0.46 b 0.58 c FPG Gir ls 0.20 0.14 0.03 –0.10 Bo ys 0.37 0.30 –0.03 0.36 All 0.28 0.22 0.00 0.14 T G Gir ls 0.20 0.22 0.27 0.30 0.48 a Bo ys 0.46 0.46 a 0.13 0.11 0.29 All 0.34 a 0.35 a 0.19 0.18 0.36 a T C Gir ls 0.19 0.22 0.08 0.22 0.21 0.11 Bo ys 0. 21 0.19 –0.08 0.26 0.36 0.47 a All 0.20 0.21 0.00 0.24 0.27 0.30 HDL -c Gir ls –0.46 a –0.44 a –0.10 –0.05 –0.26 –0.30 0.37 Bo ys –0.50 a –0.56 b –0.52 a –0.35 –0.24 –0.51 a 0.08 All –0.48 b –0.49 c –0.31 –0.20 –0.26 –0.42 b 0.23 LDL -c Gir ls 0.43 0.45 a 0.12 0.24 0.32 0.17 0.89 c –0.09 Bo ys 0.41 0.41 0.16 0.42 0.44 0.60 b 0.90 c –0.35 All 0.41 b 0.43 b 0.14 0.33 a 0.37 a 0.41 b 0.89 b –0.22 U A Gir ls 0.60 b 0.61 b 0.34 0.40 0.10 0.46 a 0.09 –0.41 0.27 Bo ys 0.54 a 0.47 a 0.15 0.32 0.41 0.48 a 0.21 –0.45 0.38
all y gener at ed rough PDF by Pr oo fCheck fr om Ri ver V alle y Tec hnologies Lt d 0.49 b 0.50 c 0.18 0.32 a 0.23 0.42 b 0.19 –0.36 a 0.34 a ls 0.25 0.38 0.02 –0.29 0.41 –0.10 0.43 –0.01 0.48 a –0.07 ys 0.41 0.36 0.20 0.04 0.40 0.21 –0.09 –0.48 a 0.12 0.53 a 0.31 a 0.37 a 0.10 –0.14 0.40 b 0.07 0.18 –0.23 0.31 0.24 (μ g/L) ls 0.84 c 0.80 c 0.70 c 0.43 0.24 0.310 0.19 –0.29 0.33 0.60 b 0.22 ys 0.72 c 0.73 c 0.61 b 0.44 0.25 0.41 0.36 –0.42 0.52 a 0.22 0.07 0.79 c 0.76 c 0.66 c 0.43 c 0.25 0.35 a 0.26 –0.35 a 0.41 b 0.31 0.15 mass index; Wc, w ais t circumf erence; SBP ,sys tolic blood pressure; DBP ,dias tolic blood pressure; FPG, fas ting plasma glucose; y cerides; T C, to tal choles terol; HDL-c, high-density lipopro tein-choles terol; LDL-c, lo w -density lipopro tein-choles terol; U A ,uric insulin and Lep, lep tin. Signific ant correlation: ap < 0.05; bp < 0.01 and cp < 0.001.
A ut omatic all y gener at ed rough PDF by Pr oo fCheck fr om Ri ver V alle y Tec hnologies Lt d
The area under the ROC curves (AUC) showed that the predicted probabilities of UA, leptin, insulin and HOMA-IR on the presence of MS in the 40 adolescents were, respectively, 0.72 ± 0.09, 0.75 ± 0.08, 0.74 ± 0.10, 0.75 ± 0.10 (p < 0.05). The predicted probability of UA with leptin and insulin on the presence of MS was 0.87 ± 0.06 (p < 0.001).
Discussion
In the present study, the prevalence of MS ranged from 0% for NW adolescents to 26% for OB+ adolescents according to the IDF criteria. We also demonstrated that UA serum level was significantly higher in OW, OB and OB+ adolescents compared to their NW peers. Interestingly, the serum concentration of UA was significantly increased in adolescents with MS and was significantly correlated with BMI, Wc, BP, TG, TC, HDL-c and LDL-c in the study population. In addition, we further demonstrated in 40 adolesLDL-cents that serum levels of leptin and insulin and HOMA-IR were significantly higher in excess weight adolescents compared to their NW peers. Moreover, these three variables and UA serum level were significantly increased in the adolescents with MS of the aforementioned population. Finally, we report that leptin and UA serum levels were significantly correlated with several variables of MS such as BMI, Wc, DBP, TG, HDL-c and LDL-c among these 40 adolescents.
The prevalence of childhood and adolescence obesity has increased [21] worldwide but with very different values. For example, the prevalence of MS ranged from 0% among NW to 40.3% among Argentine adoles-cents with overweight or obesity [22] and attained 3.6% among Jordanian youth (16–18 years) [4]. Thus, direct comparison is difficult as the studies used different definitions of obesity, abdominal obesity, blood pressure and MS, included large populations while others included only overweight and/or children and adolescents with obesity. In addition, only one study has been performed in Algeria in which the authors report that the prevalence of MS was 0.2% among NW, 4.1% among OW and 7.4% among adolescents with obesity [7]. In the present study, we also demonstrated an increased prevalence of MS with corpulence in Algerian adolescents. It was ranged from 0% among NW, 11.8% among OW and 16% among OB adolescents. We further reported the prevalence of MS among adolescents with morbid obesity which attained 26%. Thus, the prevalence of MS is also increased in Algerian adolescents which could unfortunately lead to the development of several com-plications like cardiovascular disease and DM2 in adulthood [3]. Thus, it is warranted to diagnose the MS early in adolescents with precise biomarkers to prevent its complications.
Among these biomarkers, the serum concentration of UA has recently emerged in the literature. In a meta-analysis, authors reported that high-level of UA is a risk factor of MS in adults [23]. Moreover, a recent study showed that adolescents with obesity exhibited a higher level of UA serum compared to their NW peers [24]. Accordingly to this previous study, we demonstrated that the serum concentration of UA was significantly higher in OW, OB and OB+ adolescents compared to NW adolescents. In addition, a high-level of UA serum has been associated with cardiovascular adverse outcomes, insulin resistance, DM2 and MS in OW or children and adolescents with obesity [11]. In the present study, we also confirmed that hyperuricemia observed in excess weight groups is associated with four of the five IDF criteria of MS (i.e. abdominal obesity, hypertriglyceridemia, low HDL-c and elevated blood pressure) and further reported significant correlations between high-level of UA serum and these four criteria of MS supporting the importance to assess of UA serum level for early detection of MS in Algerian adolescents.
Some mechanisms could explain the relation between hyperuricemia; obesity and MS. One of them could be the increased intake of fructose-rich products in the recent years that would induce an increased synthesis of urea in adolescents [25], [26]. In our study, the increased serum concentration of UA with corpulence and the significant increase of UA serum level among adolescents with MS compared to those without MS might be the consequence of the higher consumption of sweetened beverages or food in the excess weight group compared to the NW group. Sugar-sweetened beverages are the primary source of added sugar in the diet of children and adolescents coinciding with an increased prevalence of obesity [27]. Moreover, we reported that the serum concentration of insulin doubled in the excess weight adolescents compared to their NW peers. This result is in accordance with the one of Weiss et al. [9] where the insulin serum concentration was significantly increased in OW and OB adolescents compared to their NW peers. Interestingly, we further demonstrated that high-level of insulin serum was found in adolescents with MS but not in adolescents without MS. Thus, our adolescents with MS had high-level of UA serum and high-level of insulin serum which may be a mechanism leading to a further increase of the serum concentration of UA. One last mechanism could be hyperleptinemia. Indeed, a recent study has demonstrated that leptin and UA were strong predictors of MS in adults [28]. In our study, we demonstrated that the serum concentration of leptin was 6 times higher in the excess weight adolescents in comparison with NW adolescents. This result is in line with the increased serum level of leptin in children and adolescents with obesity found elsewhere [29], [30], [31], [32]. Interestingly, we also demonstrated that
all y gener at ed rough PDF by Pr oo fCheck fr om Ri ver V alle y Tec hnologies Lt d
adolescents with MS exhibited the highest serum level of leptin suggesting a link between hyperleptinemia and the appearance of MS in these Algerian adolescents. All in all, a growing body of evidence demonstrates that UA, leptin and insulin serum levels are increased in adults and adolescents according the degree of obesity and that hyperinsulinemia and hyperleptinemia may be pathological conditions leading to hyperuricemia in adults but also in adolescents that is finally associated with the development of obesity and MS.
Few studies have investigated the potential relationships of serum levels of UA, leptin and insulin with components of MS. One study reported a significant positive correlation between UA and leptin serum concen-trations in adult women [33]. These authors also notably reported significant positive correlation between UA serum concentration and other parameters like BMI, SBP, DBP, TC and HOMA-ratio suggesting that UA and leptin are associated with the development of MS in adult women. Moreover, other authors reported significant positive correlations between insulin and DBP and between UA and Wc and TG in young females with obesity [34]. In this study, we found significant positive correlations between serum concentrations of UA and leptin with Wc, DBP, TG and LDL-c. We also found significant negative correlations between serum concentrations of UA and leptin with HDL-c. There was also a significant positive correlation between these three parame-ters and Wc. The discrepancies between studies might be explained by a lower degree of hyperuricemia and insulin-leptin resistance and a lower interaction between metabolic and sexual hormones between adults and adolescents [35], [36]. Our results demonstrate that UA and leptin are two biomarkers significantly associated with three of the five IDF criteria of MS (i.e. abdominal obesity, elevated BP and decreased HDL-c) in our adolescents. These results reinforce the fact that UA may be a significant predictor of MS in this specific popu-lation. Of note, to our knowledge, the present study is the first one to investigate the association of UA, leptin and insulin with MS in adolescents in Algeria. In addition, serum levels of UA, leptin and insulin were good predictors (more than 80%) of presence the MS in our study population. Thus our work brings new evidence on the usefulness to assess UA and leptin for evaluation of the risk of MS and to allow an early diagnose of this metabolic disorder in adolescents.
Conclusion
The present study reports a significant increase of the prevalence of MS with the degree of obesity in Algerian adolescents. Moreover, we found that excess weight adolescents exhibited the highest serum concentrations of UA, leptin and insulin in comparison to their NW peers. In addition, UA and leptin were significantly associated with several MS risk factors in excess weight adolescents. Thus, our study demonstrates that serum levels of UA and leptin may be useful biomarkers for the early diagnosis of the risk of MS in adolescents.
Conflict of interest statement: The author(s) declare(s) that there is no conflict of interest regarding the publi-cation of this paper.
References
[1] Pedrosa C, Oliveira BM, Albuquerque I, Simoes-Pereira C, Vaz-de-Almeida MD, Correia F. Obesity and metabolic syndrome in 7–9 years-old Portuguese schoolchildren. Diabetol Metab Syndr. 2010;2:40.
[2] Dietz WH. Critical periods in childhood for the development of obesity. Am J Clin Nutr. 1994;59:955–9.
[3] Kelishadi R. Childhood overweight, obesity, and the metabolic syndrome in developing countries. Epidemiol Rev. 2007;29:62–76. [4] Khader Y, Batieha A, Jaddou H, El-Khateeb M, Ajlouni K. Metabolic syndrome and its individual components among Jordanian children
and adolescents. Int J Pediatr Endocrinol. 2010;2010:316170.
[5] Mehairi AE, Khouri AA, Naqbi MM, Muhairi SJ, Maskari FA, Nagelkerke N, et al. Metabolic syndrome among Emirati adolescents: a school-based study. PLoS One. 2013;8:e56159.
[6] Ford ES, Li C, Zhao G, Pearson WS, Mokdad AH. Prevalence of the metabolic syndrome among U.S. adolescents using the definition from the International Diabetes Federation. Diabetes Care. 2008;31:587–9.
[7] Benmohammed K, Valensi P, Benlatreche M, Nguyen MT, Benmohammed F, Paries J, et al. Anthropometric markers for detection of the metabolic syndrome in adolescents. Diabetes Metab. 2015;41:138–44.
[8] Cook S, Weitzman M, Auinger P, Nguyen M, Dietz WH. Prevalence of a metabolic syndrome phenotype in adolescents: findings from the third National Health and Nutrition Examination Survey, 1988–1994. Arch Pediatr Adolesc Med. 2003;157:821–7.
[9] Weiss R, Dziura J, Burgert TS, Tamborlane WV, Taksali SE, Yeckel CW, et al. Obesity and the metabolic syndrome in children and adoles-cents. N Engl J Med. 2004;350:2362–74.
A ut omatic all y gener at ed rough PDF by Pr oo fCheck fr om Ri ver V alle y Tec hnologies Lt d
[11] Cardoso AS, Gonzaga NC, Medeiros CC, Carvalho DF. Association of uric acid levels with components of metabolic syndrome and non-alcoholic fatty liver disease in overweight or obese children and adolescents. J Pediatr. 2013;89:412–8.
[12] Feig DI, Johnson RJ. Hyperuricemia in childhood primary hypertension. Hypertension. 2003;42:247–52.
[13] Lausten-Thomsen U, Christiansen M, Louise Hedley P, Esmann Fonvig C, Stjernholm T, Pedersen O, et al. Reference values for serum leptin in healthy non-obese children and adolescents. Scand J Clin Lab Invest. 2016;76:561–7.
[14] Ryden M, Hrydziuszko O, Mileti E, Raman A, Bornholdt J, Boyd M, et al. The adipose transcriptional response to insulin is determined by obesity, not insulin sensitivity. Cell Rep. 2016;16:2317–26.
[15] UNICEF. The state of the world’s children 11 – adolescence an age of opportunity. New York, NY: UNICEF, 2011.
[16] UNICEF. How to weigh and measure children: assessing the nutritional status of young children in household surveys. New York, NY: UNICEF, 1986.
[17] McCarthy HD, Jarrett KV, Crawley HF. The development of waist circumference percentiles in British children aged 5.0–16.9 y. Eur J Clin Nutr. 2001;55:902–7.
[18] WHO. Growth reference data for 5–19 years – BMI-for-age (5–19 years). 2007. Available from: http://www.who.int/growthref/who2007_bmi_for_age/en/. Accessed on September 9, 2007.
[19] Zimmet P, Alberti KG, Kaufman F, Tajima N, Silink M, Arslanian S, et al. The metabolic syndrome in children and adolescents – an IDF consensus report. Pediatr Diabetes. 2007;8:299–306.
[20] Knopfholz J, Disserol CC, Pierin AJ, Schirr FL, Streisky L, Takito LL, et al. Validation of the friedewald formula in patients with metabolic syndrome. Cholesterol. 2014;2014:261878.
[21] WHO. Commission on Ending Childhood Obesity (ECHO). 2016. Available from: http://www.who.int/end-childhood-obesity/final-report/en/. Accessed on January 14, 2016.
[22] Figueroa Sobrero A, Evangelista P, Kovalskys I, Digon P, Lopez S, Scaiola E, et al. Cardio-metabolic risk factors in Argentine children. A comparative study. Diabetes Metab Syndr. 2016;10(1 Suppl 1):S103–9.
[23] Yuan H, Yu C, Li X, Sun L, Zhu X, Zhao C, et al. Serum uric acid levels and risk of metabolic syndrome: a dose-response meta-analysis of prospective studies. J Clin Endocrinol Metab. 2015;100:4198–207.
[24] Liang S, Hu Y, Liu C, Qi J, Li G. Low insulin-like growth factor 1 is associated with low high-density lipoprotein cholesterol and metabolic syndrome in Chinese nondiabetic obese children and adolescents: a cross-sectional study. Lipids Health Dis. 2016;15:112.
[25] Johnson RJ, Segal MS, Sautin Y, Nakagawa T, Feig DI, Kang DH, et al. Potential role of sugar (fructose) in the epidemic of hypertension, obesity and the metabolic syndrome, diabetes, kidney disease, and cardiovascular disease. Am J Clin Nutr. 2007;86:899–906. [26] Malik VS, Popkin BM, Bray GA, Despres JP, Hu FB. Sugar-sweetened beverages, obesity, type 2 diabetes mellitus, and cardiovascular
disease risk. Circulation. 2010;121:1356–64.
[27] Pereira MA. Sugar-sweetened and artificially-sweetened beverages in relation to obesity risk. Adv Nutr. 2014;5:797–808.
[28] Obeidat AA, Ahmad MN, Haddad FH, Azzeh FS. Leptin and uric acid as predictors of metabolic syndrome in jordanian adults. Nutr Res Pract. 2016;10:411–7.
[29] Catli G, Kume T, Tuhan HU, Anik A, Calan OG, Bober E, et al. Relation of serum irisin level with metabolic and antropometric parameters in obese children. J Diabetes Complications. 2016;30:1560–5.
[30] Habib SA, Saad EA, Elsharkawy AA, Attia ZR. Pro-inflammatory adipocytokines, oxidative stress, insulin, Zn and Cu: interrelations with obesity in Egyptian non-diabetic obese children and adolescents. Adv Med Sci. 2015;60:179–85.
[31] Nourbakhsh M, Nourbakhsh M, Gholinejad Z, Razzaghy-Azar M. Visfatin in obese children and adolescents and its association with insulin resistance and metabolic syndrome. Scand J Clin Lab Invest. 2015;75:183–8.
[32] Rambhojan C, Bouaziz-Amar E, Larifla L, Deloumeaux J, Clepier J, Plumasseau J, et al. Ghrelin, adipokines, metabolic factors in relation with weight status in school-children and results of a 1-year lifestyle intervention program. Nutr Metab. 2015;12:43.
[33] Matsubara M, Chiba H, Maruoka S, Katayose S. Elevated serum leptin concentrations in women with hyperuricemia. J Atheroscler Thromb. 2002;9:28–34.
[34] Abdullah AR, Hasan HA, Raigangar VL. Analysis of the relationship of leptin, high-sensitivity C-reactive protein, adiponectin, insulin, and uric acid to metabolic syndrome in lean, overweight, and obese young females. Metab Syndr Relat Disord. 2009;7:17–22. [35] Liu M, He Y, Jiang B, Wu L, Yang S, Wang Y, et al. Association between serum uric acid level and metabolic syndrome and its sex
differ-ence in a Chinese community elderly population. Int J Endocrinol. 2014;2014:754678.
[36] Nakagawa T, Hu H, Zharikov S, Tuttle KR, Short RA, Glushakova O, et al. A causal role for uric acid in fructose-induced metabolic syn-drome. Am J Physiol Renal Physiol. 2006;290:625–31.