by
Dean Robert Johnson
A.B., Harvard University
(1967)
Submitted in partial fulfillment
of the requirements for thedegree of
Master of City Planning at the
Massachusetts
Institute of TechnologyMay 1978
Dean Robert Johnson
1978
Signature of Author Department
Certified by
...
V..a...of Urban St4igs and Planning, May 26, 1978
... . T.u...
Thesis Supervisor
Accepted by ....
\ M SACHUjETS INSTITUTE OF TECwNOniOMy
Chairman, Department Committee
JUL 2
0 1978
MITLibraries
Document Services
Room 14-0551 77 Massachusetts Avenue Cambridge, MA 02139 Ph: 617.253.2800 Email: docs@mit.edu http:/libraries.mit.eduldocsDISCLAIMER OF QUALITY
Due to the condition of the original material, there are unavoidable
flaws in this reproduction. We have made every effort possible to
provide you with the best copy available. If you are dissatisfied with
this product and find it unusable, please contact Document Services as
soon as possible.
Thank you.
The images contained in this document are of
the best quality available.
ACOUSTICAL SCALE MODELING:
A PLANNING AND DESIGN TECHNIQUE FOR MEETING ENVIRONMENTAL NOISE STANDARDS
by Dean Robert Johnson
Submitted in partial fulfillment of the requirements for the degree of
Master of City Planning at the
Massachusetts Institute of Technology May 1978
The thesis describes a research project undertaken to evaluate the application of acoustical scale modeling as a planning and design technique for noise abatement projects. An instrumenta-tion package developed under the RANN acoustical modeling
pro-ject at the MIT Acoustics and Vibration Laboratory was used to predict the excess attenuation which would be achieved by various noise abatement design alternatives proposed by the Commonwealth of Massachusetts for Interstate 93 in Somerville, MA.
Measurements of an impulsive noise source on two 1:50 scale models of neighborhood areas adjacent to the highway were taken
to assist community residents in choosing the most appropriate
abatement alternative. The paper describes the various issues
investigated and the results, and it evaluates the usefulness of the technique. It also explores various aspects of community interaction in the process and evaluates this technique as an educational and participatory device.
Professor Aaron Fleisher Thesis advisor:
ACKNOWLEDGMENTS
My thanks to Professor Aaron Fleisher for his advice,
patience and time; to Mr. Daniel Brand and Mr. John Culp for their interest-and constructive criticism; and to Professor Richard Lyon of the Acoustics and Vibration Laboratory, who made this project possible.
1.
Introduction
2. Approach 3. The 3.1 3.2 3.3 3.4 3.5 Modeling System Overview Acoustical Considerations Modeling Issues Instrumentation Using the System4.
Issues Investigated
5.
Study Results
5.1
Ground Versus Second-Story Levels
5.2 Comparison of Levels With and Without
Structures
5.3
Effect of Roadside Barriers
5.4
Effect of a Comprehensive Shielding System
on Viaduct Noise Levels
5.5
Effect of the Viaduct Structure on Overall
Community Noise Levels
6.
Community Interaction in the Modeling Process
6.1 Methodological Approach
6.2
Impact of the Modeling Process
7.
Conclusions on the Application of Acoustical
Scale Modeling and Suggested Further Research
Footnotes 00 1 ...
13
...
13
... 15. 00
31
*..
37
... 42 ... 48 ... 56 ... 56 ... 59 ... 59 ... 63 ... 66 ... 69 ... 69 ... 72 ... 77. 0
87
ii
LIST OF FIGURES
1.
Somervilleand Boston 0. 0. 52. Interstate 93 in Somerville *.
..
63.
1-93
Community Model - AreaI
0.0.84.
1-93
Community Model - AreaII
.. 095. Truck Noise Components ...20
6. Spherical Spreading of Sound .. 27
7. Ground Interference Effects ... 27
8. Reflection of Sound from a Barrier ... 28 9. Refraction and Transmission of Sound ... 28
10. Effective Height of Barriers ... 29
11. Reflections in a Sound Field ... 29
12. View of Model I from
1-93
.0.3513. View of Model II from Bailey Road ... 36 14. View of Model II from Fellsway ... 36
15. Spark Source ... 39
16. Signal Reception ... 39
17. Signal Processor 0 0 .40
18. .Spark Source (second generation) on Model I (1/10" BBN microphone is located on Bailey
Road in lower left corner of picture) ... 41
19. View on Model of Bailey Road from I-93
without Noise Shield ... 46
20. View on Model of Bailey Road from Ground
with Noise Shield ..
.46
21. Location of Model I ,..49
23. View of Viaduct Area with Under-Viaduct Shield ... 52 24. View of Viaduct Area with Roadside Shield ... 52
25. View of Ten Hills Road with Fellsway Shielding ... 53 26. View of Under-Viaduct Shield 0..53
27. Typical Cross Section Showing 1-93
Noise Shield in Model I ... 54
28. Typical Cross Sections Showing Berm and
Noise Shield, 1-93 Noise Shield,and Recessed
Viaduct Shield in Model II ... 54
29. Model I Measurement Plan . .57
30. Model II Measurement Plan -.. 60
31. View of Viaduct Area without Noise Control ... 64
32. View of Viaduct Area with Berm and Walls ... 64 33. Excess Attenuation Achieved by Various
iv
LIST OF TABLES
1. A-Weighting Network for Sound Level Meters ... 22
2. Sound Levels and Relative Loudness
of Typical Activities ..- 25
3. Excess Attenuation of Barriers at 21'
Receptor Height, Model
I
... 624. Excess Attenuation with Various Barriers
-Model II -. 65
5. Effect of Viaduct Structure on Spherical
APPENDICES
A. Technical Specifications for Acoustic Modeling System
B. Ten Hills Area Community Questionaire and Results
C. Sleep Interference
D. Technical Data on 1-93 Corridor Noise Levels
Noise Contours for 1-93 Corridor
Noise Reduction - Outside to Inside
E. Federal Highway Administration Noise Guidelines -Policy and Procedure Memorandum 90-2
F. Selected Bibliography
G. Plans and Sections of Noise Shielding Proposed for 1-93 in Somerville
1. INTRODUCTION
During the past decade the abatement and control of environ-mental noise has become a major goal of the federal government. The Noise Control Act of 1972 signified the first major insti-tutional response to the problem of broadly-based environmental noise pollution and called for national noise standards which would promote "...an environment for all Americans, free from noise that jepordizes their health or welfare."1
In response to the impetus of the Noise Control Act,
federal agencies began promulgating noise standards applicable to the design of new projects. Among the first to do so was the Federal Highway Administration, which had been the focus of
increasing criticism from environmental and citizen groups since the mid-sixties as the final urban links in the Interstate High-way System were increasingly attacked for their negative impacts on the urban communities they traversed. In 1972, FHWA published Policy and Procedure Memorandum (PPM) 90-2, which set design
noise standards for all new highway projects (see Appendix E.)
The newly-adopted noise standards applied only to projects still under design, however. Projects approved prior to the adoption of the standards were exempted, and existing highway noise problems were not addressed, except on a special case basis. Even in cases when federal or state highway agencies recognized the need for noise abatement devices on existing
pressure, the problem of how to add noise control to a facility not designed for it was often extremely complex. Inadequate solutions or approaches rejected by the affected communities frequently resulted in continuing controversy.
The purpose of this research project was to evaluate the application of a new planning and design technique developed by the Acoustics and Vibration Laboratory at the Massachusetts
Institute of Technology under the RANN Program of the National Science Foundation.2 The technique involves acoustical simula-tion studies using physical scale models to determine the effec-tiveness of proposed noise abatement design solutions. The
analytical prediction of noise levels achieved through the use of noise barriers or shields in dense urban areas is subject to great error because of irregularities in terrain in some cases and because of the complexity of reflecting surfaces encountered
in neighborhoods which are to be protected in most cases. In the case of an urban freeway which is elevated, the issues become even more complex as trade-offs must be made between
acoustical effectiveness of shields and the visual and aesthetic impacts of such structures on top of the elevated roadway.
The purpose of the modeling system developed under the RANN Program is to provide a simplified instrumentation package and technique which can be utilized by planners and designers who have a general technical background but who are not acoustical
3
acoustical model studies which previously have been limited to
the highly trained specialist to a much wider range of users at
a much lower cost.
This paper describes a case study application of the system,
evaluates the technical results of the modeling and analyzes
the usefullness of the technique from the standpoint of citizen
involvement and agency decision-making.
2. APPROACH
The RANN acoustical modeling system (described in Section
3) was applied to an actual case involving a proposed noise
abatement project undertaken by the Massachusetts Department of Public Works (MDPW) for a section of Interstate 93 in Somerville, Massachusetts. Interstate 93 is the only completed
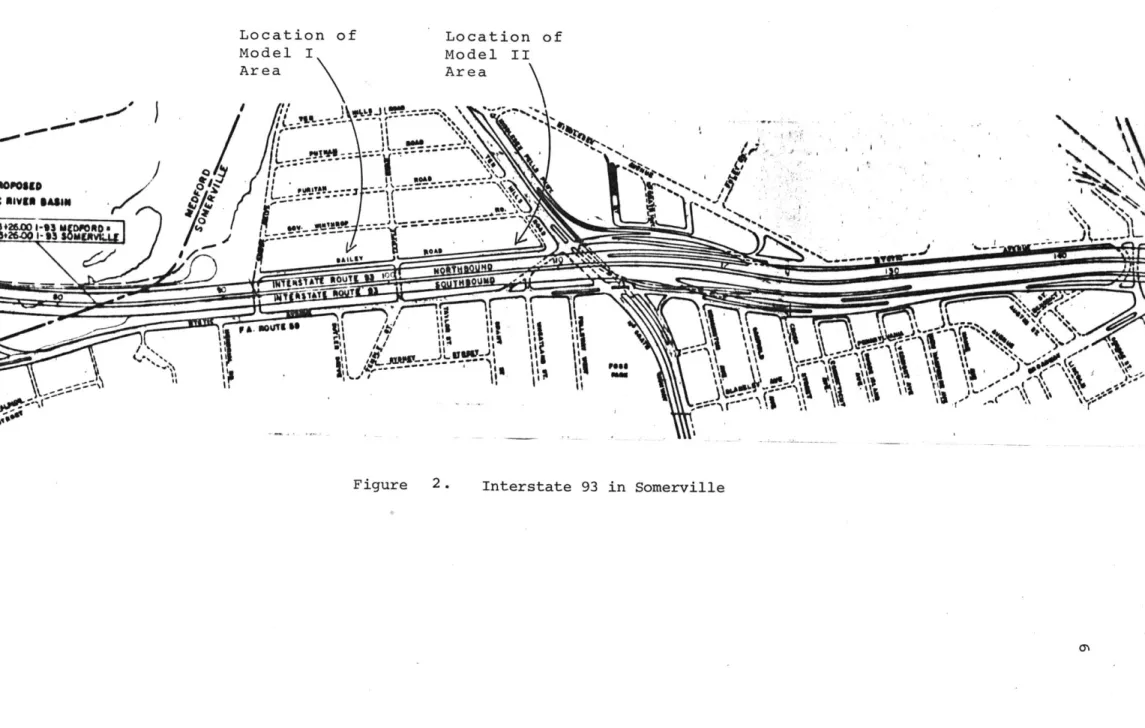
limited-access highway connecting downtown Boston to the north (see Figure 1.) It carries automobile and truck traffic to the cir-cumferential highways of Routes 128 and 495 and to New Hampshire
and Maine.
Construction of the last link connecting the cities of Medford and Boston through Somerville was completed in 1972.
Because of capacity constraints at its connection to the Central Artery in Boston, however, it was not fully opened to all traffic until late in 1973. Prior to its full utilization, however,
adverse environmental impacts from the project had become apparent.
Dissecting the northeastern corner of Somerville, the ele-vated roadway of 1-93 is a physical barrier which divides and
isolates the "Ten Hills" area west of the Middlesex Fellsway (see Figure 2.) The seventy families living in two-family homes along Bailey Road are less than 70 feet from the road, which is at the level of their second-story living rooms. Truck routes within the corridor have been relocated and have resulted in
new primary and secondary noise impacts. FHWA design noise level standards (PPM 90-2 and subsequent regulations) which were not
5
Figure 2. Interstate 93 in Somerville 0
7
applicable when 1-93 was designed in the nineteen-sixties now recommend maximum noise levels 10 to 20 decibels below those
experienced by the residential abutting properties in the corridor.
By early 1972, concerned citizen groups working with the
City administration generated sufficient attention of the respon-sible agencies (the state Department of Public Works as the
construction agency and the Executive Office of Transportation and Construction as the policy maker) to obtain a commitment
from the Commonwealth to fund a study which would propose, with the participation of the affected citizens, specific actions
that might be taken to reduce the adverse impacts of the highway. The initial study funded by the state recommended, among other actions, that a proj.ect be funded to develop noise abatement solutions for the Ten Hills area as part of the beautification
3
design already scheduled for the corridor. This project was
4
finally undertaken in 1974 and completed in 1976.
As part of the design contract for the noise abatement,
the MDPW agreed to have two 1:50 scale models constructed, repre-senting a typical section of each of the two residential blocks affected. Although justified by the project as visual design tools, the models were constructed to the acoustical specifica-tions of the RANN Project consultants by a professional model builder so that they could be utilized for acoustical simulation studies. Figures 3 and 4 are photographs of the two models, each of which was 8 feet by 8 feet in size. The RANN Project
00
E'VI T'~
mi.L.1±II.eI>
I
I
\ .Wt
I
1-93 Community Model - Area II (Corner of Bailey & Ten Hills at Fellsway)
in Section 3.4 below and in Appendix A. Research support was
provided the author under a Special Fel.lowship from the
Environ-mental Protection Agency.
The project involved the actual application of the. system
by the author working with the affected neighborhood residents to evaluate the preliminary design solutions proposed by the
MDPW for noise shielding. Initially, interviews and a
neighbor-hood questionaire were used to acquaint residents with the
tech-nical requirements for effective noise shielding and to establish, at least generally, the preferences of the neighborhood and the limits within which shielding could be designed. Technically,
the key issue was the height of the proposed barriers, balancing
noise reduction effectiveness against the visual and aesthetic impact of the shields on top of the elevated roadway. A second
major issue developed around the need for acoustical shielding beneath the viaduct portion of the highway and along an adjacent
arterial road. Aesthetically, a wide range of issues were
addressed, ranging from the type of materials to be used to the final color and finish desired.
An important aspect of the modeling was the interaction it generated with the community and the educational process it fostered. After many meetings with local residents, a level of trust was established and the technical results of the simulation
11
studies (which many residents observed) were accepted. A major problem remained, however, in translation of those results into terms which were comprehensible to the lay person. Acoustical
demonstrations were finally arranged which conveyed aurally the
impact of various amounts of noise reduction, including the design goal of 10 dBA, and the importance of total acoustic shielding for the area. Section 6 evaluates this community interaction and learning process.
The use of the simulation studies assisted the affected
community in reaching a decision regarding the height of the pro-posed roadside shields. Although lower shields were preferred
for aesthetic reasons, the residents decided on the maximum
height proposed (12 feet) because of the increased abatement benefits it achieved over the lower height alternatives. In
addition, the community became convinced that in the block
adja-cent to the viaduct section, it would be necessary to construct a full barrier from the underside of the viaduct to the ground which would be extended along the arterial road perpendicular to the interstate. Sections 4 and 5, below, describe in detail the specific issues investigated and the results.
Finally, the results of the acoustical modeling studies were utilized to help convince the state and federal decision-makers of the necessity for the full shielding treatment of the area. Even after the completion of the preliminary design study, officials from the Department of Public Works and the Federal
Highway Administration District Office resisted accepting the comprehensive solution. They proposed to construct only the roadside shields, leaving the underside of the viaduct section open. At this point, the model studies of the impact of the viaduct on noise levels (reported in Section 5.5) were used to argue successfully for the preferred solution. The state and federal agencies agreed to fund the entire proposed design because they were convinced that a partial treatment would be almost totally ineffective and that the construction of the elevated highway structure itself was responsible for increased noise impacts.
Final engineering and production of construction documents for the 1-93 noise abatement shields received funding approval from FHWA in 1977, but as of this date the final stage of work has not begun. Current projections for completion of the project are for 1979.
13
3. THE MODELING SYSTEM
3.1 Overview
The simulation of acoustic phenome.na using scale models requires that all dimensions be scaled down in length. This is readily done for physical structures, such as buildings and roads, as in architectural modeling. Since the air surrounding the model cannot be scaled down, the wavelengths of the sound-waves must be scaled down by increasing the frequency of the
source. Thus, in a project using a 1:50 scale model, a 1000 Hz tone would increase by a factor of 50, to 50,000 Hz, to
main-tain proportionality.
The physical model is constructed of materials which have reflection characteristics at the scaled frequencies similar to the actual materials at full-scale frequencies. This can be as important for ground cover and road surfaces as it is for the reflecting surfaces of structures. In addition, topographic characteristics and elevations are extremely critical in the simulation of an acoustic environment.
To simulate a real-life noise environment, a noise source and measuring system is employed. The noise source used in the
RANN system is an electric spark discharge in air which produces
a broad band impulse of noise from 6 to 125 KHz. This impul-sive noise source is used to investigate different noise paths from the source to a receiver so that acoustical shielding or
other treatments can be-
tested.
In addition, it can be used
to obtain a steady state noise level by adding up all the
impulses arriving at a receiver over a given time period.
The noise impulse is detected at the receiver by a
minia-ture microphone which has sufficient frequency response to cover
the modeled frequencies. This signal is then processed in a
"black box" and displayed on a storage oscilloscope screen.
The signal is first filtered to shape the frequency spectrum of
the spark into the scaled A-weighted spectrum of the noise
source being modeled, in this case for urban traffic. Either
short-term averaged or integrated signals can be displayed.
The short-term averaged signal indicates the various impulses
reaching the receiver and their amplitude over time. Reflected
signals arrive at a later time and can be thus identified.
The integrated signal represents the sum of all the energy
ar-riving at the microphone over a given time period and is
com-parable
to
the intensity of a steady state source of the same
sound pressure level as received by the microphone.
Both of
these signals are passed through a logarithmic amplifier which
gives the output in dedibels for display.
Noise levels measured on the model do not represent the
actual noise levels experienced in the community since it is
not practical to model the range of different noise sources
present in real life.
The
differences in noise levels
meas-ured before and after barriers are erected, however, can be
15
determined with model simulation.
5In addition, modeling is
very useful in assessing the varying amounts of noise
reduc-tion achieved by barriers of different heights or configurareduc-tions.
The following sections discuss in greater detail the
relevant acoustical phenomena involved, issues faced in the
construction of the models, the instrumentation employed, and
the application of the system.
3.2
Acoustical Considerations
In the modeling of a noise problem, three acoustical issues
are of concern: the character of the sound, how it travels and
who hears it.
These are referred to as source--path--receiver.
The characteristics of most sound sources can be readily
measured and anlyzed'using octave band analysis to determine
spectral content (eg., the presence of various frequencies and
amplitudes, pure tones and the like.) .Similarly, the
character-istics of human hearing have been 'studied extensively and are
reasonably well understood. The propagation of sound--the path
it takes--is extremely complex, however, and can be described
in only simplified terms.
It is for this reason that acoustical
scale modeling proves useful. This section will address each
of these concerns as they affect the modeling process after
explaining the acoustical notation used in noise measurement.
Noise Measurement and Notation
explanation of the relationship between sound intensity and 6
what we hear. Sound propagated from a point source radiates in all directions forming a sphere of acoustic power. Since the power sphere increases proportionately with the increase in distance from the source, the power per unit of area (its intensity) decreases because the constant power quantity is being distributed over an expanding area.
The acoustic power of a loud noise, as from a train, may be as much as one billion times greater than that of a soft whisper. In fact, the range of acoustic powers that are of
interest in noise meansurements is on the order of
one-billion-18
billion to one (10 :1). For convenience of expression and calculation, these powers are expressed on a logarithmic scale. A "bel" is the measure used to represent the logarithm of a ratio of two values of power. For convenience of use, this measure is converted to "decibels" by multiplying by ten. The expression 10 log (I/I2) represents the ratio of two power
(intensity) levels in decibels, abbreviated "dB." Thus, if one
4
power is 10,000 times another (10 ), the log of this ratio (4) times 10 is 40 decibels (dB). When the term "level" is used, a reference quantity is implied since logarithms are dimension-less. Accordingly, a particular sound power level in dB refers to the log of the ratic- of that power to some specified refer-ence power.
In dealing with noise, sound power levels are not measured directly. Instead, the related sound pressure level--the
17
fluctuation in atmospheric pressure caused by a sound wave at a given point which is detected by the ear, is measured. The sound pressure at a point can be likened to a disturbance in the surface of the sphere of power. Leo Beranek, editor of
the classic Noise and Vibration Control, illustrates the rela-tionship between power and pressure. by relating sound power
level to the total rate of heat production of a furnace and sound pressure level to the temperature produced at a given
7
point in the house.
Since mathematically sound power varies proportionally to the square of the sound pressure, the sound pressure ratio for a given number of decibels is the square root of the cor-responding power ratio. Thus 40 dB indicates a sound pressure ratio of 100:1 and a-sound power.ratio of 10,000:1. When sound
pressure level measurements are made, the reference quantity signified by 0 dB is equal to the pressure level of a 1,000 Hz tone just detectible by a yound person (20 micronewtons per
2 square meter or micropascals). -The expression 10 log (p1/p0 ) dB
represents a sound pressure level in dB where p1 is the source
pressure and p0 is the reference pressure of 20 micropascals. When used in noise reastrements, decibels always refer to sound pressure levels, with the reference quantity understood.
One last complication in noise measurement should be noted. Because sound pressure levels are logarithmic they cannot be added directly. Rather, for two sound pressures of identical
level, the logs of their pressure ratio must be added, or
2
10 log 2(Pl/P2) - Since the log of 2 is 0.301, 10 times
the log of 2 is 3.01, or 3 dB. Accordingly, two 90 dB trucks heard by a listener at a given distance would produce a sound level of 93 dB (not 180 dB). With sound of different levels, therefore, the louder will dominate the combined level. The combined level of a 90 dB truck and an 81 dB truck would be
90.5 dB. Thus, in highway barrier design the source of primary interest is the noise of diesel trucks, since it dominates that produced by other vehicles.
The Source
Although a major urban freeway acts as a continuous source of noise (a line source) during much of the day, the noise of all traffic is dominated by the intermittent peaks of the loudest vehicles--trucks. When cars and trucks are present, the noise of the trucks is sufficiently greater to mask the
auto-generated noise because of the logarithmic character of sound, described above.
Because loud, intermittent noises are much more disruptive to human activity than steady state sources, it is most useful to model the single pass by event of a truck on the roadway.
Such a single event, if it occurs at 4 in the morning, may be sufficient to disrupt sleep, so any protective acoustical bar-riers must be designed to abate this noise source. In addition, a barrier high enough to block out automobile noise but not
19
truek noise will reduce the ambient or general noise level but not affect the truck peaks, thereby making the difference greater
than if no barrier were in place and the truck peak more
annoy-ing.
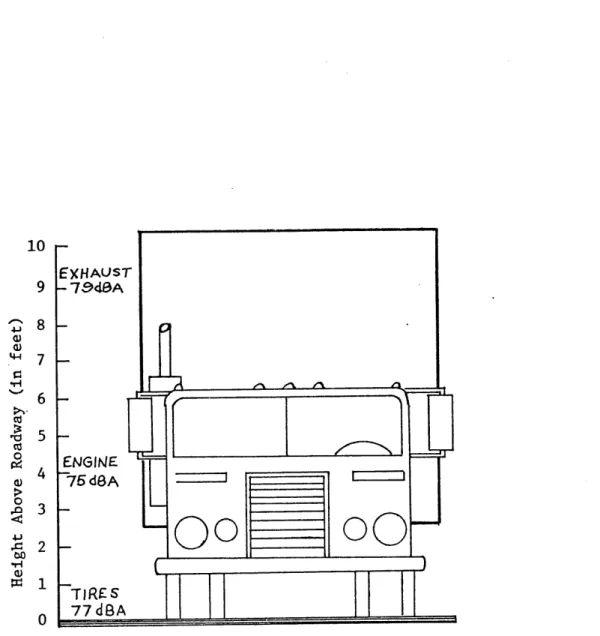
Figure 5 shows a typical truck and the several noise components it contains. Of greatest interest in the design of
noise barriers is the exhaust stack, for it is the highest noise
source element and therefore the most difficult to shield. As part of the modeling instrumentation, described below, filters
are used which shape the character of the model noise source to
that
of actual truck noise.
The Receiver
The human ear is a remarkable receiver, with sensitivity
to
sound
wave pressure levels having tremendous variation in
intensity. Unlike measuring instruments, however, the ear is
non-linear in its response, The apparent loudness that we
attribute to a sound varies with the frequency or pitch of the
sound, and the way it varies depends on the pressure level. In
general, the ear is able to detect middle and upper middle range
frequencies (from 1000 Hz to 5000 Hz) at extremely low levels (approximately 0 dB.) As frequencies increase to 10,000 Hz, the minimum threshold of perceptibility increases to around 20 dB.
Below 1000 Hz the sensitivity loss is even greater. At 100 Hz, a "typical" minimum threshold of a yound person is around 25 dB,
and
at
40
Hz the threshold is nearly 50 dB. At high sound
pres-10 EXHAUST 9 7948A 8
-7~N1
75d8Aj
O0 ---
i O
77dBATotal Truck Noise Measured Horizontally at 50 Feet = 82 dBA
FIGURE 5. Typical Truck Noise Components Relative to
Height Above Roadway
(from Fundamentals and Abatement of Highway Traffic Noise, Federal Highway Administration, June 1973;
p. -13) ENGINE 44 6 5 a4 0 3 2 0
21
sure levels, however, the ear's sensitivity is more linear than at low pressure levels. This is the reason for the "loudness" control on a typical hifi amplifier, which boosts the level of the high and low frequency content when the volume is low. As a person ages the minimum threshold levels of hearing increase, with the higher frequency sensitivity falling off most rapidly. This decline in hearing acuity that occurs with age is called presbycusis.
To calculate the loudness perceived by an "average" listener, it is possible to adjust the sound pressure levels measured by a microphone (the response of which is accurate or "flat") according to empirically-derived "equal-loudness contours."8 In the case of environmental noise measurements, however, a further complication arises. Subjective judgments of annoyance are dependent more on mid and high frequency than
low frequency content of the noise. Various weighting.-scales have been produced by acousticians, which attempt to approximate this relative reaction. The scale almost universally adopted for use in urban noise measurements is the "A" scale, with its weighted units abbreviated dBA. Table 1 shows the adjustments made for A-weighting according to the American National Standards Institute (ANSI) Standard S1.4-1971 for A-scale filters used in sound pressure level meters.
The A-weighted scale does not represent an equal-loudness contour but rather approximates subjective human reactions to
TABLE 1. A Weighting Network for Soundlevel Meters
(ANSI-Sl.4-1971)
Frequency A-Weighting relative
Hz response, dB 10 -70.4 12.5 -63.4 16 -56.7 20 -50.5 25 -44.7 31.5 -39.4 40 -34.6 50 -30.2 63 -26.2 80 -22.5 100 -19.1 125 -16.1 160 -13.4 200 -10.9 250 -8.6 315 -6.6 400 -4.8 500 -3.2 630 -1.9 800 -0.8 1,000 0 1,250 +0.6 1,600 +1.0 2,000 +1.2 2,500 +1.3 3,150 +1.2 4,000 +1.0 5,000 +0.5 6,300 -0.1 8,000 -1.1 10,000 -2.5 12,500 -4.3 16,000 -6.6 20,000 -9.3
(Source: Noise and Vibration Control, Leo L. Beranek, ed.
23
perceived annoyance of noise. The scale has been shown to correlate very highly with indicators of community annoyance in hundreds of studies over the past 30 years.9 As a result, A-weighted measures have been adopted in all local, state and
federal codes which deal with highway noise. All of the measurements conducted in this project are, accordingly, A-weighted.
In describing the human response to noise, other attrib-utes may determine whether it is annoying. Besides the frequency
spectrum, the intensity level, the time and place of the noise, the duration of the noise,and the individual background, all
affect one's perception of annoyance. In the case of highway noise which exceeds the standards set by FHWA, most of.these complications can be ignored, since the characteristics of traffic noise and community reaction to it are well known and the only real issue involves the amound of reduction which can be practically achieved.
The response of the ear to sound pressure is not logarithmic. That is, a doubling of sound pressure level does not produce a
sound which is perceived as being twice as loud by the average person. Extensive empirical research on the subjective judg-ment of listeners to relative loudness has shown that loudness
is approximately proportional to the sound pressure raised to the 0.6 power.10 Thus, a change of 10 dB represents a doubling or halving of perceived noise level. This means that for a
highway noise barrier to achieve a perceived reduction of half the existing noise, 90 percent of the acoustic power must be removed. To reduce the noise by half again (a 20 dB reduction),
99 percent of the acoustic power would have to be removed.
In practical terms, reductions of much more than 10 dBA from roadside barriers are very difficult to achieve. Table 2 provides the sound levels in dBA and the perceived relative loudness of typical noise generating activities.
The Path - Sound Propagation
Sound is propagated when air (the medium) is disturbed in much the same way that ripples spread out in water from a
stone tossed into a pond. In air, however, the effect is three-dimensional, so one refers tothe "spherical spreading" of sound. Figure 6 shows the spreading of sound from a truck stack towards
a house.
As the sound spreads its intensity is diminished as it
excites air molecules. Some of the energy is transferred in this
way and some is scattered randomly. In a free field situation (an open space with no obstacles), the level of the sound de-creases an average of 6 dB for each doubling of distance. Thus
a truck noise level which measures 90 dBA at a distance of 50 feet would be 84 dBA at 100 feet, 78 dBA at 200 feet, and so on if nothing else affected the sound being propagated.
Sound propagation in urban areas, however, is affected by a number of considerations which complicate the prediction of
25
TABLE 2. Sound Levels and Relative Loudness of Typical Activities
Subjective Activity Relative loudness
Impression (human judgment of
different sound levels)
130 --- 32 times as loud
(dBA) military jet takeoff
at 50' (130 dBA) uncomfortably
120 --- 16 times as loud (dBA) loud turbofan jet at takeoff
200' under flight path (118 dBA)
110---8 times as loud
jet flyover at 1000'
(103 dBA)
very helicopter at 100'(100 dBA)
100---4 times as loud
loud newspaper press (97 dBA)
DC-9 @ 6000' (97 dBA)
motorcycle at 25' (90 dBA)
90---2 times as loud
diesel truck, 40 mph at
50' (84 dBA)
moderately power mower- at 25' (84 dBA)
80---Reference loudness
loud auto, 65 mph at 25' (77 dBA) high urban ambient sound
(80 dBA) 70---1/2 as loud electric typewriter at 10' (64 dBA) conversation (60 dBA) 60---1/4 as loud
air conditioning condensing unit at 15' (55 dBA)
50---1/8 as loud
quiet bird calls (44 dBA)
lower limit urban daytime ambient noise (40 dBA)
40---1/16 as loud
rustling leaves (20 dBA) just audible
10---threshold of hearing
0---(adapted from Noise and Vibration Control, Leo Beranek, ed. McGraw Hill, 1971; p. 576)
noise impacts at a given point. Sound can be absorbed, re-flected, refracted, and transmitted through objects. In the shielding of highway noise, each of these phenomena is impor-tant.
Figure 7 depicts the direct path of truck noise to a
receiver location. This is the same as the direct line of sight. If a receiver is located on the ground, reflections from the ground can affect what is heard. If the ground surface is hard
(like pavement), the reflected sound may be nearly as strong as the directly received sound. If this reflected sound wave
is in phase with the direct wave, it will reinforce the sound level. If, on the other hand, the reflected wave is out of phase with the directly received wave, it will interfere and
reduce the perceived sound level. This effect is called "ground interference."
When a shield or other barrier is placed between the receiver and the noise source, the reflection and diffraction of sound affect its effectiveness. As with light waves, sound refracts over the edge of a barrier though the effect is greater
for sound since the wavelengths are much longer. Sound can also be bent by pressure and temperature gradients in the air.
Figure 8 shows the path of sound reflected from a barrier. Figure 9 shows sound refracted over a barrier. Finally, sound can be transmitted through a barrier, which is also shown in
27
7);
Figure 6. SPHERICAL SPREADING OF SOUND
GROUND INTERFERENCE EFFECTS
Figure 8. REFLECTION OF SOUND FROM A BARRIER
tansm teod
REFRACTION AND TRANSMISSION OF SOUND
29
Figure 10. EFFECTIVE HEIGHT OF BARRIERS
fb'uck
REFLECTIONS IN A SOUND FIELD
~~17
Of all these effects, diffraction is of most immediate
interest when considering the design of a barrier. The
"effective height" of a barrier is the difference between the direct, line-of-sight path of the sound and the top of the barrier, as shown in Figure 10. The greater the effective height of a barrier, the greater the amount of sound reduction
it provides, since more of.the directly-radiated sound is intercepted by the barrier and less of the diffracted sound reaches the receiver. Because so many variables enter into real-life sound propagation, however, it is impossible to accu-rately predict barrier effectiveness using analytical methods.
Among the most complex of the variables affecting sound
propagation are the. reflected paths sound can take. In an urban residential neighborhood, for example, the surfaces of the
buildings reflect sound waves along a great number of paths. Spaces between buildings can act to channel noise to the rear of a structure where it can be reflected off other structures. Figure 11 depicts diagramtically the behaviour of sound from a point source alongside a residential neighborhood and the cre-ation of "hot" spots. If one considers that a sound field
striking the side of a building produces reflections at each point on the surface, each with a different angle dependent on the angle of incidence, and that with a moving noise source
(like a truck) the angle of incidence is constantly changing, it becomes apparent that the mathematical modeling of such reflected sound is extremely difficult. It is in such complex
31
situations that acoustical simulation on a scale model becomes
particularly useful.
3.3
Modeling Issues
Acoustical Versus Architectural Criteria
Since the frequency range of most audible sounds is from
approximately 50 to 10,000 Hz, one is dealing with wavelengths
ranging from 20 feet to one inch.
(Wavelength is obtained by
dividing wave speed by frequency; the speed of sound is
approx-imately 1100 feet per second at
700F.)
It is desirable,
there-fore, that any scale model be accurate to one inch at the scale
used.
This means that dimensions should be laid out to
bet-ween 1/32 and 1/64 of an inch when using a 1:50 scale, as was
done in this project.
Sound propagation around an object becomes very complex
when the wavelength is the same as the size of the object.
Dimensional errors, then, will affect primarily higher
frequen-cies (which have short wavelengths) as they strike object of
similar dimensions. An error of 1/16 inch in horizontal
dimension, for example, represents a full scale error of
approx-imately 3 inches. Such an error would affect the propagation
of sound above 4000 Hz as it strikes very small objects. Since
traffic noise is broad band, and since the frequencies of
pri-mary annoyance lie between 200 and 2,000 Hz, errors of this
magnitude in horizontal dimension are not consequential.
Vertical dimensions, however, are more sensitive since the goal of noise barriers is to intercept (by absorbing or reflecting away) intrusive sounds. The height of the noise source relative to the receiver (which determines the effective height of a barrier) must be modeled very accurately. These dimensions are critical because the effect of an error is proportional to the effective height of the barrier modeled.
A 1/16 inch error at a 1:50 scale produces a 6 percent error
for a barrier with an effective height of 4 feet (3"/48".)
That same error in vertical dimension would produce a 12.5 per-cent error if the effective barrier height was 2 feet (3"/24".) Similarly, hills or berms or other topographical features which might affect the sound path must be portrayed accurately. In
the case of a highway project, one can normally obtain detailed, ac.curate survey data and profiles for this purpose.
Ground interference effects.in congested urban areas are not critical since scattering and reflecting will have a greater effect on levels. Also, the noise source of interest (a truck stack) is fairly high above the ground (typically 8 feet.) If one were dealing with a source low to the ground, like a snow-mobile, ground effects would be more critical. Similarly,
the transmission of sound through materials (such as a barrier) is of little practical concern in an exterior situation since the amount of sound energy transmitted is far less than that reaching the receiver via other paths and will not affect the measured levels.
33
in
general reflectivity is far more important for interior
than exterior models, since the sound is reflected many times from interior surfaces. It does become an important consider-ation in congested urban'areas,however, where adjacent surfaces can reflect the sound waves back and forth. Therefore, the planesof reflecting surfaces must be accurately modeled.
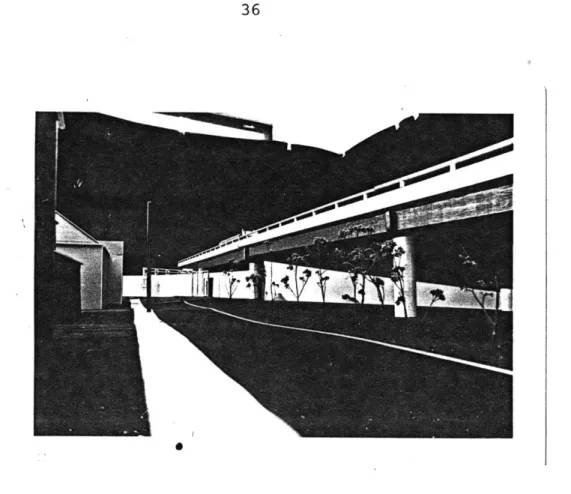
Architectural detailing is not very important. Although articulated details, such as windows and doors, will affect the sound reflections, the effects are minor as compared to the broad surfaces of a structure. Dormers and all changes in the place of a surface must be accurately represented, however. Figures 12-14 illustrate the degree of detail modeled in this project.
Choice of Materials
Materials which accurately represent the absorptive and reflective characteristics of the full scale material are chosen
by testing. Fortunately for the non-specialist, absorption coefficients have been calculated from tests on most materials
in the range of 200 to 2,000 Hz, which is the range of greatest
11
annoyance, by acoustical specialists concerned with modeling. The effect of errors in such "surface impedance" of materials is less important in exterior than interior models, especially when broad band noise (such as from traffic) is used. A 20%error is acceptable since it will produce an error in noise level measurement of less than 1 dB.12
Testing of materials involves use of the spark source and
measurement system for the scaled material and a starter pistol or similar impulsive noise for measuring the full-scale material. It has been found by the RANN Project at MIT that Deciban (a
commercial brand of composition board) covered with flocked paper accurately represents grass-covered ground. Similarly, streets and other hard, paved surfaces which are excellent reflec-tors are well represented by heavy glossy paper on top of
lacquered plywood. Heavy "tag board" with a painted finish was found to represent the characteristics of the shingle and
clapboard houses typical in this project. (See figures 12-14.)
Thus, for the type of exterior situation modeled here, the materials were quite simple and readily available. Most of the surfaces in the environment were hard, good reflectors, except for the grass-covered lawns and the landscaped areas next to
the highway. Trees and other vegetation were not important,
since they have very little effect on sound propagation, far less in fact than one might expect from the degree of visual privacy they can provide. (Studies on the effect of vegetation have not provided consistent results; however, a reduction of 3 dB per
100 feet of dense deciduous forest is probably a good average
value for what might be expected for attenuation greater than
normal absorption in air.) Thus trees were not necessary on
~
4Af
IN
View of Model I From 1-93
Pr
,~. I'at
U.4*4
ftft ftoft.-Figure 12.0
Figure 13. View of Model II from Bailey Road
0
View of Model II from Fellsway
r
37
Other Uses of the Model
In this project the models were used as design tools to assist the impacted community in visualizing what the barriers would look like, and to weigh the aesthetic trade-offs of var-ious design configurations. Therefore, great attention was paid to the accurate depiction of the area, with houses painted accurately, existing trees shown and so forth ( See figures 12
-14.) This attention to "architectural" criteria was extremely useful for the community participants and is described in Sec-tion 6. It did not enhance the accuracy of the acoustical sim-ulation studies, of course, but did add to the time and cost of constructing the models.
3.4 Instrumentation
The purpose of the RANN Acoustical Modeling Program at MIT was to produce a simplified instrumentation package and procedure
for use by non-acoustical specialists in simulation projects. The instrumentation used in this project was still in the experi-mental stage, being a "second generation" version. During the
project, improvements were made to the spark source and trigger mechanism, for example, which improved their consistency and
reliability. The final instrumentation package (roughly, the fourth generation) is now available for purchase or rental in the private sector.
The basic instrumentation used is shown in block diagram in Figures 15 through 17.(Figure 18 shows the actual spark
source and microphone used). Full specifications of the equip-ment available from the commercial supplier are provided in Appendix A.
The cost of the basic instrumentation package, including the spark source but not the microphone, is currently around $6800. A variety of miniature microphones are available, rang-ing from several hundred to two thousand dollars. The BBN 1/8" microphone used in this project (#UA-0036) is a sealed crystal which is calibrated to 120,000 Hz. It sells for $300. BBN
also markets a 1/lo" microphone which costs $700. Crystal micro-phones are practical for such model studies because they are
rugged and insensitive to humidity and temperature changes. Their drawback, however, is that they have a low sensitivity and therefore a fairly high noise floor. For modeling of inter-ior spaces, where a wider range of dynamic conditions is encoun-tered, condenser microphones may have to be used. A good con-denser microphone (as from B&K) will have a noise floor 20 to 30 dB lower than the crystals, but will cost several times more.
In addition to the spark source, it is possible to sim-ulate line source or industrial noise by the use of air jets. As with the spark source, such sources must be analyzed so that they can be filtered to represent the noise being modeled.
39
TRIGGER
PULSE ~SWITCH/.~
ELECTRODES
SPARK
FIGURE 15.
SPARK SOURCE
1/10" 5BN
MICROPHONE
TRIGGER
PULSE
FIGURE
16.
SIGNAL RECEPTION
SIGNAL
TRIGGER
AVERAGER
INTEGRATOR
SWITCH
O
AMP
OSCILLOSCOPE
I IDISPLAY0
FIGURE
17.
SIGNAL PROCESSOR
SIGNAL
41
-~
Positioning of the Spark Source on the Model
3.5 Using the System
Placement
Two issues are of critical importance in the physical use of the system: accurate measurements of height and placement of
the microphone and the sound source. The spark source was placed on the models so that the tip of the electrodes was at the exact height and location of the top of the truck stack in a particular
lane on the highway. The housing for the spark source power sup-ply was kept on the source-receiver axis to the rear to prevent
reflections which could interfere ( See figure 18. ).
The microphone was placed at carefully measured heights to represent the noise received by a person on the ground floor or-in the second floor apartment. It was important not to place the microphone directly next to the front of a house, since the distance from the microphone to the house surface would be less than some of the wavelengths of interest, and the resulting reflec-tions from the house surface would interfere with the level read-ing. In addition, the microphone had to be kept perpendicular to the plane of the sound source so that it was completely omni-directional in character.
Testing Methodology
Initially, a series of measurements were made on the model without any barriers of a simulated truck received at several
43
points on the model in the residential area. These were compared with actual field measurements conducted with a borrowed diesel truck (from First National Stores, whose headquarters were just beyond the study area ) to calibrate the model and verify its results.
Before beginning each set of tests (and every two hours as well) this calibration was checked by using the spark source and microphone at a standardized distance (3 meters) in a free field measurement off the model. Thus the measurements were
consis-tent from day to day, and calibrated to the actual field measure-ment of the sample truck used.
Two issues can be raised about this testing and calibration procedure. First, the height of the spark source was set at 8
feet, the standardized truck stack height used by the Federal Highway Administration. While probably a good average height,
some trucks do have higher stacks and will therefore require a higher noise barrier to achieve the same amount of reduction.
Second, the model was calibrated to a single test vehicle. Thus, actual field measurements may differ from those taken on the model as the mix of vehicles varies. However, the calibration was accur-ate for that one "typical" truck, so the model could be expected to produce reliable results for similar noise sources.
In any event, the measurement of interest is the amount of "excess attenuation" achieved by the insertion of barriers.
This refers to the noise reduction achieved beyond that of mol-ecular absorption that takes place in spherical spreading. The measurements taken on the model without barriers installed were within 2 dBA of the measured values in the field with the
cal-ibration truck. The measured excess attenuation of the barriers in the model, therefore, should also be within 2 dBA. This
level of accuracy will be obtained for noise sources of other levels, since the relative amount of reduction is not dependent on absolute level. This will be true as long as the effective height remains the same. If trucks with stacks higher than 8
feet are present, the excess attenuation shown in the model would drop. This can easily be modeled, however, so that all
potential situations can be evaluated if desired.
Points on the model were chosen to represent various ex-pected conditions. For example, one could expect that at the rear of the first row of houses adjacent to the highway, noise levels would be greatly reduced due to the shielding of the houses
(The issues explored are detailed in Section 4). Then a minimum
of three tests were conducted at each point to ensure consistency of results. In addition, several points were used in a cluster to avoid any aberrations. When the test results were not con-sistent, the tests were repeated again until they were verified.
After tests were concluded without barriers, they were done again with the barriers in place. The barriers, which varied in height on the roadside from 8 to 12 feet, were made of heavy
45
cardboard and were sealed to the roadway with duct tape to ensure
against any leakage (See figure 20.)
The difference between the
two measurements provided the degree of "excess attenuation"
achieved by each barrier configuration.
Altogether, some 1400 measurements were taken to cover both
models with and without barriers.
In addition, several special
studies were conducted, such as on the effect of the elevated
roadway on normal spherical spreading. These tests are
describ-ed in Chapter 4.
User Issues
Overall the system was readily useable by a non-acoustician.
In the initial set of tests the spark source misfired frequently,
providing inaccurate results. This necessitated long waits and
many additional tests. The third-generation spark source, which
was received midway through the project, solved this practical
problem.
Although 30,000 amps are involved when the spark jumps
and the voltage varies from 0 to 5 KV, safety was not a problem.
The voltage for the spark source is on for only 30 microseconds,
and the spark lasts for approximately 5 microseconds.
In addition,
the trigger switch for the spark is a remote, hand-held device
used by the operator, who is located away from the model to
pre-vent reflections off his body.
FIG. 19. View on Model of Bailey Road from 1-93 Without Noise Shield
47
Placement of the model was not difficult, but did require a room large enough to move the equipment around the 8 foot by
8 foot model. Reflecting surfaces, such as walls and ceilings, were not an issue as long as they were several feet away. Re-flections did come back to the microphone, but these could be identified, since they arrived after the peak levels of interest and could be ignored.- A substantial transient was also gener-ated by the spark as it went off. This showed up on the oscill-oscope as a sharp peak at the beginning of the trace. This trans-ient was removed in the processing equipment by use of a 4
milli-second delay.
On selected days the noise floor of the equipment rose quite high, threateningthe validity of the measurements. This noise floor was adjustable, however, and was maintained around
40.dB. Measurements 20 dM above the noise floor (60 dB and greater) were considered valid. The adjustments available on the commercially available instrumentation package have been greatly simplified and greater consistency has been achieved, making its use simpler and more foolproof. Familiarization with the equipment and the techniques involved should require
4,. Issues Investigated
The two models represented very different acoustical
environments and problems. Accordingly; the issues explored
on each in the simulation studies were quite different. In the
embankment area (Model I), the primary noise was the highway
traffic on Interstate 93.
Here the proposed solution was a
roadside barrier shield of 8 to 12 feet above the road surface
(See Figure 20 above).
Tests conducted on this model explored
the degree of excess attenuation achieved by various heights
of
roadside barriers for both ground-level and second-story
receivers with the noise source located at various positions
on the highway (the nearest northbound lane and the farthest
southbound lane were used for locations to represent the full
range of angles of incidence for the noise passing over the
barrier).
Figure 21 is a plan of the embankment area which shows
the boundries of Model I, an area approximately 400 by 400
feet square. The dashed line along Governor Winthrop Road is
the 65 dBA L
1 0contour calculated by the acoustical consultants
for the State Department of Public Works. The
L
level is
that level which is exceeded 10% of the time.
It thus
repre-sents a typical or average loud condition, even though occasional
passing vehicles will produce louder peaks. An exterior L
1 0Figure 21. Plan of Bailey Road Embankment Area Showinq Model I Location
A
vr-weather when windows are open. This corresponds to the maximum design levels allowed under Federal Highway Administration noise regulations.
Prior to the construction of 1-93 in Somerville (con-struction began in 1964 with right-of-way clearance), the 65 dBA
L10 contour was located on Bailey Road. By 1990 the 65 dBA
con-tour is projected to move to the rear of the row of houses along Governor Winthrop Road as truck volumes increase on 1-93 and noise levels in the community rise (Appendix D provides further technical data on 1-93 noise levels from the acoustical studies done by the state).
In the viaduct area (Model II), traffic noise emanates from the at-grade arterials which are perpendicular (the Fells-way), parallel (Mystic Avenue) or connecting beneath the via-duct (Mystic Avenue Northbound connector), as well as from the Interstate itself (See Figure 22.) Here two basic studies were conducted. First, excess attenuation was measured for a compre-hensive barrier system which included a roadside barrier on 1-93,
a ground-to-ceiling barrier beneath the viaduct and along the connector, and a berm and wall along the perpendicular arterial
(See Figures'23) - 26.)
Second, the channeling effect of the Interstate viaduct structure on at-grade traffic noise was investigated. Normal
Lk
9
V
LI
71LI
I
LLL
19'i]of
__
YZ
MODEL II LI-rj~r[]K7~jjIL
I i A250
Figure 22. Plan of Bailey Road Viaduct Area
Showing Model II Location
rr~
r
~1~I
p2:53
'1-LF)~S~
-1-
1711
AF F 6-C T too U1 M\15-MC AVE NI2-3 View of Bailey Road Looking Toward Ten Hills Road - Middlesex Fells Noise Shield and Mystic Av. North Shield in Place
Fig. 24 View of Bailey Road Looking Toward Ten Hills Road - Middlesex Fells, Mystic Av. North and Roadside 1-93 Shields in Place
53
Fig. 25 Ten Hills Road with Full Noise Control Along Middlesex Fells Parkway and Along Mystic Avenue Northbound Connector
L_...___
. ..Fig. 26 View of 1-93 From Between Houses on Bailey Road - Under Viaduct
Shield and Roadside Shield in Place
pppp-.q3
Figure 27. Typical Cross Section Showing 1-93 Noise Shield in Model I, Embankment Section
-5W .Qij
TEN -ILLS 0->.
kq LD lvz~lvN~sKrAve %A4
tce$SSCc
ADISC
J
eerJ
S1
O
receeJ
RA~I719
?(
'IK5
ThYPIC&L 5ECTION AqT CENr7&f atz SLOCK
UYSTIic AVE
Figure 28. Typical Cross Sections Showing Berm and Noise Shield, 1-93 Noise Shield and Recessed Noise Shield in Model II, Viaduct Section