O
pen
A
rchive
T
OULOUSE
A
rchive
O
uverte (
OATAO
)
OATAO is an open access repository that collects the work of Toulouse researchers and
makes it freely available over the web where possible.
This is an author-deposited version published in :
http://oatao.univ-toulouse.fr/
Eprints ID : 11771
To link to this article : DOI:10.1016/j.watres.2012.10.047
URL : http://dx.doi.org/10.1016/j.watres.2012.10.047
To cite this version : Barret, Maialen and Gagnon, Nathalie and Topp,
Edward and Masse, Lucie and Massé, Daniel I. and Talbot, Guylaine
Physico-chemical characteristics and methanogen communities in
swine and dairy manure storage tanks: Spatio-temporal variations and
impact on methanogenic activity. (2013) Water Research, vol. 47 (n°
2). pp. 737-746. ISSN 0043-1354
Any correspondance concerning this service should be sent to the repository
administrator: [email protected]
Physico-chemical characteristics and methanogen
communities in swine and dairy manure storage tanks:
Spatio-temporal variations and impact on methanogenic
activity
Maialen Barret
a, Nathalie Gagnon
a, Edward Topp
b, Lucie Masse
a, Daniel I. Masse´
a,
Guylaine Talbot
a,*
aDairy and Swine Research and Development Centre, Agriculture and Agri-Food Canada, 2000 College, Sherbrooke, Quebec J1M 0C8, Canada bSouthern Crop Protection and Food Research Centre, Agriculture and Agri-Food Canada, 1391 Sandford Street, London, Ontario N5V 4T3,
Canada Keywords: Methanogenic community Manure tank Methane Methanoculleus
a b s t r a c t
Greenhouse gas emissions represent a major environmental problem associated with the management of manure from the livestock industry. Methane is the primary GHG emitted during manure outdoor storage. In this paper, the variability of two swine and two dairy manure storage tanks was surveyed, in terms of physico-chemical and microbiological parameters. The impact of the inter-tank and spatio-temporal variations of these param-eters on the methanogenic activity of manure was ascertained. A Partial Least Square regression was carried out, which demonstrated that physico-chemical as well as micro-biological parameters had a major influence on the methanogenic activity. Among the 19 parameters included in the regression, the concentrations of VFAs had the strongest negative influence on the methane emission rate of manure, resulting from their well-known inhibitory effect. The relative abundance of two amplicons in archaeal fingerprints was found to positively influence the methanogenic activity, suggesting that Methanoculleusspp. and possibly Methanosarcina spp. are major contributors to methano-genesis in storage tanks. This work gave insights into the mechanisms, which drive methanogenesis in swine and dairy manure storage tanks.
1.
Introduction
In 2008, 12% of the greenhouse gas (GHG) emissions from the agricultural sector originated from manure management in Canada (Blain et al., 2010). In swine buildings, manure is first collected into gutters located under partially slotted floors for temporary indoor storage. Depending on the age of the pigs, it usually takes 1e3 weeks to fill the manure gutter. When the
gutters are full the manure flows by gravity to a transfer tank. Thereafter the manure is transferred to an outdoor storage prior to its spreading on farm land for agronomic valor-isation. On dairy farm, the manure is removed daily and transferred directly to the long-term manure storage. The carbon footprint of livestock products is becoming an important issue for the consumers. Therefore the GHG emission is becoming a concern for producers. Manure
* Corresponding author. Tel.: þ1 819 780 7129; fax: þ1 819 564 5507. E-mail address:[email protected](G. Talbot).
methane and nitrous oxide (N2O) emissions are respectively
emitted by manure storages and land applied manures (Park et al., 2006).
Methane emissions result from the activity of complex anaerobic consortia of fermentative bacteria together with methanogenic archaea, which metabolize the organic substrates available in manure. Communities of hydrolytic, acidogenic, and acetogenic bacteria ferment the macromol-ecules into acetate, H2, formate and CO2. These intermediates
are then converted into methane and CO2 by
hydro-genotrophic and/or acetoclastic archaea. This complex process depends on three factors: environmental parameters, substrate characteristics and microbial communities. The influence of several environmental parameters on the methane emissions from stored swine and dairy manure was studied. These include temperature (Sharpe and Harper, 1999) and the presence of a surface crust (Petersen and Ambus, 2006). The impact of manure composition, for example the total solids (TS) content, was also assessed (Martinez et al., 2003; Masse´ et al., 2003). These studies were carried out either in lab-scale experiments focused on a few number of manure samples or in on-site experiments, which provide partial information on actual methane emissions. However, some physico-chemical characteristics of manure such as pH, TS and ammoniacal nitrogen (NH3) contents were
shown to vary as a function of time in storage tanks (Park et al., 2006) and the stratification of bacterial community structure as a function of depth was also stated (Whitehead and Cotta, 2001). Similar observations were made in an anaerobic swine waste treatment lagoon, while the total bacteria concentration, as measured by quantitative PCR targeting 16S rRNA gene, did not vary with depth (Lovanh et al., 2009; Cook et al., 2010). To understand more thor-oughly the driving mechanisms and to better assess the methane emissions from storage tanks, more research is needed to take into account the spatio-temporal variations of manure physico-chemical characteristics. In addition, the influence of microbial communities on methanogenic activity has been under investigated. Several studies have examined and identified the bacteria and archaea present in stored manure using 16S rRNA gene sequences (Whitehead and Cotta, 2001; Snell-Castro et al., 2005), but literature con-cerning the relationship between the microbial community structure and the methanogenic activity is scarce. One study recently showed that specific archaeal phylotypes related to Methanoculleus (Barret et al., 2012) were enriched during in vitromethanogenesis of samples from two swine manure storage tanks, suggesting that these phylotypes would be involved in methanogenesis.
The main objective of this study was to improve our understanding of the mechanisms that drive methane emis-sions in storage tanks. The specific objective of this study was to survey the spatial (within tank), temporal and tank-to-tank variability of swine and dairy manure in terms of physico-chemical characteristics, structure of methanogenic archaeal community and methanogenic activity. This work was based on an extensive sampling campaign (96 samples), followed by the characterization of these samples and the assessment of their methanogenic activity in lab-scale anaerobic incubations.
2.
Material and methods
2.1. Manure samples
Two swine (tanks 1 and 2; 35 and 27 m diameter, respectively) and two dairy (tanks 3 and 4; 28 and 22 m diameter, respec-tively) farms located near Sherbrooke, Que´bec, Canada, were selected for the study. Manure was stored outdoors in concrete storage tanks having 3.7 m depth for tanks 1e3 and 4.1 m depth for tank 4. The swine manures were sampled in April 2010 (T1), June 2010 (T2) and April 2011 (T3). The dairy manure samples were taken in June 2010 (T1), September 2010 (T2) and April 2011 (T3). In these farms, swine manure is usually added into dairy manure storage tanks for liquefac-tion, to facilitate mixing and land spreading. Sampling was carried out the week before mixing for land spreading, except for tank 3 at collection times T1 and T2. The stored manure was neither mixed and land applied during the fall and winter periods (from October to March). The samples were collected at three points located at the periphery of the tanks (A, B, C) and at two or three depths depending on collection time and presence/absence of a surface crust (Table S1, Supplementary data), resulting in six to nine 1-L samples from each tank and collection time. The sampling apparatus consisted of a 3.6-m long aluminium rod connected to a container with a retract-able lid, which was plunged into the storage tanks and opened at the sampling position and depth. From each primary manure sample, 4 ! 0.5 mL aliquots were removed and immediately frozen in liquid nitrogen for molecular biology analyses. The remaining sample was maintained at ambient temperature during the transport from the farm to the labo-ratory for subsequent anaerobic incubation.
2.2. Anaerobic incubation of manures
Within 4 h following collection, duplicate 230-g sub-samples from each primary manure samples were transferred into 500-mL bottles. The remainder (w500 mL) was then frozen at "20#C prior to physico-chemical characterization. The bottles
containing 230 g were flushed with nitrogen then sealed with a butyl rubber stopper and an aluminium cramp. They were incubated at 25#C in a thermo-regulated chamber, to mimic
the summer temperature in Canadian storage tanks (Masse´ et al., 2008).
At least once a week, biogas volume was measured with a 2089 pressure gauge (Ashcroft Inc., Stratford, USA), then released. An 8-mL sample was collected from the gaseous phase of one of the replicate bottles to analyze biogas composition. Following sampling of the head space gas, the bottles were shaken manually to homogenize the contents. The methane emission rate of manures was estimated from data from the first 20 days of incubation.
2.3. Fingerprinting of archaeal populations
From the frozen sub-samples taken on sampling days, DNA was extracted using the bead beating method (Griffiths et al., 2000), with minor modifications (Roy et al., 2009). To finger-print the archaeal community, the LH-mcrA method detailed
in our precedent study (Gagnon et al., 2011) was used, which is based on natural length variations of the alpha-subunit of the methyl-coenzyme-M reductase involved in methane forma-tion by methanogenic archaea. This high throughput method uses universal primers (mcrAfornew: 50-GGT GTM GGD TTC
ACH CAR TAY GC-30 and mcrArevnew: 50-6-FAM-TTC ATN
GCR TAG TTH GGR TAG TT-30) to amplify the mcrA gene, which
is then analyzed using capillary electrophoresis. PCR mixtures consisted of 1! Taq buffer (Bioshop Canada Inc., Burlington, ON, Canada), 1.5 mM MgCl2(Bioshop Canada Inc.), 0.5 mM of
each primer (Applied Biosystems Canada), 0.1 mM of deoxy-nucleotide triphosphate (Bioshop Canada Inc.), DNA from manure (100 ng), and 0.625 U of Taq polymerase (Bioshop Canada Inc.) in a final volume of 25 mL. DNA denaturation was performed at 94#C for 2 min, followed by 28 cycles at 94#C for
60 s, annealing at 55#C for 60 s and elongation at 72#C for 60 s,
and a final extension step at 72#C for 30 min, in an Eppendorf
gradient thermal cycler (Fisher Scientific Ltd). Amplifications were performed in duplicate. A 1-mL aliquot of appropriately diluted LH-mcrA amplification products were mixed with 0.06 mL of GeneScan! 500 LIZ"
Size Standard (Applied Bio-systems Canada) and 12.3 mL of Hi-Di Formamide (Applied Biosystems Canada). Electrophoresis was performed on a 3100-Avant Genetic Analyzer (Applied Biosystems Canada) using a 36-cm long capillary array and for 40 min in the Gen-eScan mode. Length analysis between 300 and 500 bp and determination of peak height were done using the Gen-eMapper"
Analysis Software (Applied Biosystems Canada). Based on the peak heights, the relative abundance of each amplicon could be assessed.
2.4. Physico-chemical analyses
The frozen primary manure sample (approximately 500 mL) was thawed then homogenized using a PT10/35 Polytron (Binkman Instruments, Rexdale, Canada). The sample was analyzed for TS, total suspended solids (TSS), volatile solids (VS), volatile suspended solids (VSS), total Kjeldhal nitrogen, (NH3) and pH, as described in Barret et al. (2012). Organic
nitrogen concentration (Norg) was deduced from total Kjeldhal and NH3by subtraction.
2.5. Data analysis
One-factor analysis of variance (ANOVA) was performed using Excel (Microsoft Corporation, Redmond, USA).
To analyze the variability of multivariate data, Multi-Response Permutation Procedure (MRPP), Indicator Species Analysis (ISA), and Non-Metric Multidimensional Scaling (NMS) were performed using BrayeCurtis (i.e. Sørenson) distance measures in the PC-ORD software (McCune and Mefford, 1999). MRPP was used to test for significance of group differences, taking into account the variability between the samples of each group. A p value <0.05 was considered significant. ISA (Dufrene and Legendre, 1997) was used to identify amplicons responsible for the differences observed among groups of LH-mcrA fingerprints. For each amplicon, the proportional abundance in a particular group relative to the abundance in all groups and the relative frequency within a group were calculated. Indicator values (range from 0 to 100;
absent to exclusively present, respectively) were obtained by multiplying the relative abundance by the relative frequency of each amplicon in a given group, as determined from fingerprint data. Physico-chemical characteristics were rela-tivized then reduced to single points which were projected into a two-dimensional space (biplot) using NMS ordination method. NMS was performed using 100 iterations with random starting configurations to ensure that minimum stress was achieved for the final ordination. The NMS biplots were rotated by varimax rotation (McCune and Grace, 2002).
Multivariate regression was carried out using the partial least-squares (PLS) method. The PLS regression is based on constructing PLS factors by minimizing the covariance between the dependent variable (Y block) and the explicative variables (X block). The prediction of Y block is then calculated with a linear regression on the X block using the software R version 1.2.2 and by using PLS functions developed elsewhere (Durand, 2012). These functions have been designed to deal with roughly correlated explicative variables (Wold et al., 1983). The number of PLS factors (dimension, dim) was determined by minimizing the mean squared predictions error (Predicted REsidual Sum of Squares, PRESS) through a leave-one-out cross-validation procedure.
3.
Results and discussion
3.1. Spatio-temporal variability of manure physico-chemical characteristics
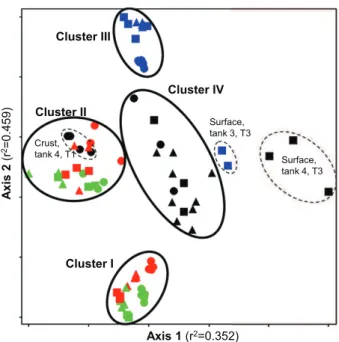
The NMS projection of physico-chemical characteristics gives an overview of the manure variability within the set of 92 analyzed samples (Fig. 1). The manures primarily gathered in 4 regions of the NMS projection, defining clusters I, II, III and IV. MRPP tests confirmed that these 4 clusters significantly differed from each other ( p < 0.0001). Significant differences between the 4 clusters were found for each of the 19 physico-chemical parameters (ANOVA tests, p < 0.01), suggesting that they were relevant indicators in this study. A few exceptions were out of this clustering. First, the samples from the surface crust of tank 4, at T1, were located near the bottom swine manures in the biplot. The crust samples presented much higher concentra-tions of chemical oxygen demand and solids than in the liquid samples from the same tank (Table 1). The second exception was the shallow depth of both dairy manure tanks at T3, located in the right of the biplot. At T3, the snow and ice that had accumulated during winter on the surface were still melting, resulting in the dilution with water of manure at shallow depth. Much lower concentrations of total (e.g. CODtot,
TS) as well as soluble (CODsol, K and VFAs for example)
char-acteristics demonstrated this dilution effect (data not shown). All shallow-depth samples from the two swine manures clustered together (Fig. 1, Cluster I). Indeed, in each of the two swine manure tanks and at each sampling time, samples from shallow depths were similar, and they were different from the ones taken at the bottom (Table 2, MRPP tests 1e7). The bottom samples from tank 1 and 2 also clustered together (Fig. 1, cluster II). In both tanks, the bottom samples contained significantly higher concentrations of almost all total and soluble parameters (Table 1). These differences are likely the
result of sedimentation of manure particles. In addition, the higher concentrations of soluble intermediates of anaerobic metabolism (CODsol, VFAs) indicate a different balance
between hydrolysis/acidogenesis and acetogenesis/meth-anogenesis: either the sedimentation of particle substrates creates a hot spot for hydrolysis/acidogenesis at the bottom and/or the rate of acetogenesis/methanogenesis may be low-ered at the bottom, by inhibition phenomena for instance. Significant temporal variations were found at shallow depth as well as at the bottom (Table 2, MRPP tests 8e10). In spite of this temporal variability, the group formed by samples from tank 1 was significantly different from the one from tank 2 within clusters I and II (MRPP test, p < 0.01). This difference was due to significantly (ANOVA tests, p < 0.05) higher CODtot,
TS, VS, TSS, VSS, N-NH3, K, alkalinity, acetate, propionate,
isovalerate and lower butyrate, valerate and caproate at the shallow depths of tank 1 than at the shallow depths of tank 2 (Table 1). At the bottom, it was due to higher concentrations of N-NH3, K, acetate and propionate, and lower concentrations of
butyrate, valerate and caproate in tank 1 than in tank 2. Cluster III encompassed the manures from tank 3, which had lower concentrations of VFAs than all other manures (Table 1). Within this cluster, the stored manure from dairy
farm 3 revealed temporal variations (Table 2, MRPP test 8e10). Since the manure had been mixed prior to spreading before sampling at T1 and T2, no stratification of physico-chemical parameters was found (Table 2, MRPP test 1e6). At T3, a difference was found between shallow-depth and bottom samples (Table 2, MRPP test 7). In cluster IV, the samples from shallow depths below the crust taken in the storage tank 4 at T2 significantly differed from the bottom ones (Table 2, MRPP test 4e6). The higher (ANOVA tests, p < 0.05) concentrations of CODtot, TS, VS, TSS, VSS, Norg, P and alkalinity at the bottom
suggested that this variation with depth of stored dairy manure originated from particle sedimentation, like in stored swine manures. Within cluster IV, no temporal variations could be detected (Table 2, MRPP test 8e10). Manure from farm 4 was the only one that did not exhibit variations over time.
3.2. Spatio-temporal variability of methanogen communities in manure storage tanks
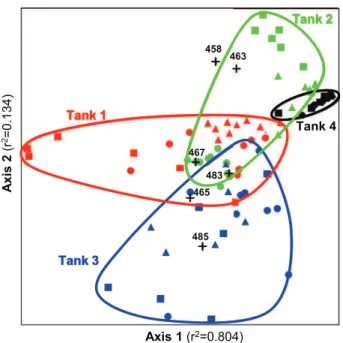
LH-mcrA fingerprints of methanogen communities revealed 7 amplicons at 458, 463, 465, 467, 481, 483 and 485 bp. Their relative abundance averaged over the whole set of samples was 0.2 % 0.6%, 2 % 5%, 5 % 6%, 14 % 12%, 3 % 6%, 5 % 6% and 72 % 19%, respectively (Figure S1). The most abundant ampli-con, 485-bp one, could tentatively be related to Meth-anocorpusculum, Methanogenium and/or Methanospirillum genera and the 467-bp amplicon to yet to be identified organisms (Gagnon et al., 2011; Barret et al., 2012). The overall structure of methanogen communities in the four stored manures, in terms of dominant genera, was thus similar to previously studied ones (Snell-Castro et al., 2005; Peu et al., 2006; Gagnon et al., 2011).
LH-mcrA fingerprints from swine manures were different from that obtained from dairy manures, as revealed by MRPP test (p value ¼ 0.00007). This difference mainly resulted from the detectable presence of 458-bp and 463-bp amplicons in swine manures (Fig. 2, Figure S1). However, both of these amplicons remained minor in swine manures. None of the major peaks discriminated swine manures from dairy manures. This might result from the manure management practice that consists in adding swine manure in dairy manure storage tanks for liquefaction before land spreading. Regardless of sampling time and depth, LH-mcrA finger-prints from each of the 4 farms gathered in a specific region of the NMS biplot (Fig. 2). Despite some overlapping of these regions on NMS biplot, manures were different in one tank from each other, as confirmed by MRPP analyses (p ' 0.0001). Indicator species analysis revealed that these differences primarily resulted from a higher abundance of the 467- and 483-bp amplicons in tank 1, of the 463-bp amplicon in tank 2, of the 465- and 481-bp amplicons in tank 3 and of 485-bp amplicon in tank 4 (Table 3).
Some significant intra-tank variations were also found. The groups formed by LH-mcrA fingerprints from sampling times T1, T2 and T3 were all distinct in the case of tank 1 and tank 2 (Table 4, MRPP tests 1e3). This is consistent with previous studies that showed seasonal variations of bacterial community structure in a swine waste treatment lagoon (Lovanh et al., 2009; Cook et al., 2010). On the contrary, archaeal communities in dairy manure storage tanks
Axis 1 (r2=0.352) A xis 2 (r 2= 0 .4 5 9 ) Cluster I Cluster II Cluster III Cluster IV Surface, tank 4, T3 Surface, tank 3, T3 Crust, tank 4, T1
Fig. 1 e NMS representation of the physico-chemical characteristics of swine and dairy manure samples. Manure samples from tanks 1, 2, 3 and 4 are respectively represented in red, green, blue and black. The circles, triangles and squares respectively represent collection times 1, 2 and 3 for each tank. Cluster I includes the samples from the shallow depths of the two swine manure storage tanks (1 and 2), cluster II the samples from the bottom of the two swine manure storage tanks, cluster III the samples from dairy tank 3 and cluster IV the samples from dairy tank 4. The exceptions of this clustering are indicated with dashed lines and their identification is provided on the figure. (For interpretation of the references to colour in this figure legend, the reader is referred to the web version of this article.)
exhibited minor temporal changes (Table 4, MRPP tests 1e3). The microbial communities of swine feces were shown to vary as the animals grow (Kim et al., 2011). Moreover, the residence time of animals in growing-finishing piggeries lasts a few months, whereas lactating cows are housed for several years, which could explain the different temporal dynamics of swine and dairy manure in storage tanks.
Tank 3 had been mixed before T1 and T2 sampling times. As expected, the corresponding archaeal communities were
similar at the different depths (Table 4, MRPP tests 4e10). The stratification of archaeal communities as a function of depth was evidenced at p < 0.05 significance only in swine manure tanks, in early springs 2010 (T1) and 2011 (T3) for tank 1 and in early spring 2010 for tank 2. As manure is not spread during winter, the storage tanks had not been mixed for several months before the spring samplings. This might have fav-oured gravity settling, and thus the stratification of microbial communities in conjunction with the stratification of the
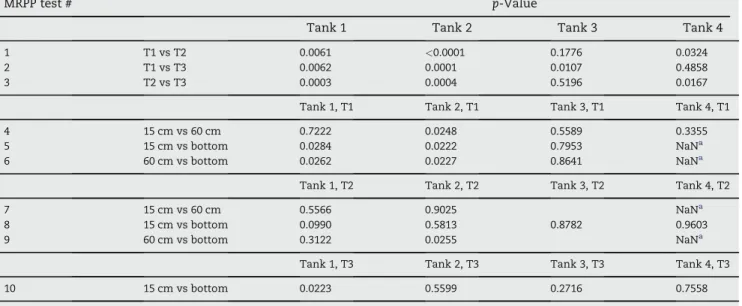
Table 2 e Comparison of manures from the different depths at given sampling times (tests 1e7) and from the different sampling times (tests 8e10) using multi-response permutation procedure (MRPP) on distance matrices from the physico-chemical characteristics of each tank.
MRPP test # p-Value
Tank 1, T1 Tank 2, T1 Tank 3, T1 Tank 4, T1
1 15 cm vs 60 cm 0.311 0.907 0.538 0.121
2 15 cm vs bottom 0.023 0.022 0.023 <0.001
3 60 cm vs bottom 0.023 0.021 0.235 <0.001
Tank 1, T2 Tank 2, T2 Tank 3, T2 Tank 4, T2
4 15 cm vs 60 cm 0.772 0.658 0.623
5 15 cm vs bottom <0.001 0.022 0.804 0.041
6 60 cm vs bottom <0.001 0.022 0.023
Tank 1, T3 Tank 2, T3 Tank 3, T3 Tank 4, T3
7 15 cm vs bottom 0.023 0.021 0.034 0.022
Tank 1, shallow Tank 1, bottom Tank 2, shallow Tank 2, bottom Tank 3 Tank 4a
8 T1 vs T2 <0.001 <0.001 <0.001 0.023 <0.001 0.158
9 T1 vs T3 0.001 0.025 0.002 0.072 <0.001 0.341
10 T2 vs T3 0.006 <0.001 0.001 0.032 0.003 0.202
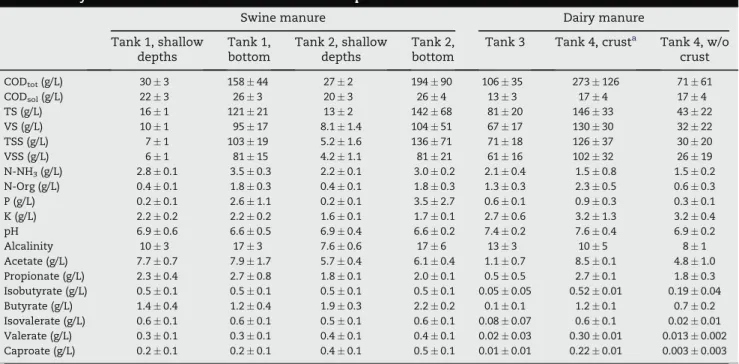
a The samples from surface crust were not taken into account in this statistical analysis. Table 1 e Physico-chemical characteristics of manure samples.
Swine manure Dairy manure
Tank 1, shallow depths Tank 1, bottom Tank 2, shallow depths Tank 2, bottom
Tank 3 Tank 4, crusta Tank 4, w/o
crust CODtot(g/L) 30 % 3 158 % 44 27 % 2 194 % 90 106 % 35 273 % 126 71 % 61 CODsol(g/L) 22 % 3 26 % 3 20 % 3 26 % 4 13 % 3 17 % 4 17 % 4 TS (g/L) 16 % 1 121 % 21 13 % 2 142 % 68 81 % 20 146 % 33 43 % 22 VS (g/L) 10 % 1 95 % 17 8.1 % 1.4 104 % 51 67 % 17 130 % 30 32 % 22 TSS (g/L) 7 % 1 103 % 19 5.2 % 1.6 136 % 71 71 % 18 126 % 37 30 % 20 VSS (g/L) 6 % 1 81 % 15 4.2 % 1.1 81 % 21 61 % 16 102 % 32 26 % 19 N-NH3(g/L) 2.8 % 0.1 3.5 % 0.3 2.2 % 0.1 3.0 % 0.2 2.1 % 0.4 1.5 % 0.8 1.5 % 0.2 N-Org (g/L) 0.4 % 0.1 1.8 % 0.3 0.4 % 0.1 1.8 % 0.3 1.3 % 0.3 2.3 % 0.5 0.6 % 0.3 P (g/L) 0.2 % 0.1 2.6 % 1.1 0.2 % 0.1 3.5 % 2.7 0.6 % 0.1 0.9 % 0.3 0.3 % 0.1 K (g/L) 2.2 % 0.2 2.2 % 0.2 1.6 % 0.1 1.7 % 0.1 2.7 % 0.6 3.2 % 1.3 3.2 % 0.4 pH 6.9 % 0.6 6.6 % 0.5 6.9 % 0.4 6.6 % 0.2 7.4 % 0.2 7.6 % 0.4 6.9 % 0.2 Alcalinity 10 % 3 17 % 3 7.6 % 0.6 17 % 6 13 % 3 10 % 5 8 % 1 Acetate (g/L) 7.7 % 0.7 7.9 % 1.7 5.7 % 0.4 6.1 % 0.4 1.1 % 0.7 8.5 % 0.1 4.8 % 1.0 Propionate (g/L) 2.3 % 0.4 2.7 % 0.8 1.8 % 0.1 2.0 % 0.1 0.5 % 0.5 2.7 % 0.1 1.8 % 0.3 Isobutyrate (g/L) 0.5 % 0.1 0.5 % 0.1 0.5 % 0.1 0.5 % 0.1 0.05 % 0.05 0.52 % 0.01 0.19 % 0.04 Butyrate (g/L) 1.4 % 0.4 1.2 % 0.4 1.9 % 0.3 2.2 % 0.2 0.1 % 0.1 1.2 % 0.1 0.7 % 0.2 Isovalerate (g/L) 0.6 % 0.1 0.6 % 0.1 0.5 % 0.1 0.6 % 0.1 0.08 % 0.07 0.6 % 0.1 0.02 % 0.01 Valerate (g/L) 0.3 % 0.1 0.3 % 0.1 0.4 % 0.1 0.4 % 0.1 0.02 % 0.03 0.30 % 0.01 0.013 % 0.002 Caproate (g/L) 0.2 % 0.1 0.2 % 0.1 0.4 % 0.1 0.5 % 0.1 0.01 % 0.01 0.22 % 0.01 0.003 % 0.003
Unless specified, samples from all sampling points, depths and times were included to calculate the mean and standard deviation. a Sampling date T1.
substrates and environmental parameters. After at least one mixing episode, the archaeal community stratification was not detectable at T2 although the gradient of physico-chemical parameters was reestablished. This phenomenon may be linked with the different time scale of the mechanisms
that lead to these two types of stratification after homogeni-zation. In dairy manure storage tanks, shallow-depth communities could not be clearly distinguished from bottom communities even when samples were taken in early spring (T3). This is consistent with the observation made on physico-chemical parameters that the stratification of dairy manure storage tanks was less marked than that of swine manure storage tanks (Fig. 1).
3.3. Spatio-temporal variability of manure methanogenic activity
An example of the dynamics of acetate concentration, propi-onate concentration and biogas production during the anaerobic incubation of manure is presented inFig. 3. At 200 days of incubation, the methane production reached 0.12 L/kg COD (0.23 L/kg VS), which represents a yield of COD conver-sion into methane of 34%. To better represent the in situ conditions, the methanogenic activity was calculated as the average of methane production rate between days 0 and 20, the time period during which the acetate and propionate concentrations were similar to the initial values. The manure samples were compared on the basis of ANOVA analysis carried out on the methane emission rates, with p-value ¼ 0.05 as the significance threshold.
In each swine manure storage tank, the methanogenic activity of samples from shallow depths was similar and lower than that of bottom samples. The comparison between sampling times demonstrated the stability of methanogenic activity at the shallow depths of both tanks. At the bottom of both tanks, on the contrary, a higher methane emission rate was measured in April 2010 than in June 2010 and April 2011, which were similar. The time-averaged methane emission rate of tank 1 was higher than that of tank 2, at shallow depth as well as at the bottom (Fig. 4).
The dairy manure in tank 3 had been mixed before T1 and T2 sampling times, explaining the spatial homogeneity of
Table 3 e Indicator species analysis of the LH-mcrA fingerprints grouped by tank, regardless of sampling time, point and depth.
Amplicon (bp) Related toa IVb p-valuec LH-mcrA abundance in group
with maximum IVd(%)
Tank 1 Tank 2 Tank 3 Tank 4
458 e 6 15 0 0 0.065 0.4 % 1.1 463 Methanosaetaand Methanobrevibacterspp. 5 46 0 0 0.001 6 % 8 465 Unidentified cluster 13 19 52 3 0.001 10 % 7 467 Unidentified cluster 47 19 27 5 0.001 26 % 12 481 Methanoculleusand Methanosarcinaspp. 3 0 82 0 0.001 10 % 8 483 Methanoculleusspp. 40 11 30 0 0.002 8 % 4 485 Methanocorpusculum, Methanogeniumand Methanospirillumspp. 21 26 20 33 0.001 96 % 4
a according toGagnon et al. (2011)andBarret et al. (2012).
b Indicator Value ¼ relative abundance ! relative frequency. For each LH-PCR amplicon, the maximum IV across the four clusters is indicated in bold.
c Statistical significance of the maximum IV for a given amplicon across the four groups. d Mean % standard deviation.
Axis 1 (r2=0.804) A xis 2 (r 2= 0 .1 3 4 ) Tank 2 Tank 4 Tank 1 Tank 3 458 463 465 467 483 485
Fig. 2 e NMS representation of methanogen communities in swine manure samples (tank 1: red, tank 2: green) and dairy manure samples (tank 3: blue, tank 4: black). The circles, triangles and squares respectively represent collection times 1, 2 and 3 for each tank. The seven LH-mcrA amplicons (458, 463, 465, 467, 481, 483 and 485 bp) are indicated in the NMS biplot (crosses). (For interpretation of the references to colour in this figure legend, the reader is referred to the web version of this article.)
methanogenic activity in the two corresponding groups of samples. At T3 sampling time, the activity of shallow-depth samples was not different from that of bottom ones. Manures from T1 produced more methane than manures from T2, the latter being similar to manures from T3. In tank 4, the samples taken in the surface crust at T1 exhibited a higher methanogenic activity than the bottom samples, which were similar to the under-crust samples taken at T2 and T3. The time-averaged methane emission rate of tank 3 was higher than that of tank 4 (Fig. 4). Taken as a whole, stored dairy manures emitted methane with a higher rate than swine ones.
3.4. PLS regression analysis for manure methanogenic activity
To evidence some eventual links between the methanogenic activity data and manure physico-chemical characteristics and archaeal communities, a PLS regression was carried out. The regression permitted the estimation of the coefficients necessary to express the methane emission rate of 90 manures as a function of their 19 physico-chemical and 7 microbiological characteristics (26 explicative variables in X block). In this regression, it was determined that three groups of parameters had the same influence, resulting from
0 0,04 0,08 0,12 0,16 Tank 1, Shallow depths (29)
CH
4emission
rate
(L
1 a tm , 0 °C/k
g
m a n ur e/d
a
y)
Tank 1, Bottom (18) Tank 2, Shallow depths (30) Tank 2, Bottom (18) Tank 3 (42) Tank 4 (48) a b b c d eFig. 4 e Methane emission rates of the swine and dairy manures incubated at 25#C. The number of samples used
to calculate the mean and standard deviation is indicated between brackets. Statistical significance (ANOVA, p <0.05) of group-to-group differences is indicated by the letters a, b, c, d, e. 0 5 10 15 20 25 0 1 2 3 4 5 6 7 8 9 10 0 50 100 150 200 C u m u la ti v e b io g a s v o lu m e (L /k g m a n u re ) Acet at e, p ro p io n at e (g /L ) Time (day) acetate propionate Vbiogas
Fig. 3 e Monitoring of anaerobic metabolism during manure incubation. Dynamics of biogas production (white), acetate concentration (black) and propionate concentration (grey) during the anaerobic incubation of a swine manure sample from the bottom of tank 1, taken in April 2010.
Table 4 e Comparison of archaeal communities from the different sampling times (tests 1e3) and from the different depths at sampling time 1 (tests 4e10) using multi-response permutation procedure (MRPP) on distance matrices from LH-mcrA fingerprint data of each tank.
MRPP test # p-Value
Tank 1 Tank 2 Tank 3 Tank 4
1 T1 vs T2 0.0061 <0.0001 0.1776 0.0324
2 T1 vs T3 0.0062 0.0001 0.0107 0.4858
3 T2 vs T3 0.0003 0.0004 0.5196 0.0167
Tank 1, T1 Tank 2, T1 Tank 3, T1 Tank 4, T1
4 15 cm vs 60 cm 0.7222 0.0248 0.5589 0.3355
5 15 cm vs bottom 0.0284 0.0222 0.7953 NaNa
6 60 cm vs bottom 0.0262 0.0227 0.8641 NaNa
Tank 1, T2 Tank 2, T2 Tank 3, T2 Tank 4, T2
7 15 cm vs 60 cm 0.5566 0.9025 NaNa
8 15 cm vs bottom 0.0990 0.5813 0.8782 0.9603
9 60 cm vs bottom 0.3122 0.0255 NaNa
Tank 1, T3 Tank 2, T3 Tank 3, T3 Tank 4, T3
10 15 cm vs bottom 0.0223 0.5599 0.2716 0.7558
a Not a number: in several samples from tank 4, only the 485-bp amplicon was detected. If samples of one group had 100% abundance of the 485-bp amplicon, the skewness of delta (weighted mean within-group distance) was "N and no conclusion could be withdrawn from MRPP test.
correlations between these variables. The VS group was composed of TS, VS, TSS, VSS, N-org and alkalinity (r2between
0.32 and 0.98). Acetate, propionate, isobutyrate and iso-valerate formed the acetate group (0.76e0.99) and butyrate, valerate and caproate the butyrate group (0.91e0.95). For correlated parameters, it cannot be determined whether all of them or only some of them actually influenced the methane production rate. To simplify the PLS equation, one variable was chosen to represent each group: VS, acetate and butyrate, respectively. A new PLS regression was performed with the resulting X block of 16 explicative variables, which gave:
rCH4¼11:9 þ 19:0A458þ26:0A463"11:3A465"41:4A467þ170A481
þ163A483"16:9A485þ0:0057DCOtot"0:410DCOsol
þ0:192VS þ 0:0028NH3"0:153P þ 13:2K þ 5:94pH
"3:91Acetate " 17:8ButyrateðPRESS ¼ 0:24; dim ¼ 3Þ With this equation, the regression coefficient r2between the
90 measured and modelled methane production rates reached 0.82. This regression would make it possible to predict the methane emission rate at 25#C for a manure sample from its
characteristics. It is noteworthy that measuring the most influential parameters among the 16 ones included in the equation is enough for prediction, since it is possible to deal with lacking parameters. For predicting on-site methane emissions, the temperature should be integrated to the regression as a predictive variable since this parameter has a major influence (Masse´ et al., 2008). Moreover, the in situ availability and transfer of the substrates and products might differ from that during laboratory incubations, notably because pressure and mixing conditions are different. For these reasons, the PLS regression can hardly be used for prediction, but it is an interesting explicative tool since it gives information about the relative weight of each predictor. Their weight can be compared by considering the regression coefficients relative to centred and reduced predictors (Fig. 5). Although the influence of some of the parameters discussed below had already been reported, we classified such parameters, along with new ones, by order of
weight. This new result made it possible to identify the driving mechanisms at work during laboratory incubations. The first observation that can be made is the presence of physico-chemical as well as microbiological variables in the highest-weight predictors, which confirms the relevance of inte-grating both types of indicators.
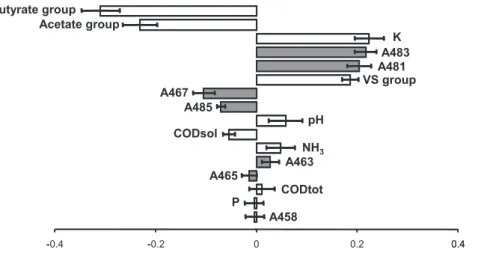
Among the physico-chemical predictors, we found that the concentrations of the two groups of VFAs were the most influential for methanogenic activity. The higher the VFA concentrations, the lower the methane emission rate. The PLS analysis thus reflects the well-identified inhibitory effect of VFAs on methanogenesis (Gorris et al., 1989).
The potassium concentration was found to positively correlate with the methane emission rate of manure, with a centred and reduced regression coefficient of 0.22 % 0.04 (Fig. 5). The potassium concentration was higher in dairy manure samples (2.7 % 0.9 g/L) than in swine manure ones (1.9 % 0.3 g/L). To investigate more thoroughly the influence of potassium concentration, two independent PLS regressions were carried out with swine manures and dairy manures. Interestingly, Kþ concentration had a major effect in the
regression from swine manures (centred and reduced coeffi-cient of 0.19 % 0.03) and a minor but significant effect in that from dairy manures (0.08 % 0.04). Based on these results, we could exclude the assumption that the influence of Kþ
concentration in the overall PLS regression would only reflect the effect of sample type. At a cellular level, potassium is involved in a wide range of biological mechanisms, including energy conservation and osmotic pressure balance. It was demonstrated in Methanohalophilus strain Z7302 that potas-sium participates in halotolerance mechanisms as a compat-ible solute to balance the external and internal osmotic pressures (Lai and Gunsalus, 1992). The methane formation is linked with the transmembrane potential since the energy conservation during methanogenesis relies on the trans-membrane transport of protons and sodium (Thauer et al., 2008). In addition, the activity of formyltransferases (key methanogenesis enzymes) depends on potassium salt concentration (Mamat et al., 2002). At an ecosystem level,
-0.4 -0.2 0 0.2 0.4 Butyrate group Acetate group K A483 A481 VS group A467 A485 pH CODsol NH3 A463 A465 CODtot P A458 - - 0.4
Fig. 5 e Centred and reduced regression coefficients in PLS analysis of methanogenic activity. The microbiological predictors are indicated in grey, the physico-chemical predictors in white. The error bars represent the interval of 95% confidence based on five independent estimates of the coefficients. These estimates were carried out on five sets of randomly selected individuals, each set representing 75% of the total individuals (68 individuals).
Schnu¨rer et al. (1999)found that the potassium concentration, between 0.05 and 6 g L"1, positively correlated with the fraction
of acetate metabolized through the hydrogenotrophic pathway (over the acetoclastic one) in biogas reactors. The positive influence of potassium revealed by the PLS regression might thus result from biological phenomena. It could also result from an indirect role linked with the impact of potas-sium on the chemistry of manure solutions, through ionic interactions for example. The actual influence of potassium salt concentration in stored manure remains to be determined. The next most influential physico-chemical parameter is the VS group. The VS are composed of active microorganisms and inactive organic matter, i.e. potential substrates for the microorganisms. Other parameters included in the regression, such as VFAs and soluble COD, are better indicators of the concentration of available substrates for methanogens. Here, the positive influence of VS group probably reflects the higher activity of manure when the concentration of microorgan-isms, including methanogens, increases.
The rest of the physico-chemical parameters had minor influences. The pH value had a positive effect, probably because of (i) the reduced toxicity of anionic VFAs at neutral pH values compared to the unionized species at acidic pH (Dhaked et al., 2003) and (ii) the optimal pH for growth of several methanogens being inherently around neutrality (Boopathy and Kulpa, 1994; Lai et al., 2004).
Among the microbiological variables, the relative abun-dance of 481- and 483-bp amplicons in LH-mcrA fingerprints had a strong positive effect on methanogenic activity, while the relative abundance of 463- and 485-bp amplicons had a moderate negative effect. These effects jointly show that the higher the relative abundance of the methanogens corre-sponding to 481- and 483-bp amplicons, the higher the methane emission rate of manure. This result suggests that these amplicons represent the most active methanogens in swine and dairy manure storage tanks. According to recent publications, the 481-bp amplicon could be assigned to Meth-anosarcinaceae and/or Methanoculleus spp., and the 483-bp one to Methanoculleus spp. (Gagnon et al., 2011; Barret et al., 2012). Methanosarcinaceae are acetoclastic methanogens, whereas Methanoculleus spp. are hydrogenotrophic, which indicates that methane would be produced in manure storage tanks either exclusively through the hydrogenotrophic pathway only or through both hydrogenotrophic and acetoclastic pathways. The hydrogenotrophic pathway was shown to be dominant at the high ammonia (Angenent et al., 2002; Schnu¨rer and Nordberg, 2008) and acetate (Hao et al., 2011) concentrations such as in manure, because of the less sensi-tive character of hydrogen-utilizing methanogens to inhibi-tion. Little is known about the active microorganisms in manure storage tanks. In a recent research study, we found that hydrogenotrophic Methanoculleus spp. were the main contributors to methanogenesis during long-term anoxic incubations of swine manure samples from two storage tanks collected at one date (Barret et al., 2012). In the present paper, we show that Methanoculleus spp. represented the main contributors to methanogenesis not only in swine but also in dairy manures, in a large number of samples and in environ-mental conditions that were similar to the in situ ones. More is known about the active methanogenic archaea in controlled
and engineered ecosystems. In continuous bioreactors treat-ing a wide range of organic wastes, acetoclastic Methanosaeta spp. and Methanosarcina spp. have been usually found to predominate, with Methanosarcina sp. being favoured at rela-tively high ammonia (2e4 gN/L) and VFA (0.5e3.5 geq.acetate/L)
levels, as found when manure is treated (Tabatabaei et al., 2010). In addition, the hydrogenotrophic pathway from acetate oxidation (Karakashev et al., 2006; Schnu¨rer and Nordberg, 2008) and the Methanoculleus genus were shown to be predominant in reactors fed with liquid swine manure (Zhu et al., 2011) as well as with mixtures of swine manure and/or cattle manure with other agricultural wastes (Nettmann et al., 2010). Our results thus show that Methanoculleus spp. and possibly Methanosarcina spp. would be active in storage facili-ties, as this is the case in controlled and engineered systems.
Conclusion
In this study, we showed that both physico-chemical and microbiological parameters influenced the methanogenic activity of manures, which highlights the relevance of a multi-disciplinary approach when studying manure storage tanks. One important outcome is that Methanoculleus spp. and possibly Methanosarcinaspp. would be major contributors to methano-genesis in swine and dairy storage tanks. The identification of the most influential variables is a first step in addressing the issue of GHG emissions linked with manure management. More research is needed to specifically elucidate the mecha-nisms in which they are involved. In the future, these key parameters could be used as endpoints to monitor mechanisms that govern carbon flow through the anaerobic degradation.
Acknowledgements
This work was financially supported by Agriculture and Agri-Food Canada under the Sustainable Agriculture Environ-mental Systems (SAGES) research program. We thank J. Dubreuil and D. Deslauriers for technical assistance.
Appendix A. Supplementary data
Supplementary data related to this article can be found at
http://dx.doi.org/10.1016/j.watres.2012.10.047
r e f e r e n c e s
Angenent, L.T., Sung, S., Raskin, L., 2002. Methanogenic population dynamics during startup of a full-scale anaerobic sequencing batch reactor treating swine waste. Water Research 36 (18), 4648e4654.
Barret, M., Gagnon, N., Morissette, B., Topp, E., Kalmokoff, M., Brooks, S., Matias, F., Masse´, D., Masse, L., Talbot, G., 2012. Methanoculleusspp. as a biomarker of methanogenic activity in swine manure storage tanks. FEMS Microbiology Ecology 80 (2), 427e440.
Blain, D., Liang, C., MacDonald, D., 2010. National Inventory Report 1990e2008: Greenhouse Gas Sources and Sinks in Canada. Boopathy, R., Kulpa, C.F., 1994. Biotransformation of
2,4,6-trinitrotoluene (TNT) by a Methanococcus sp. (strain B) isolated from a lake sediment. Canadian Journal of Microbiology 40 (4), 273e278.
Cook, K.L., Rothrock, M.J., Lovanh, N., Sorrell, J.K., Loughrin, J.H., 2010. Spatial and temporal changes in the microbial
community in an anaerobic swine waste treatment lagoon. Anaerobe 16 (2), 74e82.
Dhaked, R.K., Waghmare, C.K., Alam, S.I., Kamboj, D.V., Singh, L., 2003. Effect of propionate toxicity on methanogenesis of night soil at psychrophilic temperature. Bioresource Technology 87 (3), 299e303.
Dufrene, M., Legendre, P., 1997. Species assemblages and indicator species: the need for a flexible asymmetrical approach. Ecological Monographs 67 (3), 345e366.
Durand, J.F., 2012. Partial least-squares regression: from linearity to nonlinear additive spline modeling. Available from:http:// jf-durand-pls.com/.
Gagnon, N., Barret, M., Topp, E., Kalmokoff, M., Masse´, D., Masse, L., Talbot, G., 2011. Novel fingerprinting technology to assess the diversity of methanogens. FEMS Microbiology Letters 325 (2), 115e122.
Gorris, L.G.M., van Deursen, J.M.A., van der Drift, C., Vogels, G.D., 1989. Inhibition of propionate degradation by acetate in methanogenic fluidized bed reactors. Biotechnology Letters 11 (1), 61e66. Griffiths, R.I., Whiteley, A.S., O’Donnell, A.G., Bailey, M.J., 2000.
Rapid method for coextraction of DNA and RNA from natural environments for analysis of ribosomal DNA- and rRNA-based microbial community composition. Applied and
Environmental Microbiology 66, 5488e5491.
Hao, L.P., Lu¨, F., He, P.J., Li, L., Shao, L.M., 2011. Predominant contribution of syntrophic acetate oxidation to thermophilic methane formation at high acetate concentrations.
Environmental Science and Technology 45 (2), 508e513. Karakashev, D., Batstone, D.J., Trably, E., Angelidaki, I., 2006.
Acetate oxidation is the dominant methanogenic pathway from acetate in absence of Methanosaetaceae. Applied and Environmental Microbiology 72 (7), 5138e5141.
Kim, H.B., Borewicz, K., White, B.A., Singer, R.S., Sreevatsan, S., Tu, Z.J., Isaacson, R.E., 2011. Longitudinal investigation of the age-related bacterial diversity in the feces of commercial pigs. Veterinary Microbiology 153 (1e2), 24e133.
Lai, M.C., Gunsalus, R.P., 1992. Glycine betaine and potassium ion are the major compatible solutes in the extremely halophilic Methanogen methanohalophilusstrain Z7302. Journal of Bacteriology 174 (22), 7474e7477.
Lai, M.C., Lin, C.C., Yu, P.H., Huang, Y.F., Chen, S.C., 2004. Methanocalculus chunghsingensissp. nov., isolated from an estuary and a marine fishpond in Taiwan. International Journal of Systematic and Evolutionary Microbiology 54 (1), 183e189.
Lovanh, N., Loughrin, J.H., Cook, K., Rothrock, M., Sistani, K., 2009. The effect of stratification and seasonal variability on the profile of an anaerobic swine waste treatment lagoon. Bioresource Technology 100 (15), 3706e3712.
Mamat, B., Roth, A., Grimm, C., Ermler, U., Tziatzios, C., Schubert, D., Thauer, R.K., Shima, S., 2002. Crystal structures and enzymatic properties of three formyltransferases from archaea: environmental adaptation and evolutionary relationship. Protein Science 11 (9), 2168e2178.
Martinez, J., Guiziou, F., Peu, P., Gueutier, V., 2003. Influence of treatment techniques for pig slurry on methane emissions during subsequent storage. Biosystems Engineering 85 (3), 347e354.
Masse´, D.I., Croteau, F., Patni, N.K., Masse, L., 2003. Methane emissions from dairy cow and swine manure slurries stored at 10#C and 15#C. Canadian Biosystems Engineering 45, 6.1e6.6.
Masse´, D.I., Masse, L., Claveau, S., Benchaar, C., Thomas, O., 2008. Methane emissions from manure storages. Transactions of the ASABE 51 (5), 1775e1781.
McCune, B., Grace, J.B., 2002. Analysis of Ecological Communities. M. S. Design, Oregon, USA.
McCune, B., Mefford, M.J., 1999. PC-ORD for Windows. Multivariate Analysis of Ecological Data.
Nettmann, E., Bergmann, I., Pramschu¨fer, S., Mundt, K., Plogsties, V., Herrmann, C., Klocke, M., 2010. Polyphasic analyses of methanogenic archaeal communities in agricultural biogas plants. Applied and Environmental Microbiology 76 (8), 2540e2548.
Park, K.H., Thompson, A.G., Marinier, M., Clark, K., Wagner-Riddle, C., 2006. Greenhouse gas emissions from stored liquid swine manure in a cold climate. Atmospheric Environment 40 (4), 618e627.
Petersen, S.O., Ambus, P., 2006. Methane oxidation in pig and cattle slurry storages, and effects of surface crust moisture and methane availability. Nutrient Cycling in Agroecosystems 74 (1), 1e11.
Peu, P., Bruge`re, H., Pourcher, A.M., Ke´roure´dan, M., Godon, J.J., Delgene`s, J.P., Dabert, P., 2006. Dynamics of a pig slurry microbial community during anaerobic storage and
management. Applied and Environmental Microbiology 72 (5), 3578e3585.
Roy, C.S., Talbot, G., Topp, E., Beaulieu, C., Palin, M.F., Masse´, D.I., 2009. Bacterial community dynamics in an anaerobic plug-flow type bioreactor treating swine manure. Water Research 43 (1), 21e32.
Schnu¨rer, A., Nordberg, A., 2008. Ammonia, a selective agent for methane production by syntrophic acetate oxidation at mesophilic temperature. Water Science Technology 57 (5), 735e740.
Schnu¨rer, A., Zellner, G., Svensson, B.H., 1999. Mesophilic syntrophic acetate oxidation during methane formation in biogas reactors. FEMS Microbiology Ecology 29 (3), 249e261. Sharpe, R.R., Harper, L.A., 1999. Methane emissions from an
anaerobic swine lagoon. Atmospheric Environment 33 (22), 3627e3633.
Snell-Castro, R., Godon, J.J., Delgene`s, J.P., Dabert, P., 2005. Characterisation of the microbial diversity in a pig manure storage pit using small subunit rDNA sequence analysis. FEMS Microbiology Ecology 52 (2), 229e242.
Tabatabaei, M., Rahim, R.A., Abdullah, N., Wright, A.D.G., Shirai, Y., Sakai, K., Sulaiman, A., Hassan, M.A., 2010. Importance of the methanogenic archaea populations in anaerobic wastewater treatments. Process Biochemistry 45 (8), 1214e1225.
Thauer, R.K., Kaster, A.K., Seedorf, H., Buckel, W., Hedderich, R., 2008. Methanogenic archaea: ecologically relevant differences in energy conservation. Nature Reviews Microbiology 6 (8), 579e591.
Whitehead, T.R., Cotta, M.A., 2001. Characterisation and comparison of microbial populations in swine faeces and manure storage pits by 16S rDNA gene sequence analyses. Anaerobe 7 (4), 181e187.
Wold, S., Martens, H., Wold, H., 1983. The multivariate calibration problem in chemistry solved by the PLS method. Ka˚gstro¨m, B., Ruhe, A. (Eds), Springer, Berlin/Heidelberg, 973: 286e293. Zhu, C., Zhang, J., Tang, Y., Zhengkai, X., Song, R., 2011. Diversity
of methanogenic archaea in a biogas reactor fed with swine feces as the mono-substrate by mcrA analysis. Microbiological Research 166 (1), 27e35.