HAL Id: hal-01787006
https://hal.archives-ouvertes.fr/hal-01787006
Submitted on 7 May 2018HAL is a multi-disciplinary open access archive for the deposit and dissemination of sci-entific research documents, whether they are pub-lished or not. The documents may come from teaching and research institutions in France or abroad, or from public or private research centers.
L’archive ouverte pluridisciplinaire HAL, est destinée au dépôt et à la diffusion de documents scientifiques de niveau recherche, publiés ou non, émanant des établissements d’enseignement et de recherche français ou étrangers, des laboratoires publics ou privés.
Atmospheric fluxes of soluble organic C, N, and P to the
Mediterranean Sea: Potential biogeochemical
implications in the surface layer
K. Djaoudi, France van Wambeke, A. Barani, S. Hélias Nunige, Richard
Sempere, E. Pulido-Villena
To cite this version:
K. Djaoudi, France van Wambeke, A. Barani, S. Hélias Nunige, Richard Sempere, et al.. Atmo-spheric fluxes of soluble organic C, N, and P to the Mediterranean Sea: Potential biogeochem-ical implications in the surface layer. Progress in Oceanography, Elsevier, 2018, 163, pp.59-69. �10.1016/j.pocean.2017.07.008�. �hal-01787006�
Atmospheric fluxes of soluble organic C, N, and P to the
1Mediterranean Sea: potential biogeochemical implications in the
2surface layer
3Djaoudi*, K., Van Wambeke, F., Barani, A., Hélias-Nunige, S., Sempéré, R., Pulido-Villena,
4
E.
5
Aix-Marseille Université, Mediterranean Institute of Oceanography (MIO) UMR 7294,
6
Université de Toulon, CNRS, IRD, France.
7 8
*Corresponding author. Tel: +33 4 86 09 05 36
9
*E-mail address: kahina.djaoudi@mio.osupytheas.fr
10
11 12 13
Progress in Oceanography, Elsevier, 2017, 10.1016/j.pocean.2017.07.008
14 15 16 17 18 19 20 21 22 23 24 25 26 27 28 1
Abstract
29Linking atmospheric deposition to marine carbon and nutrient cycle is hampered by the
30
lack of data on atmospheric fluxes of organic matter. To fill this gap, this study reports the
31
first quantification of atmospheric fluxes of soluble organic carbon (SOC), nitrogen (SON)
32
and phosphate (SOP) to the NW Mediterranean Sea. Simultaneous measurements of dissolved
33
organic carbon (DOC), dissolved organic nitrogen (DON) and dissolved organic phosphate
34
(DOP) in the surface mixed layer (SML) allowed estimating the potential contribution of
35
atmospheric fluxes to marine DOC, DON and DOP inventories. We found an annual
36
atmospheric flux of 59 mmol C m-2 year-1 for SOC, 16.4 mmol N m-2 year-1 for SON and 23.6
37
µmol P m-2 year-1 for SOP, with proportions of SON and SOP to total soluble nitrogen and
38
phosphate of 40% and 25%, respectively. Assuming these annual fluxes valid for the entire
39
western Mediterranean basin, atmospheric fluxes would be higher than DOC, DON and DOP
40
fluxes from the Rhône River by a factor of 6, 17 and 2, for C, N and P, respectively, which
41
highlights the importance of atmospheric deposition as a source of DOC, DON and DOP to
42
surface waters of the western Mediterranean Sea. Inventories of DOC, DON and DOP in the
43
surface mixed layer displayed similar trends over the study period with maximum values at
44
the end of the stratification period. DOP inventories contributed by 85 ± 11% to total
45
dissolved phosphate (TDP) pool and exhibited a labile fraction (LDOP) of 27 ± 19%. The
46
contribution of atmospheric SOC, SON and SOP to the DOC, DON and DOP pools in the
47
SML were estimated for the stratification period, and suggested a low contribution of SOC to
48
DOC pool (3%) and moderate contributions of both SON and SOP to DON (12%) and DOP
49
(4.5%) pools for this period of time, respectively. The labile fraction of SOP (LSOP) was
50
quantified throughout the sampling period and showed a high variability ranging from 0 to
51
97%. Atmospheric fluxes of LSOP contributed by 7% to LDOP pool and could sustain up to
52
8% of the heterotrophic prokaryotic phosphate demand in the SML of the NW Mediterranean
53
Sea during the stratification period. The results obtained in this study stress the need to
54
include atmospheric fluxes of organic matter in marine biogeochemical models to achieve a
55
more complete picture of carbon and nutrient cycle in the Mediterranean Sea.
56
Keywords: atmospheric deposition, organic carbon, organic nitrogen, organic
57
phosphate, C:N:P ratios, dissolved organic matter, Mediterranean Sea.
58
1. Introduction
59The oligotrophic regions cover a significant portion of the global ocean (60%) [Eppley
60
and Peterson, 1979]. These areas are characterized by low concentrations of surface nutrients
61
because of strong stratification and low upward supply of nutrients. In the surface layer, the
62
pool of dissolved organic matter (DOM) plays an important role in maintaining the biological
63
activity as it’s an important source of energy and nutrient [Sandberg et al., 2004]. The
64
concentration of dissolved organic nitrogen (DON) and phosphate (DOP) exceed those of
65
inorganic nutrients by an order of magnitude [Bronk, 2002; Lomas et al., 2010] and can serve
66
as nitrogen and phosphate source for microbial growth [Sipler and Bronk, 2015 and
67
references therein; Karl and Björkman, 2015 and references therein]. The seasonal variability
68
of dissolved organic carbon (DOC) in the euphotic zone has been recorded in the subtropical
69
and temperate areas of the ocean [Carlson et al., 1994; Santinelli et al., 2013]. The lag time
70
between DOC production and consumption, causes DOC accumulation in the upper layers
71
[Carlson et al., 1994; Thingstad et al., 1997; Santinelli et al., 2013]. Part of the DOC which is
72
accumulated in the surface layer is exported to the deep by diffusion and/or due to both deep
73
water formation and winter vertical mixing constituting an important pathway for the export
74
of carbon from the surface to the deep ocean [Letcher and Moore, 2015]. At the global ocean,
75
DOM provides of about 20% of global export production [Hansell et al., 2009]. In addition,
76
the elemental ratios of the DOM pool deviate widely from the Redfield ratio being enriched
77
on C in comparison to N and P which suggests a higher carbon export efficiency compared to
78
particulate organic matter [Church and Ducklow, 2002; Hopkinson and Vallino, 2005].
79
Accurate quantification of DOM sources is needed to achieve a complete picture of C
80
and nutrient cycle in the oligotrophic ocean. In the open ocean, DOM pool is produced mainly
81
by the biological activity in the euphotic layer [Carlson and Hansell, 2015 and references
82
therein]. The microbial activity has been identified to be involved in recalcitrant DOM
83
(RDOM) generation [Taylor et al., 1985; Brophy and Carlson, 1989; Jiao et al., 2010] which
84
can persist in the ocean for millennia and is therefore a reservoir for carbon storage in the
85
ocean [Jiao et al., 2010, 2014]. Besides local production, external sources may contribute
86
significantly to the DOM pool. River flux from land to ocean is an important source of DOM
87
to marine environment, at the scale of the global ocean [Meybeck, 1982] and of the
88
Mediterranean Sea [Ludwig et al., 2009; Panagiotopoulos et al., 2012; Ferreto et al., 2017]. In
89
open waters, where there is little riverine input, groundwater discharge or sediment
90
resuspension, atmospheric deposition becomes a significant source of elements to the surface
91
ocean [Jickells et al., 2005]. However, to date, most measurements of atmospheric deposition
92
to the open ocean have focused on the inorganic fraction [e.g. Duce et al., 1991; Zhang et al.,
93
2010; Guieu et al., 2014] and data on atmospheric fluxes of organic matter to the open ocean
94
are scarce [e.g. Kanakidou et al., 2012] biasing our knowledge on the biogeochemical role of
95
atmospheric deposition in the surface ocean. And yet, the quantification of the atmospheric
96
flux of organic matter could be important since the anthropic emissions of N and P have been
97
enhanced greatly by demographic growth, industrialization, and agricultural intensification.
98
Anthropogenic reactive nitrogen production including inorganic reduced forms of nitrogen
99
(e.g. NH3, NH4+), inorganic oxidized forms (e.g. NOx, HNO3, N2O, NO3) and organic
100
compounds (e.g. urea, amines, proteins, nucleic acids) could reach 270 T g N yr-1 in 2050
101
[Galloway et al., 2004]. Similarly, P mobilization rose from about 50 Mt P yr-1in preindustrial
102
time to 155 Mt P yr-1 in 2000 [Smil, 2000]. In that context of increasing anthropic emissions
103
in the atmosphere, including variable components of organic matter, it seems important to
104
assess how atmospheric organic matter fluxes could influence the biogeochemistry of DOM
105
in ocean surface waters with consequences on carbon export.
106
The Mediterranean Sea is an oceanic basin representative of an enclosed mini-ocean. Its
107
own conveyer belt and fast circulation times compared to open ocean make it highly reactive
108
to external forcing particularly matter fluxes at the interfaces [Mermex group, 2011 and
109
references therein]. The Mediterranean Sea is of oligotrophic character due, among others, to
110
a pronounced thermal stratification occurring especially during the summer period which
111
delimits a depleted nutrients surface layer from the deeper [Moutin and Raimbault, 2002;
112
Pulido-Villena et al., 2010]. During the stratification period, both autotrophic and
113
heterotrophic prokaryotic activities are P-limited [Thingstad et al., 1998; Van Wambeke et al.,
114
2002]. Nutrient limitation has been hypothesized to enhance DOC accumulation during the
115
stratification period in the Mediterranean Sea [Thingstad et al., 1997]. In this oceanic region,
116
DOC fluxes play a crucial role in the supply of fresh carbon to the deep water [Ramondenec
117
et al., 2016] both through vertical winter mixing and deep-water formation. In situ
118
measurements estimate that DOC export fluxes are greater or similar than the mean export of
119
POC [Santinelli, 2015 and references therein]. Similarly, a recent modelling study based on
120
varying C:P quotas of planktonic cells, estimated that DOC is responsible of 64% and 90% of
121
the carbon export in the western and eastern Mediterranean basin, respectively [Guyennon et
122
al., 2015]. The Mediterranean Sea is subjected to continuous atmospheric fluxes of
123
anthropogenic sources. Moreover, it receives a noticeable flux of dust from arid regions of
124
North Africa, in the form of strong pulses [Guerzoni et al., 1999], as well as seasonal inputs
125
from biomass burning [Mermex group, 2011 and references therein]. The supply of new
126
nutrients to the Mediterranean Sea from atmospheric deposition and their impact on the
127
activity of phytoplankton and heterotrophic prokaryotes have been extensively addressed
128
[Ridame and Guieu, 2002; Pulido-Villena et al., 2008; Marin et al., 2017]. In contrast, little
129
attention has been paid to the organic fraction of atmospheric deposition precluding the
130
evaluation of its biogeochemical role in the Mediterranean Sea [e.g. Pulido-Villena et al.,
131
2008; Markaki et al., 2010; Sanchez-Pérez et al., 2016].
132
The aims of this study were to quantify atmospheric fluxes of soluble organic carbon
133
(SOC), nitrogen (SON), and phosphate (SOP) and to estimate the relative contribution of this
134
external source to the inventory of the surface DOC, DON and DOP pools in the NW
135
Mediterranean Sea during the stratification period. For this purpose, we coupled field
136
observations of atmospheric deposition of SOC, SON, and SOP and of DOC, DON and DOP
137
dynamics in the marine surface layer.
138
2. Material and Methods
1392.1. Atmospheric deposition sampling
140
Bulk atmospheric deposition (dry plus wet deposition) was sampled twice a month at
141
Frioul Island (43.26° N 05.29° E) in Marseille Bay in the NW Mediterranean Sea (Fig. 1)
142
from February 2015 to July 2016. The collector was set up on a cliff at 40 m above sea level
143
and consisted on an open funnel (314 cm2) connected to a sampling HDPE bottle (2 L) with a
144
nylon membrane (40 µm) in the neck of the funnel preventing contamination from plants,
145
debris and insects. The height of the collector was 2 m above the ground level. Prior to
146
sampling, the collector was cleaned with 10% hydrochloric acid solution and ultrapure water.
147
Every sampling day, the collector was recovered and transferred to the laboratory in a clean
148
plastic bag. Under a laminar flow hood, the inner walls of the funnel were rinsed with 100 mL
149
of ultrapure water after having removed debris deposited on the nylon membrane by means of
150
a plastic clamp. The volume of the rainfall was then determined by the difference in the
151
weight of the sampling bottle before and after sampling to which the volume of ultrapure
152
water added to rinse the funnel was subtracted. If the sample volume collected was less than
153
600 mL (volume needed to perform all analysis), this one was made up to 600 mL with
154
ultrapure water. Two hundred mL were filtered through a pre-weighed GF/F filter for the
155
determination of particulate matter content as dry weight (60°C, 24h). The remaining volume
156
(400 mL) was filtered through a pre-cleaned (10% HCl + ultrapure water) 0.2 µm
157
polycarbonate filter for chemical analyses.
158
2.2. Seawater sampling
159
Seawater was sampled monthly between April 2015 to June 2016 on board the R / V
160
Tethys II at the permanent time series MOOSE ANTARES offshore station (42.81° N, 6.79°
161
E). Due to unfavorable weather conditions, samplings on November 2015 and between
162
January and March 2016 could not be conducted. Seawater samples were collected at 4 to 7
163
depths between the surface and 200 m from the Niskin bottles for dissolved organic carbon
164
(DOC), dissolved organic nitrogen (DON), dissolved organic phosphate (DOP), labile
165
dissolved organic phosphorus (LDOP), heterotrophic prokaryotic abundance (HPA),
166
heterotrophic prokaryotic production (HPP), and community respiration (CR). Data on in situ
167
temperature, salinity, oxygen concentrations, and fluorescence were also collected from a
168
SeaBird CTD. For DOM measurements, seawater samples were filtered on board through
pre-169
cleaned (10 % HCl + ultrapure water) 0.2 µm pore size polycarbonate filters and were kept
170
frozen until analysis. Samples were collected in duplicate into acid washed HDPE 60 mL
171
bottles.
172
For heterotrophic prokaryotic abundance (HPA), heterotrophic prokaryotic production
173
(HPP) and community respiration (CR) unfiltered seawater was sampled. For HPA, duplicate
174
subsamples (1.8 mL) were collected, fixed with 200 µl of paraformaldehyde (20 %), kept at
175
ambient temperature for 15 min, placed in the freezer (-20 °C) available on board, and then
176
stored at -80 °C in the laboratory until analysis. For CR, samples were siphoned directly from
177
the Niskin bottle into eight oxygen bottles. Four bottles from each depth were immediately
178
fixed with Winkler reagents, and the remaining bottles were incubated 24 h in the dark in a
179
tap water bath to minimize temperature variation.
180
2.3. Analytical methods
181
DOC was measured using a Shimadzu (Model TOC-V total) carbon analyzer with a
182
quartz combustion column filled with 1.2% Pt on silica pillows (Sempéré et al., 2008). Prior
183
to analysis, samples were acidified with a few drops of orthophosphoric acid (H3PO4, 85%).
184
The daily calibration curve was based on 5 (0, 50, 100, 150 and 300 µM) and 4 (0, 50, 100
185
and 150 µM) standard solutions of potassium acid phthalate (1000 ng L-1) for atmospheric
186
SOC and marine DOC, respectively. One hundred µl of sample were injected between 3 and 5
187
times for each sample and standard. The analytical precision of the procedure, based on 3 to 5
188
injection and analyses of the same sample, was 1.5% on average. The accuracy of the
189
instrument and the system blank were determined by analyzing reference materials (D.
190
Hansell, Rosenstiel School of Marine and Atmospheric Science, Miami, USA), including the
191
Deep Seawater reference (DSR) and low carbon water (LCW) reference materials. The
192
average DOC concentrations in the DSR and LCW reference standards were 45 ± 2 µM C, n=
193
24 and 1 ± 0.3 µM C, n= 24, respectively. Batch number references were Batch#15,
Lot#01-194
15 for DSR and Lot#12-01-B2 for LCW.
195
DON and DOP concentrations were estimated from the difference between two
196
determinations of dissolved inorganic nitrogen (DIN) and phosphate (SRP for soluble reactive
197
phosphate). The first determination took place after hydrolysis of the sample (total dissolved
198
nitrogen and phosphate, TDN and TDP) and the second one on non- hydrolyzed sample (DIN
199
and SRP). DIN and TDN in both atmospheric and marine samples were analyzed by
200
continuous flow according to Aminot and Kerouel (2007) using a Technicon autoanalyser
201
with an estimated accuracy of 20 nM. TDN was analyzed after persulfate wet-oxidation
202
[Pujo-Pay et al., 1997]. For atmospheric samples, SRP and TDP were analyzed
203
spectrophotometrically on a 10-cm cell after Murphy and Riley (1962) method. TDP was
204
obtained after UV digestion [Armstrong et al., 1966]. For marine samples, due to low
205
concentrations expected, SRP and TDP were analyzed spectrophotometrically by using a long
206
waveguide capillary cell (LWCC) according to Pulido-Villena et al. (2010). The LWCC was
207
2.5 m long and the limit of detection, estimated as three times the standard deviation of 10
208
measurements of the blank was 0.8 nM. The labile fraction of DOP in marine (LDOP) and
209
atmospheric samples (LSOP) was obtained after an enzymatic hydrolysis with alkaline
210
phosphatase (AP) from Esherichia Coli [Feuillade and Dorioz., 1992; Suzumura et al., 2012;
211
Hashihama et al., 2013]. The AP was diluted with pure water to prepare a working AP
212
solution of 0.2 U mL-1. Equal volumes (0.6 mL) of AP working solution and Tris buffer (0.5
213
M) were added to 30 mL of the sample. Samples were incubated during 3 hours in the dark at
214
a temperature between 25 and 30 °C before phosphate concentration analysis. The duration of
215
the incubation was checked with glucose 6-phosphate in the same conditions of the sample to
216
determine if this duration was sufficient to achieve the whole DOP hydrolysis. To assess any
217
contamination, phosphate concentration was measured in 30 mL of milli-Q water in which 0.6
218
mL of working AP and Tris buffer were introduced.
219
Heterotrophic prokaryotic abundance (HPA) counts were performed by cytometry with
220
a FACSCalibur at the MIO-PRECYM flow cytometry platform. Heterotrophic prokaryotic
221
cells were stained with SYBR Green II (Molecular Probes) 1:10 diluted for 15 minutes in the
222
dark at ambient temperature, and were detected by their signature in a plot of side scatter
223
(SCC) versus FLI (green fluorescence). Cells were characterized by 2 main optical signals
224
collected from the 488 nm laser: side scatter (SSC, related to cell structure) and green
225
fluorescence (530/488 nm), related to nucleic acids staining. Regions were established on the
226
SSC versus green fluorescence plot in order to discriminate cells with high nucleic acid
227
(HNA) content from cells with low nucleic acid (LNA) content. Abundance of heterotrophic
228
prokaryotic cells were determined for each subgroup.
229
Heterotrophic prokaryotic production (HPP) was estimated using the 3H-leucine
230
incorporation method [Kirchman et al., 1993], adapted with the centrifuge method [Smith and
231
Azam, 1992]. Triplicate aliquots of 1.5 mL were taken for each depth plus one trichloacetic
232
acid (TCA, 5% final) control. The Leucine tracer was used at 20 nM final concentration (with
233
a mix of 14 nM hot leucine (L-[3H] leucine, Perkin Elmer® specific activity 106 Ci mmol–1)
234
and 6 nM cold leucine) in incubation lasting 2 hours in the dark. The incorporation of Leucine
235
was stopped with the addition of TCA (5% final concentration), then, they were kept at - 4°C
236
until analysis (within few days). After three runs of centrifugation/aspiration of the
237
supernatant (once with the fixed sea water sample, once with a 5 % TCA rinse, once with an
238
80 % ethanol rinse), the pellet was resuspended in Scintillation liquid. We used the standard
239
conversion factors of 1.5 kg C mol Leu-1 [Kirchman et al., 1993], assuming no isotopic
240
dilution as checked occasionally from concentration kinetics.
241
Community respiration (CR) was determined from the decrease in oxygen concentration
242
before and after incubation. O2 concentrations were measured following the Winkler method
243
[Carrit and Carpenter, 1966] and a respiratory quotient of 1 [Del Giorgio and Cole, 1998] was
244
applied to convert to C units. A minimum and maximum value of heterotrophic prokaryotic
245
respiration (HPR) was estimated by multiplying the CR by 33% and 78% which represent the
246
range of the contribution of HPR to CR in the NW Mediterranean Sea [Lemée et al., 2002].
247
2.4. Experimental assessment of atmospheric SOC bioavailability
248
The bioavailability of atmospheric SOC was experimentally assessed on one sample of
249
atmospheric deposition collected on April 2016 during a Saharan dust event. A natural
250
inoculum of marine heterotrophic prokaryotes was added to sterile filtered rainwater. The
251
rainwater sample was filtered through 0.2 µm and adjusted to a marine salinity of 35 using
252
precombusted (450°C, 6 hours) NaCl cristals. A concentrated inoculum of marine
253
heterotrophic prokaryotes was prepared using surface marine water (5 m) collected at the
254
MOOSE ANTARES offshore site, which was subsequently filtered on board through a 40 µm
255
mesh plankton and then by a 0.8 µm Nuclepore polycarbonate filter. Finally, the heterotrophic
256
prokaryotes were concentrated 15 times from 1.5 L of the < 0.8 µm filtrate using a 0.2 µm
257
Nuclepore polycarbonate filter. At the end of the filtration, a volume of 100 mL of the
258
supernatant was recovered with the 0.2 µm filter and was sonicated during 5 mn in order to
259
recover heterotrophic prokaryotes attached to the filter. The objective of this concentration
260
approach was to limit the amount of DOC added with the inoculum which allowed setting the
261
DOC contained in rainwater as the main C source in the incubations. HPA and HPP of the
262
inoculum were 1.6 x 10⁶ cells mL-1 and 126 ng C L-1 h-1, respectively, indicating that the
263
procedure did not seem to affect the vitality of the heterotrophic prokaryote community.
264
Controls consisted of ultrapure water adjusted to a salinity of 35 in which the same inoculum
265
of heterotrophic prokaryotes were added. The experimental bottles were incubated in the dark
266
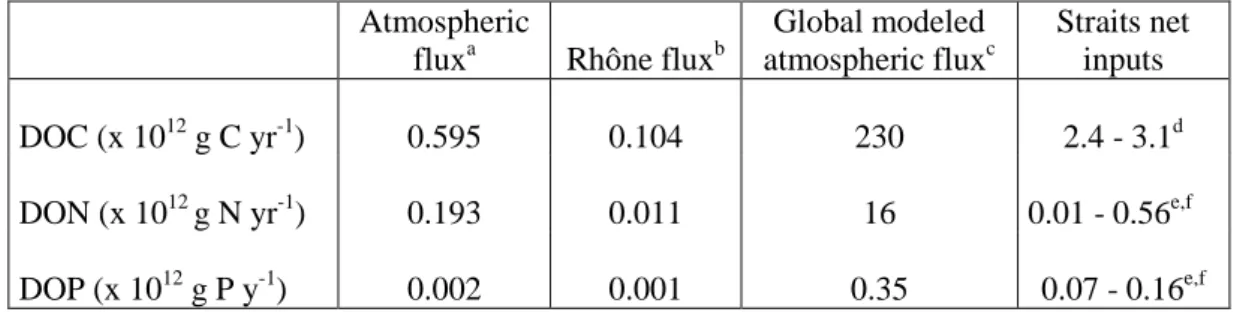
at controlled temperature during 11 days. The experiment was run in triplicate. Subsamples
267
were taken at selected times during the incubation for the determination of HPA, HPP and
268
DOC.
269
The percentage of the labile SOC (LSOC) was calculated as:
270 𝐿𝐿𝐿𝐿𝐿𝐿𝐿𝐿 (%) =[𝑆𝑆𝑆𝑆𝑆𝑆]𝑖𝑖𝑖𝑖𝑖𝑖𝑖𝑖𝑖𝑖𝑖𝑖𝑖𝑖−[𝑆𝑆𝑆𝑆𝑆𝑆]𝑓𝑓𝑖𝑖𝑖𝑖𝑖𝑖𝑖𝑖 [𝑆𝑆𝑆𝑆𝑆𝑆]𝑖𝑖𝑖𝑖𝑖𝑖𝑖𝑖𝑖𝑖𝑖𝑖𝑖𝑖 𝑥𝑥 100. 271 2.5. Calculations 272
2.5.1. Air-mass back trajectories
273
Five-day air-mass back trajectories were calculated at 500, 1000 and 3000 m asl for 274
each sampling date using the Hybrid Single-Particle Lagrangian Integrated Trajectories 275
(HYSPLIT) trajectory model (Draxler and G. Rolph, 2003, NOAA Air Resources Laboratory, 276
Silver Spring, Maryland, available at http://www.arl.noaa.gov/ready/hysplit4.html) provided 277
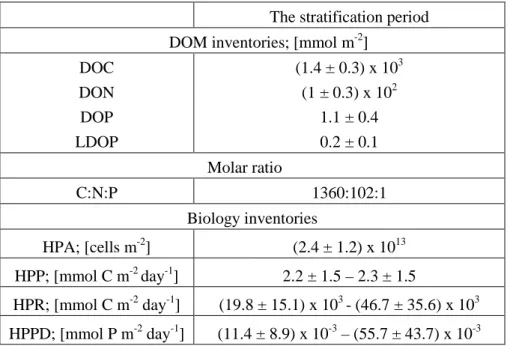
by the NOAA Air Resources Laboratory (ARL). 278
2.5.2. Heterotrophic prokaryotic phosphate demand (HPPD)
279
HPPD, i.e. the phosphate channeled through the heterotrophic prokaryotes, was
280
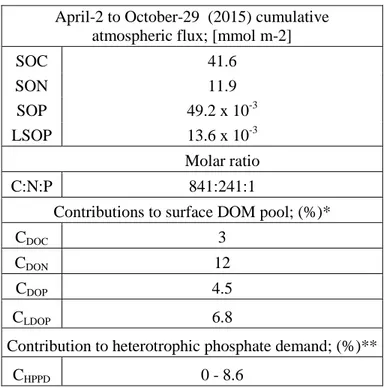
estimated by dividing the heterotrophic prokaryotic production (HPP) by the C:P ratio of
281
heterotrophic prokaryotic biomass provided in the literature for natural environments. A
282
conservative range of C:P ratios, between 29 (minimum value reported for oceanic bacteria in
283
nature, Cotner et al. 1997 and references therein) and 106 was used for this calculation.
284
For sampling dates lacking HPP measurements (between April and August 2015), HPP
285
was estimated from HPR (derived from CR) and heterotrophic prokaryotic growth efficiency
286
(HPGE). HPGE (%) was calculated for each sampling date where both HPP and HPR data
287
were available (Sep., Oct. and Dec. 2015, and from Apr. to Jun. 2016)
288
as, 𝐻𝐻𝐻𝐻𝐻𝐻 (𝐻𝐻𝐻𝐻𝐻𝐻 + 𝐻𝐻𝐻𝐻𝐻𝐻) 𝑥𝑥 100⁄ . For each sampling date, a minimum and maximum value of
289
HPGE was estimated corresponding to the minimum and maximum HPR calculated from
290
measured CR. Average HPGEmin was 4.7 ± 3.3% and average HPGEmax was 10.2 ± 6.5%.
291
2.5.3. Inventories in the surface mixed layer
292
The mixed layer depth for the marine sampling dates (running from April 2015 to June
293
2016) was determined following De Boyer Montegut et al. (2004) according to the depth
294
profiles of potential density and temperature. DOC, DON, DOP and biological inventories
295
were calculated for depth intervals in the MLD by vertical trapezoidal integration assuming
296
that the concentration at 0 m is the same as at 5 m:
297
� 𝑓𝑓(𝑥𝑥) = (𝑧𝑧2 − 𝑧𝑧1) [(𝑓𝑓(𝑧𝑧1) + 𝑓𝑓(𝑧𝑧2)) 2𝑧𝑧2 ⁄
𝑧𝑧1 ]
3. Results
2983.1. Atmospheric fluxes of soluble organic matter (SOM)
299
Between April 2015 and July 2016, atmospheric fluxes of soluble organic carbon (SOC)
300
ranged between 32 and 588 µmol C m-2 day-1 (Fig. 2A). Atmospheric fluxes of soluble
301
organic nitrogen (SON) ranged between 7 and 367 µmol N m-2 day-1 (Fig. 2B) and of soluble
302
organic phosphorus (SOP) between 0.01 and 0.59 µmol P m-2 day-1 (Fig. 2C). The
303
contribution of the organic fraction to the total soluble fluxes of nitrogen and phosphate
304
ranged between 12 and 83% (41 ± 14%) and between 4 and 57% (25 ± 14%), respectively.
305
The maximum atmospheric flux of soluble organic matter (SOM) was recorded during April
306
and May 2015 when 23% of both SOC and SON and 39% of SOP was deposited. During the
307
rest of the time-series, atmospheric fluxes of SOM were more homogeneous. Considering the
308
entire study period (n = 33), atmospheric fluxes of SOM were significantly related to
309
precipitation rates (r = 0.43, p < 0.01 for SOC, r = 0.66, p < 0.001 for SON and r = 0.38, p <
310
0.05 for SOP). No significant correlations were observed between atmospheric fluxes of SOM
311
and the atmospheric flux of particulate matter.
312
3.2. Bioavailability of soluble organic phosphate and carbon in atmospheric deposition
313
The atmospheric flux of labile soluble organic phosphate (LSOP) ranged from 0 to 0.28
314
µmol m-2 day-1 over the study period. The contribution of LSOP to the atmospheric flux of
315
SOP showed an important variation during the study period, ranging from 0 to 97% (44 ±
316
27%).
317
The labile fraction of soluble organic carbon (LSOC) in atmospheric deposition was
318
estimated only once, through a biodegradation experiment made on a rainwater sample
319
collected in April 2016 (see Material and Methods). In the control treatment, the
320
concentration of DOC at the beginning of the incubations was 7 µM and it remained constant
321
during the 11-day incubation. The heterotrophic prokaryote abundance (HPA) decreased over
322
the experiment and heterotrophic prokaryotic production (HPP) did not exceed 0.35 ng C L-1
323
h-1. In the rainwater treatment, the concentration of DOC at the beginning of the incubations
324
was 62 µM and it decreased by 18 ± 3 µM in eleven days which leads to a labile fraction of
325
29% at this time-scale. During the incubation period, HPA and HPP in the rainwater treatment
326
increased by 6.6 ± 3.3 x 10⁵ cells mL-1 and 221 ± 17 ng C L-1 h-1 respectively.
327
3.3. Dissolved organic matter (DOM) and heterotrophic prokaryotes in the surface layer
328
3.3.1. Depth profiles
329
Vertical profiles of DOC, dissolved organic nutrients (DON, DOP and LDOP),
330
dissolved inorganic nutrients (DIN and SRP) and biological activity (HPA, HPP and CR) for
331
all sampling dates are reported in figures S1 to S6. DOC concentration ranged between 39 µM
332
(June 2015 at 200 m) to 86 µM (June 2015 at 5 m). Overall, the depth profiles of DOC were
333
similar during the study period, presenting a slight decrease from the surface to 200 m (Fig.
334
S1). The depth profiles of DON and DOP presented quasi-constant concentrations between
335
the surface and 200 m. DON concentration ranged from 1 µM (August 2015 at 200 m) to a
336
maximum of 10 µM (July 2015) (Fig. S2). DOP concentration ranged between 24 nM (April
337
2016 at 5 m) to 130 nM (August 2015 at 200 m) (Fig. S3). LDOP ranged between 0 and 34
338
nM with maximum values observed above the pycnocline decreasing with depth to reach
339
minimal values at 200 m (Fig. S3). In contrast to DON and DOP, DIN and soluble reactive
340
phosphate (SRP) were low above the pycnocline, ranging from the detection limit to 0.34 µM
341
for DIN and between 2 and 47 nM for SRP. Concentrations increased with depth and reached
342
the highest values (8 µM for DIN and 300 nM for SRP) at 200 m (Fig. S4).
343
The abundance of heterotrophic prokaryotes (HPA) ranged between 3 and 18 x 105 cells
344
mL-1 throughout the study period (Fig. S5). The community respiration (CR) ranged from
345
non-detectable values to 0.5 µmol O2 Kg-1 day-1 (Fig. S5). Heterotrophic prokaryotic
346
production (HPP) data are available only from September 2015 and ranged from undetectable
347
values to 46 ng C L-1 h-1 (Fig. S6). Both HPA, HPP and CR showed higher values in surface
348
waters and a general decrease with depth.
349
3.3.2. Depth-integrated inventories
350
The integrated inventories DOC (mol m-2), DON (mol m-2), DOP and LDOP (mmol
351
m-2) in the surface mixed layer (SML) displayed similar trends during the marine sampling
352
dates with maximum inventories observed in December 2015 (Fig. 3). Over the study period,
353
SML inventories of DOC ranged between 1.0 and 2.3 mol m-2 (Fig. 3A). SML inventories of
354
DON and DOP ranged between 0 and 0.2 mol m-2 (Fig. 3B) and between 0.5 and 2.1 mmol m
-355
2
(Fig. 3C), respectively. DON and DOP contributed of 98 ± 2% and of 85 ± 11% for TDN
356
and TDP in the SML over the study period, respectively. Inventories of LDOP ranged
357
between 0.14 and 1.02 mmol m-2 in the SML (Fig. 3C) and, on average, contributed by 27 ±
358
19% to the DOP pool.
359
3.4. C:N:P molar ratios in atmospheric SOM and marine DOM
360
C:N molar ratios in atmospheric soluble organic matter (SOM) ranged between 1.6 and
361
10.5 (Fig. 4A) with an average value of 5.2 ± 2.3. Marine DOM showed higher C:N ratios,
362
ranging from 2 to 43 with an average of 13.8 ± 6.5. C:P ratios in atmospheric SOM ranged
363
between 352 and 4 200 with an average of 1 228 ± 849. Marine DOM C:P ratios were
364
generally of the same order of magnitude ranging from 326 to 2 850 with an average of 1 227
365
± 538 except for August and December 2015 when the C:P ratio was higher in atmospheric
366
deposition (Fig. 4B). N:P ratios in atmospheric SOM ranged between 55 to 2 013 with an
367
average value of 308 ± 349 and a maximum observed during October 2015. Marine DOM
368
N:P ratios were generally lower than in atmospheric SOM and evolved between 9 and 376
369
with an average value of 100 ± 55 (Fig. 4C).
370
4. Discussion
3714.1. Atmospheric fluxes
372
Very few data on atmospheric fluxes of SOC have been reported for the Mediterranean
373
Sea, in particular using frequent deposition data collected over at least one year
[Pulido-374
Villena et al., 2008; De Vicente et al., 2012]. The annual atmospheric flux of SOC obtained in
375
this study (59 mmol m-2 year-1) is slightly lower than reported in the Ligurian Sea (Cap Ferrat
376
site 129 mmol m-2 year-1) [Pulido-Villena et al., 2008] and in the southern Spain [De Vicente
377
et al., 2012]. Annual atmospheric flux of SOC in our study is higher than the atmospheric flux
378
(through dry deposition) estimated from the concentration of organic carbon in aerosols
379
collected in the Eastern Mediterranean Sea (Finokalia site: 15 mmol m-2 year-1) [Theodosi et
380
al., this issue]. The literature on atmospheric fluxes of SON and SOP to the Mediterranean
381
basin is also very limited. The annual atmospheric flux of SOP obtained in this study (69
382
µmol P m-2 year-1) is slightly higher than that reported by Migon and Sandroni (1999) (32
383
µmol P m-2 year-1) and lower than reported by Violaki et al. (this issue) (1160 and 940 µmol P
384
m-2 year-1 for the western and eastern basin, respectively). The average contributions of SON
385
and SOP to the total soluble nitrogen and phosphate (TSN, TSP) over the study period were
386
40% and 25%, respectively. The contribution of SON to TSN in our study was higher than
387
that previously observed by Markaki et al. (2010) while the contribution of SOP to TSP was
388
lower than those reported in the Mediterranean basin [Markaki et al., 2010; Violaki et al., this
389
issue]. Anyhow, given the few existing data, it is difficult to conclude if the observed
390
differences reflect a spatial or inter-annual variability or if they are caused by differences in
391
the sampling protocols and analytical methods.
392
To our knowledge, there are no reported measurements of atmospheric fluxes of SOC,
393
SON and SOP simultaneously, a single modelling study quantified these atmospheric fluxes
394
at the global ocean scale [Kanakidou et al., 2012]. For the first time, in this study, coupled
395
atmospheric fluxes of SOC, SON and SOP were quantified in the NW Mediterranean Sea.
396
Over the study period, atmospheric fluxes of SOC, SON and SOP were significantly
inter-397
correlated suggesting a common source and similar transport patterns. The atmospheric fluxes
398
of SOC, SON and SOP were significantly correlated with precipitation rates indicating a high
399
efficiency in atmospheric deposition of SOM via rain events in the NW Mediterranean Sea.
400
These rain events occurred in 80% of our sampling dates and showed important amplitude of
401
variability (between 0.4 and 47 mm). Hereafter, to get further insight on factors controlling
402
the observed atmospheric fluxes of SOM, we have discriminated sampling dates presenting
403
precipitation rates higher than 10 mm from the rest of sampling. Precipitation rates higher
404
than 10 mm were recorded in 8 out of 33 sampling dates. In these samples, differences in
405
SOM atmospheric fluxes observed may be attributable to the differences in rain amount. The
406
maximum atmospheric flux of soluble organic matter was observed during the rain event of
407
April 2015 (Fig. 2) and coincided with a maximum precipitation rate (47 mm during 15 days).
408
This agrees with the observations by Pan et al. (2010) who reported high atmospheric fluxes
409
of SOC coinciding with important rain events in Northern China. However, two other rainfall
410
events of the same magnitude (32 and 37 mm during 15 days) were not accompanied by such
411
a significant atmospheric flux of SOM, suggesting that other factors than rain amount
412
controlled the magnitude of atmospheric flux of SOM in the study area. Back trajectories
413
showed air masses coming from the North for the rain event of April 2015 whereas they came
414
from the West and East during the rainfall of September 2015 and from the South with a
415
Saharan influence for the rainfall of April 2016. These observations suggest that the
416
maximum atmospheric fluxes of SOC, SON and SOP in the NW Mediterranean Sea result
417
from a combination of an anthropogenic influence and an important precipitation rate. Indeed,
418
anthropogenic emissions are known to enhance the presence of organic aerosols in the
419
atmosphere [Kanakidou et al., 2000; 2005; Sempéré and Kawamura, 2003]. In the opposite,
420
the minimum atmospheric flux of SOC, SON and SOP coincided with the rain event of April
421
2016, suggesting that atmospheric fluxes with a desert signature are poorly enriched in
422
soluble organic matter. This observation contrasts with Pulido-Villena et al. (2008) who
423
reported a maximum atmospheric flux of dissolved organic carbon coinciding with a Saharan
424
dust event. The Saharan dust event reported in Pulido-Villena et al. (2008) delivered a much
425
higher particle flux (215 mg m-2 day-1) than that reported in our study (5.2 mg m-2 day-1). The
426
high SOC flux observed by Pulido-Villena et al. (2008) was perhaps a result of heterogeneous
427
reactions between organic compounds and mineral dust in the troposphere (Usher et al. 2003
428
and references therein).
429
4.2. Marine dissolved organic matter (DOM)
430
To date, technical limitations have dramatically constrained the data coverage on DOP
431
concentration in surface waters of the Mediterranean Sea. Indeed, the quantitative estimation
432
of DOP relies upon an accurate measurement of SRP concentration, which is below the
433
detection limit given by the conventional colorimetric method (20 nM) in the surface layer
434
during most part of the year [Moutin and Raimbault, 2002; Pulido-Villena et al., 2010]. In this
435
study, an alternative high sensitive SRP analysis method, involving the Long Wave Guide
436
Capillary Cell (LWCC), was applied allowing to get accurate measurements of SRP
437
concentration and, thus, of DOP in the NW Mediterranean area. Therefore, this study
438
provides the first complete dataset on the temporal variation of DOC, DON, DOP and LDOP
439
concentration in surface waters of the NW Mediterranean Sea.
440
DOC concentrations obtained over the study period are consistent with values reported
441
for surface waters of the NW Mediterranean Sea [Avril, 2002; Pujo-Pay et al., 2011] as well
442
as for the other parts of the Mediterranean Sea [Sempéré et al, 2002; 2003; Pujo-Pay et al.,
443
2011; Santinelli et al., 2012]. Likewise, DON concentrations reported in this study are in good
444
agreement with previously reported data in the Mediterranean Sea [Diaz et al., 2001;
Pujo-445
Pay et al., 2011]. DOP concentrations above the pycnocline ranged between 25 and 78 nM
446
with an average of 52 nM compared to few nanomoles of SRP. These concentrations compare
447
well with DOP concentrations measured in the Eastern Mediterranean Sea using the same
448
technology [Krom et al., 2005]. LDOP concentrations were in the same range as SRP
449
concentrations in upper waters. However, the increase of SRP concentration below the
450
pycnocline was not accompanied by an increase of the LDOP concentration in agreement
451
with the observations by Hashihama et al. (2013) in the oligotrophic western North Pacific
452
and East China Sea. This suggests that LDOP was still actively hydrolyzed below the
453
pycnocline despite the high concentration of SRP. The elevated DOC concentrations in the
454
upper waters and the slight decrease observed with increasing depth could suggest a net
455
accumulation of carbon in the surface layer. The net accumulation of organic carbon is the
456
difference between sources and sinks which are mainly attributed to biological processes in
457
the marine environments. Phytoplankton activity and their grazer’s or viruses activity are
458
considered as the main primary DOM sources in the euphotic layer [Carlson and Hansell,
459
2015 and reference therein)]. The quasi-constant DON and DOP profile between the surface
460
and 200 m observed in our study, could suggest a balance between production/consumption
461
and import/export processes of both DON and DOP.
462
Concerning the integrated DOM inventories in the SML (Fig. 3), DOC, DON and DOP
463
followed the same trend over the study period suggesting a control through common
464
processes. The maximum integrated inventories were observed during December 2015 which
465
suggests an accumulation at the end of the stratification period (Fig.3A, B and C). DON and
466
DOP contributions to the TDN and TDP are important in the SML over the study period and
467
are in good agreement with reported literature data in the Mediterranean Sea [Moutin and
468
Raimbault, 2002; Santinelli et al., 2012]. The labile fraction of DOP (LDOP) also contributed
469
significantly (27 ± 19%) to the SML DOP pool over the study period. This contribution was
470
higher than that observed in the oligotrophic Western Pacific and Eastern China (12 ± 7%)
471
[Haschiama et al., 2013].Contrarily to DOP, LDOP did not accumulate at the end of the
472
stratification period and could therefore sustain the autotrophic and heterotrophic activity in
473
the P-depleted uppers waters of the NW Mediterranean Sea.
474
4.3. Elemental ratios in both atmospheric SOM and marine DOM
475
C:N:P ratios of SOM in atmospheric deposition did not show a seasonal pattern, but
476
seemed rather to be related to a punctual dominance of the atmospheric flux of one of the
477
three elements. Except for a few sampling dates, C:N:P ratios displayed relatively constant
478
values. For example, the average C:N ratio was higher between April and September (2015)
479
(Fig. 4A), linked to the high SOC fluxes. C:N ratios obtained in this study were in good
480
agreement with C:N ratios of water soluble fraction of aerosols reported in both northern and
481
southern Pacific (Sempéré and Kawamura, 2003). At the opposite, for C:P ratios, two
482
sampling date deviates from the mean (Fig. 4B) but in this case linked to very low fluxes of
483
SOP rather than deviations in SOC flux. Finally, the N:P ratio showed two maximum values
484
linked to the lowest fluxes of SOP (Fig. 4C). The N:P ratios were, in average, higher in the
485
organic fraction (308 ± 349) than in the inorganic fraction (175 ± 234) and were of the same
486
order of magnitude as previously reported [Krom et al., 2004; Markaki et al., 2010].
487
The precise quantification of DOP concentration above 2 nM using the LWCC
488
technique, allowed assessing for the first time the temporal variability in elemental C:N:P
489
ratios of DOM above the pycnocline in the NW Mediterranean Sea. C:N, C:P and N:P
490
showed average values over the study period of 13 ± 3, 1 430 ± 410 and 112 ± 47,
491
respectively, without any seasonal trend. Elemental ratios of marine DOM showed different
492
values, in average, than atmospheric deposition of SOM. Indeed, C:N ratios of marine DOM
493
were somewhat higher than in atmospheric SOM while N:P ratios were higher in atmospheric
494
deposition due to high atmospheric fluxes of SON. The lack of signature of atmospheric
495
deposition in C:N:P ratios of marine DOM could suggest a quick transformation of
496
atmospheric SOM in the upper waters. C:N:P ratios in atmospheric deposition may thus affect
497
C:N:P ratios in DOM above the pycnocline, but it is difficult to establish a direct link on one
498
year of data. The incorporation of the data obtained in this study into ocean biogeochemical
499
models would certainly help to get further insight on the contribution of atmospheric
500
deposition on elemental ratios of DOM.
501
4.4. Potential biogeochemical implications of atmospheric fluxes of SOM
502
Assuming ranges obtained in this study for atmospheric fluxes valid for the whole
503
western Mediterranean Sea, annual atmospheric fluxes of SOC, SON and SOP represent
504
0.2%, 1.2% and 0.5% of modelled atmospheric flux of SOM at the global ocean scale
505
(Kanakidou et al., 2012, Table 1). A comparison with the major input fluxes of DOM to the
506
Western Mediterranean Sea (rivers and straits) highlights that annual atmospheric fluxes of
507
carbon can account for 20 to 25% of the net inputs trough Gibraltar and Sicily straits while
508
annual atmospheric fluxes of nitrogen are in the same order of magnitude. Annual
509
atmospheric flux of organic phosphate was lower than straits net inputs, accounting between 1
510
and 3% of them (Table 1). In comparison to the Rhône river, which is the most affluent river
511
in the Mediterranean Sea, atmospheric fluxes of SOC, SON and SOP were higher than DOC,
512
DON and DOP fluxes delivered from that river by a factor of 6, 17 and 2 respectively (Table
513
1). These results highlight the need of accounting for atmospheric inputs, particularly in
514
biogeochemical models, in order to achieve an accurate budget of DOM in the Mediterranean
515
Sea.
516
One of the key points of our study is the simultaneous survey of atmospheric SOM
517
fluxes and marine DOM inventories which provides a direct quantification of the contribution
518
of the atmospheric SOM deposition to surface DOM pool. In this study, we choose to
519
quantify this contribution over the period from April 2015 to October 2015 which
520
corresponds to the stratification period, when the surface mixed layer (SML) was isolated
521
from the deep layers making the atmospheric deposition a major source. The contribution of
522
atmospheric SOM to the DOM pool in the SML during that period was calculated by dividing
523
the atmospheric cumulative integrated flux (Table 3) by the surface mixed layer DOM
524
inventories (Table 2) during that period. The contribution of atmospheric deposition of SOM
525
to the DOM pool during that period in the surface layer of the NW Mediterranean Sea were
526
low for SOC (3%), SOP (4.5%) and moderate for LSOP (7%) and SON (12%) (Table 3).
527
A better understanding of the role of atmospheric deposition of SOM relies on the
528
knowledge on its bioavailability. Previous studies examining the effects of atmospheric inputs
529
have focused on the inorganic fraction [Maranon et al., 2010; Pulido-Villena et al., 2014;
530
Herut et al., 2016]. The few reported studies on the bioavailability of atmospheric organic
531
matter concerned organic nitrogen [Timperley et al., 1985; Peierls and Paerl, 1997, Seitzinger
532
and Sanders, 1999; Seitzinger et al., 2002] and none of these studies took place in the
533
Mediterranean Sea. This study presents the first examination of the bioavailability of
534
atmospheric SOC and SOP to marine heterotrophic prokaryotes, and suggests that a
535
substantial fraction of atmospheric SOC (29% over 11-days period) and SOP (44 ± 27%)
536
would be bioavailable. The quantification of the labile fraction of SOP (LSOP) derived from
537
atmospheric deposition can have important consequences in the P-depleted Mediterranean
538
surface waters since marine heterotrophic prokaryotes could hydrolyze labile DOP to alleviate
539
P stress. Atmospheric LSOP being quantified over the study period, we have assessed its
540
potential contribution to the heterotrophic prokaryotic phosphate demand (HPPD, Table 2), in
541
the SML during the period between April and October 2015 (Table 3). The LSOP: HPPD
542
ratio was calculated by dividing minimal and maximal atmospheric fluxes by minimal and
543
maximal HPPD (Table 3) and suggested low to moderate contributions of LSOP to the
544
heterotrophic prokaryotic phosphate demand (Table 3). The atmospheric LSOC may
545
contribute also to the heterotrophic prokaryotic carbon demand (HPCD). However, to
546
estimate this contribution, the bioavailability of atmospheric samples of different origins at
547
different periods would be necessary.
548
5. Concluding Remarks
549This work provides a unique data set of simultaneous atmospheric fluxes of soluble
550
organic matter (SOM) and marine dissolved organic matter (DOM) inventories in the NW
551
Mediterranean Sea and leads to the following major conclusions: (1) A substantial fraction of
552
atmospheric deposition of nitrogen and phosphate to the Mediterranean Sea is in the form of
553
soluble organic matter accounting of 40% and 25%, respectively. (2) In the surface mixed
554
layer, DOP contributed by 85 ± 11% to TDP with 27 ± 19% of the DOP pool as LDOP. (3)
555
Atmospheric deposition is a significant source of soluble organic matter to upper waters of the
556
western Mediterranean Sea, greater than river input. (4) The direct contribution of
557
atmospheric deposition of SOM to surface DOM pool is low to moderate although further
558
research on its bioavailability is needed to understand its biogeochemical role in the NW
559
Mediterranean Sea. Overall, the results obtained in this study highlight the need of
560
incorporating atmospheric fluxes of SOM into biogeochemical models to better constrain the
561
DOM cycle in upper waters in oligotrophic regions such as the Mediterranean Sea.
562
Acknowledgments
563
This work is a contribution to the Labex OT-Med (n° ANR-11-LABX-0061) funded by
564
the French Government «Investissements d’Avenir» program of the French National Research
565
Agency (ANR) through the A*MIDEX project (n° ANR-11-IDEX-0001-02). This study was
566
conducted as part of the WP4 MERMEX/MISTRALS project and is a contribution to the
567
international SOLAS, IMBER and LOICZ programs. We would like to thank the MOOSE
568
project for the help in accessing the atmospheric and marine sampling sites, the captain and
569
the crew of R/V Tethys II for their cooperative work at sea, PRECYM flow cytometry
570
platform and Michel Fournier for the valuable assistance provided during the installation of
571
the collector of atmospheric bulk deposition.
572 573
References
574Aminot, A., Kérouel, R., 2004. Dissolved organic carbon, nitrogen and phosphorus in the N-E
575
Atlantic and the N-W Mediterranean with particular reference to non-refractory
576
fractions and degradation. Deep Sea Research Part I: Oceanographic Research Papers,
577
51, 1975-1999.
578
Aminot, A., Kérouel., R., 2007. Dosage automatique des nutriments dans les eaux marines:
579
méthodes en flux continu. Ed. Ifremer,méthode d’analyse en milieu marin, 188 p.
580
Armstrong, F.A.J., Williams, P.M., Strickland, J.D.H., 1966. Photo-oxidation of Organic
581
Matter in Sea Water by Ultra-violet Radiation, Analytical and Other Applications.
582
Nature, 211, 481-483.
583
Avril, B., 2002. DOC dynamics in the northwestern Mediterranean Sea (DYFAMED site).
584
Deep-Sea Research Part Ii-Topical Studies in Oceanography, 49, 2163-2182.
585
Bronk, D.A. (2002), Dynamics of DON, in Biogeochemistry of Marine Dissolved Organic
586
Matter, 1st ed., edited by D. A. Hansell and C. A. Carlson, pp.153–247, Academic
587
Press, San Diego, CA, doi:10.1016/B978-012323841-2/50007-5
588
Brophy, J.E., Carlson, D.J., 1989. Production of Biologically Refractory Dissolved
Organic-589
Carbon by Natural Seawater Microbial-Populations. Deep-Sea Research Part
a-590
Oceanographic Research Papers, 36, 497-507.
591
Carlson, C.A., Ducklow, H.W., Michaels, A.F., 1994. Annual flux of dissolved
organic-592
carbon from the euphotic zone in the Northwestern Sargasso Sea. Nature, 371, 405-408.
593
Carlson, C.A., Giovannoni, S.J., Hansell, D.A., Goldberg, S.J., Parsons, R., Otero, M.P.,
594
Vergin, K., Wheeler, B.R., 2002. Effect of nutrient amendments on bacterioplankton
595
production, community structure, and DOC utilization in the northwestern Sargasso
596
Sea. Aquatic Microbial Ecology, 30, 19-36.
597
Carlson, CA and Hansell, DA., 2015. DOM Sources, Sinks, Reactivity, and Budgets. In:
598
Dennis A. Hansell and Craig A. Carlson. (Eds.) Biogeochemistry of Marine Dissolved
599
Organic Matter. Academic Press. 579-608.
600
Carritt, D.E., Carpenter, J., 1966. Comparison and evaluation of currently employed
601
modifications of Winkler method for determining dissolved oxygen in seawater-a
602
NASCO Report. Journal of Marine Research, 24.
603
Church, M.J., Ducklow, H.W., Karl, D.M., 2002. Multiyear increases in dissolved organic
604
matter inventories at Station ALOHA in the North Pacific Subtropical Gyre. Limnology
605
and Oceanography, 47, 1-10.
606
Coste, B., Corre, P.L., Minas, H.J., 1988. Re-evaluation of the nutrient exchanges in the strait
607
of Gibraltar. Deep Sea Research Part A. Oceanographic Research Papers, 35, 767-775.
608
Cotner, J.B., J.W. Ammerman,E. R. Peele, and E. Bentzen, Phosphorus-limited
609
bacterioplankton growth in the Sargasso Sea, Aquatic Microbial Ecology, 13 (2), 141–
610
149, 1997.
611
Craig, A.C., Stephen, J.G., Dennis, A.H., Stuart, J.G., Rachel, P., Mark, P.O., Kevin, V.,
612
Benjamin, R.W., 2002. Effect of nutrient amendments on bacterioplankton production,
613
community structure, and DOC utilization in the northwestern Sargasso Sea. Aquatic
614
Microbial Ecology, 30, 19-36.
615
De Boyer Montégut, C., Madec, G., Fischer, A.S., Lazar, A., Iudicone, D., 2004. Mixed layer
616
depth over the global ocean: An examination of profile data and a profile-based
617
climatology. Journal of Geophysical Research: Oceans, 109, 1-20.
618
De Vicente, I., Ortega-Retuerta, E., Morales-Baquero, R., Reche, I., 2012. Contribution of
619
dust inputs to dissolved organic carbon and water transparency in Mediterranean
620
reservoirs. Biogeosciences, 9, 5049-5060.
621
Del Giorgio, P.A., Cole, J.J., 1998. Bacterial growth efficiency in natural aquatic systems.
622
Annual Review of Ecology and Systematics, 29, 503-541.
623
Diaz, F., Raimbault, P., Boudjellal, B., Garcia, N., Moutin, T., 2001. Early spring phosphorus
624
limitation of primary productivity in a NW Mediterranean coastal zone (Gulf of Lions).
625
Marine Ecology Progress Series, 211, 51-62.
626
Duce, R.A., Liss, P.S., Merrill, J.T., Atlas, E.L., Buat-Menard, P., Hicks, B.B., Miller, J.M.,
627
Prospero, J.M., Arimoto, R., Church, T.M., Ellis, W., Galloway, J.N., Hansen, L.,
628
Jickells, T.D., Knap, A.H., Reinhardt, K.H., Schneider, B., Soudine, A., Tokos, J.J.,
629
Tsunogai, S., Wollast, R., Zhou, M., 1991. The atmospheric input of trace species to the
630
world ocean. Global Biogeochemical Cycles, 5, 193-259.
631
Eppley, R.W., Peterson, B.J., 1979. Particulate Organic-Matter Flux and Planktonic New
632
Production in the Deep Ocean. Nature, 282, 677-680.
633
Ferretto, N., Tedetti, M., Guigue, C., Mounier, S., Raimbault, P., Goutx, M., 2017.
Spatio-634
temporal variability of fluorescent dissolved organic matter in the Rhne River delta and
635
the Fos-Marseille marine area (NW Mediterranean Sea, France). Environmental Science
636
and Pollution Research, 24, 4973-4989.
637
Feuillade, M., Dorioz, J.M., 1992. Enzymatic release of phosphate in sediments of various
638
origins. Water Research, 26, 1195-1201.
639
Galloway, J.N., Dentener, F.J., Capone, D.G., Boyer, E.W., Howarth, R.W., Seitzinger, S.P.,
640
Asner, G.P., Cleveland, C.C., Green, P.A., Holland, E.A., Karl, D.M., Michaels, A.F.,
641
Porter, J.H., Townsend, A.R., Vöosmarty, C.J., 2004. Nitrogen Cycles: Past, Present,
642
and Future. Biogeochemistry, 70, 153-226.
643
Gruber, D.F., Simjouw, J.P., Seitzinger, S.P., Taghon, G.L., 2006. Dynamics and
644
characterization of refractory dissolved organic matter produced by a pure bacterial
645
culture in an experimental predator-prey system. Applied and Environmental
646
Microbiology, 72, 4184-4191.
647
Guerzoni, S., Chester, R., Dulac, F., Herut, B., Loye-Pilot, M.D., Measures, C., Migon, C.,
648
Molinaroli, E., Moulin, C., Rossini, P., Saydam, C., Soudine, A., Ziveri, P., 1999. The
649
role of atmospheric deposition in the biogeochemistry of the Mediterranean Sea.
650
Progress in Oceanography, 44, 147-190.
651
Guieu, C., Aumont, O., Paytan, A., Bopp, L., Law, C.S., Mahowald, N., Achterberg, E.P.,
652
Maranon, E., Salihoglu, B., Crise, A., Wagener, T., Herut, B., Desboeufs, K.,
653
Kanakidou, M., Olgun, N., Peters, F., Pulido-Villena, E., Tovar-Sanchez, A., Volker,
654
C., 2014. The significance of the episodic nature of atmospheric deposition to Low
655
Nutrient Low Chlorophyll regions. Global Biogeochemical Cycles, 28, 1179-1198.
656
Guyennon, A., Baklouti, M., Diaz, F., Palmieri, J., Beuvier, J., Lebaupin-Brossier, C.,
657
Arsouze, T., Beranger, K., Dutay, J.C., Moutin, T., 2015. New insights into the organic
658
carbon export in the Mediterranean Sea from 3-D modeling. Biogeosciences, 12,
7025-659
7046.
660
Hansell, D.A., 2013. Recalcitrant Dissolved Organic Carbon Fractions. In C.A. Carlson, S.J.
661
Giovannoni (Eds.), Annual Review of Marine Science, Vol 5, Vol. 5 (pp. 421-445). Palo
662
Alto: Annual Reviews.
663
Hashihama, F., Kinouchi, S., Suwa, S., Suzumura, M., Kanda, J., 2013. Sensitive
664
determination of enzymatically labile dissolved organic phosphorus and its vertical
665
profiles in the oligotrophic western North Pacific and East China Sea. Journal of
666
Oceanography, 69, 357-367.
667
Herut, B., Rahav, E., Tsagaraki, T.M., Giannakourou, A., Tsiola, A., Psarra, S., Lagaria, A.,
668
Papageorgiou, N., Mihalopoulos, N., Theodosi, C.N., Violaki, K., Stathopoulou, E.,
669
Scoullos, M., Krom, M.D., Stockdale, A., Shi, Z., Berman-Frank, I., Meador, T.B.,
670
Tanaka, T., Paraskevi, P., 2016. The Potential Impact of Saharan Dust and Polluted
671
Aerosols on Microbial Populations in the East Mediterranean Sea, an Overview of a
672
Mesocosm Experimental Approach. Frontiers in Marine Science, 3.
673
Hopkinson, C.S., Vallino, J.J., 2005. Efficient export of carbon to the deep ocean through
674
dissolved organic matter. Nature, 433, 142-145.
675
Jiao, N., Herndl, G.J., Hansell, D.A., Benner, R., Kattner, G., Wilhelm, S.W., Kirchman,
676
D.L., Weinbauer, M.G., Luo, T.W., Chen, F., Azam, F., 2010. Microbial production of
677
recalcitrant dissolved organic matter: long-term carbon storage in the global ocean.
678
Nature Reviews Microbiology, 8, 593-599.
679
Jiao, N., Robinson, C., Azam, F., Thomas, H., Baltar, F., Dang, H., Hardman-Mountford,
680
N.J., Johnson, M., Kirchman, D.L., Koch, B.P., Legendre, L., Li, C., Liu, J., Luo, T.,
681
Luo, Y.W., Mitra, A., Romanou, A., Tang, K., Wang, X., Zhang, C., Zhang, R., 2014.
682
Mechanisms of microbial carbon sequestration in the ocean - future research directions.
683
Biogeosciences, 11, 5285-5306.
684
Jickells, T.D., An, Z.S., Andersen, K.K., Baker, A.R., Bergametti, G., Brooks, N., Cao, J.J.,
685
Boyd, P.W., Duce, R.A., Hunter, K.A., Kawahata, H., Kubilay, N., laRoche, J., Liss,
686
P.S., Mahowald, N., Prospero, J.M., Ridgwell, A.J., Tegen, I., Torres, R., 2005. Global
687
iron connections between desert Dust, Ocean Biogeochemistry, and Climate. Science,
688
308, 67-71.
689
Kanakidou, M., Duce, R.A., Prospero, J.M., Baker, A.R., Benitez-Nelson, C., Dentener, F.J.,
690
Hunter, K.A., Liss, P.S., Mahowald, N., Okin, G.S., Sarin, M., Tsigaridis, K., Uematsu,
691
M., Zamora, L.M., Zhu, T., 2012. Atmospheric fluxes of organic N and P to the global
692
ocean. Global Biogeochemical Cycles, 26.
693
Kanakidou, M., Seinfeld, J.H., Pandis, S.N., Barnes, I., Dentener, F.J., Facchini, M.C., Van
694
Dingenen, R., Ervens, B., Nenes, A., Nielsen, C.J., Swietlicki, E., Putaud, J.P.,
695
Balkanski, Y., Fuzzi, S., Horth, J., Moortgat, G.K., Winterhalter, R., Myhre, C.E.L.,
696
Tsigaridis, K., Vignati, E., Stephanou, E.G., Wilson, J., 2005. Organic aerosol and
697
global climate modelling: a review. Atmos. Chem. Phys., 5, 1053-1123.
698
Kanakidou, M., Tsigaridis, K., Dentener, F.J., Crutzen, P.J., 2000. Human-activity-enhanced
699
formation of organic aerosols by biogenic hydrocarbon oxidation. Journal of
700
Geophysical Research: Atmospheres, 105, 9243-9354.
701
Karl, DM and Björkman, KM., 2015. Dynamics of Dissolved Organic Phosphorus. In: Dennis
702
A. Hansell and Craig A. Carlson. (Eds.) Biogeochemistry of Marine Dissolved Organic
703
Matter. Academic Press. 579-608.
704
Kirchman, D.L., Keil, R.G., Simon, M., Welschmeyer, N.A., 1993. Biomass and Production
705
of Heterotrophic Bacterioplankton in the Oceanic Sub-Arctic Pacific. Deep-Sea
706
Research Part I-Oceanographic Research Papers, 40, 967-988.
707
Krom, M.D., Herut, B., Mantoura, R.F.C., 2004. Nutrient budget for the Eastern
708
Mediterranean: Implications for phosphorus limitation. Limnology and Oceanography,
709
49, 1582-1592.
710
Krom, M.D., Woodward, E.M.S., Herut, B., Kress, N., Carbo, P., Mantoura, R.F.C., Spyres,
711
G., Thingstad, T.F., Wassmann, P., Wexels-Riser, C., Kitidis, V., Law, C.S., Zodiatis,
712
G., 2005. Nutrient cycling in the south east Levantine basin of the eastern
713
Mediterranean: Results from a phosphorus starved system. Deep-Sea Research Part
Ii-714
Topical Studies in Oceanography, 52, 2879-2896.
715
Laghdass, M., Blain, S., Besseling, M., Catala, P., Guieu, C., Obernosterer, I., 2011. Effects
716
of Saharan dust on the microbial community during a large in situ mesocosm
717
experiment in the NW Mediterranean Sea. Aquatic Microbial Ecology, 62, 201-213.
718
Lemee, R., Rochelle-Newall, E., Van Wambeke, F., Pizay, M.D., Rinaldi, P., Gattuso, J.P.,
719
2002. Seasonal variation of bacterial production, respiration and growth efficiency in
720
the open NW Mediterranean Sea (vol 29, pg 227, 2002). Aquatic Microbial Ecology,
721
30, 102-102.
722
Letscher, R.T., Moore, J.K., 2015. Preferential remineralization of dissolved organic
723
phosphorus and non-Redfield DOM dynamics in the global ocean: Impacts on marine
724
productivity, nitrogen fixation, and carbon export. Global Biogeochemical Cycles, 29,
725
325-340.
726
Lomas, M.W., Steinberg, D.K., Dickey, T., Carlson, C.A., Nelson, N.B., Condon, R.H.,
727
Bates, N.R., 2010. Increased ocean carbon export in the Sargasso Sea linked to climate
728
variability is countered by its enhanced mesopelagic attenuation. Biogeosciences, 7,
57-729
70.
730
Ludwig, W., Dumont, E., Meybeck, M., Heussner, S., 2009. River discharges of water and
731
nutrients to the Mediterranean and Black Sea: Major drivers for ecosystem changes
732
during past and future decades? Progress in Oceanography, 80, 199-217.
733
Mahowald, N., Jickells, T.D., Baker, A.R., Artaxo, P., Benitez-Nelson, C.R., Bergametti, G.,
734
Bond, T.C., Chen, Y., Cohen, D.D., Herut, B., Kubilay, N., Losno, R., Luo, C.,
735
Maenhaut, W., McGee, K.A., Okin, G.S., Siefert, R.L., Tsukuda, S., 2008. Global
736