HAL Id: hal-02359228
https://hal.archives-ouvertes.fr/hal-02359228
Submitted on 5 Jan 2021
HAL is a multi-disciplinary open access
archive for the deposit and dissemination of
sci-entific research documents, whether they are
pub-lished or not. The documents may come from
teaching and research institutions in France or
abroad, or from public or private research centers.
L’archive ouverte pluridisciplinaire HAL, est
destinée au dépôt et à la diffusion de documents
scientifiques de niveau recherche, publiés ou non,
émanant des établissements d’enseignement et de
recherche français ou étrangers, des laboratoires
publics ou privés.
Distributed under a Creative Commons Attribution - NoDerivatives| 4.0 International
License
explains enzymatic dysfunction found in leukodystrophy
Ieva Vasiliauskaité-Brooks, Robert Healey, Pascal Rochaix, Julie Saint-Paul,
Rémy Sounier, Claire Grison, Thierry Waltrich-Augusto, Mathieu Fortier,
François Hoh, Essa Saied, et al.
To cite this version:
Ieva Vasiliauskaité-Brooks, Robert Healey, Pascal Rochaix, Julie Saint-Paul, Rémy Sounier, et al..
Structure of a human intramembrane ceramidase explains enzymatic dysfunction found in
leukodys-trophy. Nature Communications, Nature Publishing Group, 2018, 9 (1), pp.5437.
�10.1038/s41467-018-07864-w�. �hal-02359228�
Structure of a human intramembrane ceramidase
explains enzymatic dysfunction found in
leukodystrophy
Ieva Vasiliauskaité-Brooks
1
, Robert D. Healey
1
, Pascal Rochaix
1
, Julie Saint-Paul
1
, Rémy Sounier
1
,
Claire Grison
1
, Thierry Waltrich-Augusto
1
, Mathieu Fortier
1
, François Hoh
2
, Essa M. Saied
3,4
,
Christoph Arenz
3
, Shibom Basu
5
, Cédric Leyrat
1
& Sébastien Granier
1
Alkaline ceramidases (ACERs) are a class of poorly understood transmembrane enzymes
controlling the homeostasis of ceramides. They are implicated in human pathophysiology,
including progressive leukodystrophy, colon cancer as well as acute myeloid leukemia. We
report here the crystal structure of the human ACER type 3 (ACER3). Together with
com-putational studies, the structure reveals that ACER3 is an intramembrane enzyme with a
seven transmembrane domain architecture and a catalytic Zn
2+binding site in its core,
similar to adiponectin receptors. Interestingly, we uncover a Ca
2+binding site physically and
functionally connected to the Zn
2+providing a structural explanation for the known
reg-ulatory role of Ca
2+on ACER3 enzymatic activity and for the loss of function in E33G-ACER3
mutant found in leukodystrophic patients.
https://doi.org/10.1038/s41467-018-07864-w
OPEN
1IGF, University of Montpellier, CNRS, INSERM, Montpellier 34094, France.2CBS, University of Montpellier, CNRS, INSERM, Montpellier 34090, France. 3Institute for chemistry, Humboldt-Universität zu Berlin, Brook-Taylor-Str. 2, 12489 Berlin, Germany.4Chemistry Department, Faculty of Science, Suez Canal University, 41522 Ismailia, Egypt.5Macromolecular Crystallography, Swiss Light Source, Paul Scherrer Institut, 5232 Villigen PSI, Switzerland. These authors contributed equally: Ieva Vasiliauskaité-Brooks, Robert D. Healey. Correspondence and requests for materials should be addressed to
C.L. (email:[email protected]) or to S.G. (email:[email protected])
123456789
T
he main bioactive sphingolipids ceramide, sphingosine,
and sphingosine 1-phosphate (S1P) play key roles in
human (patho)physiology including cancer cell biology,
immune, inflammatory, and metabolic functions (reviewed in
ref.
1). As a result, enzymes regulating sphingolipid levels
con-stitute key therapeutic targets, particularly for the treatment of
cancer
2. Among these enzymes, ceramidases (CDases) are
attractive targets for clinical intervention
3as they directly regulate
the balance between these bioactive lipids by converting
cer-amides into free fatty acids and sphingosine
4which is further
processed into S1P by kinases
5.
The
five ceramidases cloned to date are classified into acid,
neutral, and alkaline groups according to the pH optima of the
hydrolysis reaction (reviewed in ref.
3). However, the three groups
do not display any sequence homology; the acid ceramidase
(ASAH1), ubiquitously expressed, is mainly present in lysosomes,
its inactivation by mutation causing Farber disease
6. The recent
crystal structures of ASAH1 revealed a globular fold associating
α-helices and anti-parallel β-sheets
7. This study also showed that
the ASAH1 enzymatic activity necessitates an
autoproteolytic-based conformational change exposing the putative substrate
binding cavity and the cysteine-based catalytic center at its base
7.
The neutral ceramidase (NCDase) is also ubiquitously expressed,
structurally containing one transmembrane domain (TM) and a
large soluble domain
8unrelated to ASAH1. The recent crystal
structure of NCDase soluble domain revealed a Zn
2+-dependent
catalytic site deeply buried in a hydrophobic binding pocket
which can accommodate the ceramide
9.
Alkaline ceramidases (ACERs) are much less well-understood,
in part because of their hydrophobic nature that, until now, has
rendered the biochemical and structural analyses difficult. Three
different genes have been cloned—ACER1
10, ACER2
11, and
ACER3
12, and sequence analyses suggest that they are integral
membrane proteins. ACER1 and ACER2 expression is rather
tissue specific (skin and placenta, respectively), while ACER3 is
expressed in most tissues
10–12. Very little is known at the
molecular level: ACERs are localized intracellularly in the
membrane of the endoplasmic reticulum-Golgi apparatus
net-work and their activity, mainly directed against ceramides with
long unsaturated acyl chains (C18:1, C20:1, and C24:1), was
shown to be Ca
2+-dependent
10,12–14.
The critical role of ACERs in human physiology and, in
par-ticular ACER3, was recently revealed by clinical data
demon-strating
that
ACER3
deficiency leads to progressive
leukodystrophy in early childhood
15, a disease for which no
treatment is available today. This study demonstrated that
patients were homozygous for a p.E33G ACER3 mutant and that
this mutation impaired the ACER3 ceramidases activity in
patients’ cells. When compared to healthy individuals, this loss of
function resulted in higher level of several ceramide species in the
blood, in particular for the ACER3 preferred substrates, C18:1
and C20:1 ceramides. It was proposed that these aberrant levels of
ceramides in the brain could result in an incorrect central
mye-lination leading to the clinical phenotype associated with the
ACER3 mutant, i.e., neurological regression at 6–13 months of
age, truncal hypotonia, appendicular spasticity, dystonia, optic
disc pallor, peripheral neuropathy, and neurogenic bladder
15.
However, in mice, while ACER3 knock-out results in an aberrant
accumulation of various ceramides, it does not affect myelination.
Instead, this deficiency induces the premature degeneration of
Purkinje cells and cerebellar ataxia
16. In the periphery, in mice,
the modulation of C18:1 ceramide levels by ACER3 regulates the
immune response through the upregulation of cytokines, while its
deficiency increases colon inflammation and its associated
tumorigenesis
17. Moreover, in vitro results obtained in human
cells revealed that ACER3 contributes to acute myeloid leukemia
(AML) pathogenesis
18. Indeed, it was found that ACER3
expression negatively correlates with the survival of AML
patients, and that ACER3 is essential for the growth of AML cells
as the sh-RNA inhibition of its expression resulted in an increase
of apoptosis and in an important decrease in cell growth
18.
Modulating ceramide homeostasis can have broad implications
and targeting ACER3 for clinical purposes will be extremely
challenging. More research is needed to determine whether the
molecular control of ACER enzymatic activity (agonists and
antagonists) could constitute a possible clinical intervention for
the treatment of leukodystrophy, colon cancer, or AML among
other pathologies involving ceramide dyshomeostasis. The
first
step toward this endeavor is to better understand the molecular
basis of ACER function.
In an effort to determine the molecular mechanisms of the
ACER enzymatic function, we undertook a structural analysis of
ACER3. We solve a 2.7 Å crystal structure using in meso
crys-tallography that, together with computational studies, reveal at
the atomic level how this integral membrane enzyme
accom-modates and hydrolyzes its ceramide substrate in a Zn
2+- and
Ca
2+-dependent manner. Furthermore, we uncover how a single
point mutant (E33G) results in the destabilization of the calcium
binding site, providing a molecular explanation for the ACER3
mutant dysfunction leading to leukodystrophy in human.
Results
ACER3 is a seven transmembrane protein. Recent
break-throughs in the crystallization of challenging membrane proteins
such as G protein-coupled receptors include the use of protein
engineering with a soluble module, an approach pioneered in
2007 to solve the structure of the beta2-adrenergic receptor
19.
Here, we modified ACER3 (residues 1–244) with the BRIL soluble
module (thermostabilized apocytochrome b562RIL from
Escher-ichia coli
20) fused to its C-terminus (Supplementary Figure 1 and
Methods) and showed that this fusion is biologically active; it
hydrolyzes C18:1 ceramide substrate in a preferred manner over
C18:0 ceramide in detergent micelles (Supplementary Figure 1).
The ACER3–BRIL fusion was crystallized in a cholesterol-doped
monoolein lipidic mesophase and the structure determined at 2.7
Å resolution (Table
1
).
When cloned in 2001, ACER3 was predicted to be an integral
membrane protein with
five TMs
12. In fact, the crystal structure
revealed that it possesses seven alpha-helices forming a 7TM
architecture with opposite N- and C-terminus domains (Fig.
1
).
Strikingly, the fold of ACER3 is similar to adiponectin receptors
(ADIPORs) with the 7TM harboring a Zn
2+binding site
21(Fig.
1
a, Supplementary Figure 2) despite a very low sequence
identity (14% with ADIPOR1 and 10% for ADIPOR2). This
similar 7TM fold suggests that ACER3 and ADIPORs possess the
same topology; an intracellular N-terminus exposed to the
cytoplasm and the C-terminus facing the lumen (Fig.
1
,
Supplementary Figure 2). We confirmed this topology in living
cells using time-resolved
fluorescence resonance energy transfer
(TR-FRET) experiments (Supplementary Figure 2). On each side,
the TMs are connected by three cytoplasmic loops (ICL 1–3) and
three extracellular loops (ECL 1–3) (Fig.
1
a). ICL3, connecting the
TM6 and 7, is the most notable loop (residues 196–216) as it
forms a motif composed of two short alpha-helices (one and two
turns) lying parallel to the membrane plane connected by a
positively charged loop (a RKKVPP sequence) that is suitably
positioned to interact with the polar head of negatively charged
lipids (Fig.
1
b).
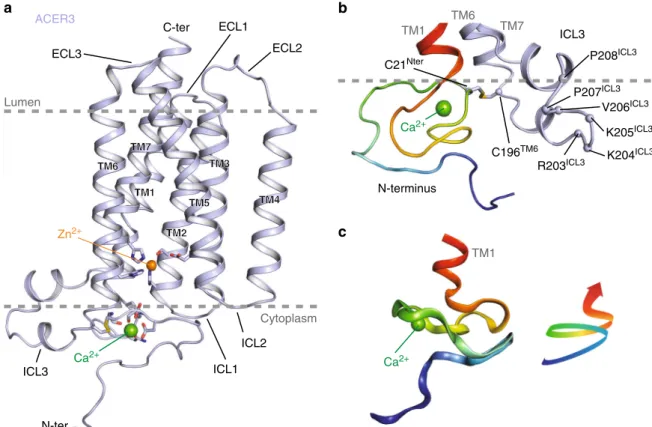
The N-terminus (1–34), devoid of secondary structure, is
packed against the bottom of the TM bundle (1–3, 6, and 7) and
forms a spiral-like motif in which resides a Ca
2+ion.
The crystal structure uncovers a disulfide bond formed
between C21 and C196 connecting the N-terminus to TM6. This
disulfide may play an important role in stabilizing this peculiar
N-terminal domain fold (Fig.
1
c). In a cellular context, this
disulfide is facing the reducing environment of the cytoplasm and
we cannot exclude the possibility that it is dynamically regulated
by its redox local environment, in particular neighboring charged
residues/lipids may lower thiolate pKa and render those more
prone to oxidation
22.
Intramembrane binding sites. The ACER3 7TM domain
con-tains a large hook-shaped intramembrane pocket directly
acces-sible to the lipid leaflet through two openings between the TM5
and the TM6 (Fig.
2
). This cavity is formed by residues belonging
to all TMs except TM4 (Fig.
2
a). At the top, the V164
TM5side
chain is capping the pocket, while V157
TM5, I161
TM5, Y176
TM6,
and L179
TM6side chains shape the side of the cavity facing the
lipids (Fig.
2
b, c). Opposed to this hydrophobic patch and toward
the inner core of the TM, there is a rather polar environment
formed by the residues S160
TM5, S178
TM6, and H231
TM7in
which we found some electron density that we modeled as a water
molecule (Fig.
2
b). Such a hydrophilic patch might play a role in
ceramide binding selectivity, as it may prevent the binding of
ceramide harboring acyl chains over 24 carbons. Directly below
this area appeared a large electron density in the calculated
2Fo–Fc map as well as in the (unbiased) polder OMIT map
23(see
Methods) (Supplementary Figure 3) that we tentatively modeled
as a mono-olein. Indeed, mono-olein by weight forms 54% of the
lipidic cubic phase (i.e., ~1.9 M) and displays an acyl chain moiety
chemically identical to that of C18:1 ceramide (Supplementary
Figure 3), the preferred substrate of ACER3
14.
At the bottom of the intramembrane pocket, we
unambigu-ously identified a Zn
2+ion (Supplementary Figure 3 and
Methods). This Zn
2+is coordinated by three His residues
(H81
TM2, H217
TM7, and H221
TM7) and a water molecule
forming hydrogen bonds with S77
TM2and D92
TM3(Fig.
2
d).
The residues forming this Zn
2+binding site are strictly conserved
among the ACER family, and across species from yeast to human,
highlighting the importance of this site in the biological function
of these proteins (Supplementary Figure 4). Given the
well-characterized ceramidase activity of ACER3, these structural data
definitively establish ACERs as Zn
2+-dependent intramembrane
enzymes.
Substrate docking and hydrolysis mechanism. We then assessed
the mechanism of substrate binding and hydrolysis. To this end,
we used computational docking and molecular dynamics (MD)
simulations to calculate the most favorable binding mode of a
C18:1 ceramide into the ACER3 lipid binding pocket (Fig.
3
). The
best scoring docking pose positions the ceramide in the
hook-shaped cavity within the 7TM (Fig.
3
a). The C18:1 acyl chain is
stabilized through extensive contacts with hydrophobic residues
lining the interior of the cavity including M43
TM1, V73
TM2,
M96
TM3, F103
TM3, V153
TM5, L156
TM5, V157
TM5, and F182
TM6(Fig.
3
b). Surprisingly, the site of unsaturation with the sp
2car-bons is surrounded by a polar environment constituted by the
sulfhydryl group of C100
TM3and three hydroxyl groups of
S99
TM3, Y149
TM5, and S228
TM7(Fig.
3
c). We functionally tested
S99A, Y149A, and S228A mutants and compared their enzymatic
activity with the one of ACER3–BRIL wild-type (WT)
prepara-tions. In agreement with the docking pose, the Y149A mutant
presented an important decrease in activity, while S99A and
S228A mutants did not show any significant functional
differ-ences (Supplementary Figure 5). Moreover, none of the mutants
showed a change in the substrate preference (Supplementary
Figure 5), suggesting that they alone are not critically involved in
this selectivity. The sphingosine moiety remains partially
acces-sible to the membrane leaflet and interacts with a set of
hydro-phobic residues from TM5 and TM6 (Fig.
3
b). The ceramide
carbonyl group and its primary alcohol directly interact with the
Zn
2+ion, resulting in an octahedral coordination sphere
(Fig.
3
d). The ceramide is further stabilized by polar contacts
between its carbonyl and the amine group of W220
TM7side
chain, as well as its primary alcohol and the carboxylate of
D92
TM3. Interestingly, the crystallographic water molecule that
bridges S77
TM2, D92
TM3, and the Zn
2+ion appears to be suitably
placed for a nucleophilic attack on the ceramide carbonyl
(Fig.
3
d), suggesting a general acid–base catalytic mechanism in
which D92
TM3acts as a proton acceptor/donor (similar to e.g.,
zinc-dependent proteases)
24(Supplementary Figure 5). From a
substrate specificity point of view, it is clear from the structure
and the docking results that substrates presenting large/bulky
Table 1 Data collection and re
finement statistics (molecular
replacement)
ACER3–BRIL, nativea ACER3–BRIL, Zn edge Data collection Space group C2221 C2221 Cell dimensions a, b, c (Å) 60.88, 68.83, 257.52 61.41, 69.69, 258.15 α, β, γ (°) 90.00, 90.00, 90.00 90.00, 90.00, 90.00 Resolution (Å) 45.60–2.70 (2.83–2.70)b 46.07–2.85 (3.00–2.85) Rmergec 0.566 (NA) 0.614 (NA)
Rmeas 0.577 (NA) 0.619 (NA)
Rpim 0.110 (0.875) 0.102 (NA) CC1/2 0.964 (0.496) 0.999 (0.349) I/σI 8.1 (1.1) 7.8 (0.7) Completeness (%) 100.0 (100.0) 100.0 (100.0) Redundancy 27.6 (27.7) 68.8 (65.2) Wilson B factors 73.6 62.7 Refinement Resolution (Å) 45.60–2.70 – No. of reflections 15,331 – Rwork/Rfree 24.90/27.14 – No. of atoms Protein 2855 – Zn2+ 1 – Ca2+ 1 – Mg2+ 2 Na+ 3 SO42− 30 Mono-olein 25 – Water 122 – B-factors (Å2) Protein 74.63 – Zn2+ 86.05 – Ca2+ 97.43 – Mg2+ 50.97 Na+ 75.02 SO42− 113.02 Mono-olein 87.20 – Water 57.08 – R.M.S. deviations Bond lengths (Å) 0.010 – Bond angles (°) 0.969 –
aThe reported statistics correspond to datasets that were obtained by merging serial data from
many different crystals collected in wedges of 10° (77 and 198 wedges for the native Zn edge datasets, respectively)
bValues in parentheses are for highest-resolution shell
cIn this case, indicators like Rmerge and Rmeas are not suitable for assessing data quality37 NA not applicable, Rmergevalue over 1 is statistically meaningless
modifications of the primary alcohol such as sphingomyelin,
glucosylceramide, or ceramide-1-phosphate cannot be
accom-modated in the pocket, and are unlikely to serve as
ACER3 substrate (Supplementary Figure 5). Such a steric
hin-drance serving as the mechanism of substrate selectivity was also
observed in neutral ceramidases
9.
Additional evidence supporting the biological relevance of the
described ceramide binding pose was obtained from multiple
simulations of the ACER3–C18:1 ceramide complex. Indeed, the
initial binding pose was very stable with the all-atom root mean
square deviations (RMSD) of the bound C18:1 ceramide
remaining below 3 Å in every trajectory of
five independent
simulations (Fig.
3
a and Supplementary Figure 5).
Comparison to ADIPORs structures. The overall architecture of
ACER3 is similar to the ADIPORs. In particular, the position of
the TM1–3, 6, and 7 forms a similar pattern when viewed from
the cytoplasm or from the lumen (Fig.
4
a). In addition to the
similar 7TM architecture, the Zn
2+binding sites with the
cano-nical (H)
3SD-water module are almost superimposable (Fig.
4
b).
Of interest, the sequence (H)
3SD is unifying a superfamily of
putative hydrolases recently identified based on statistically
sig-nificant sequence similarities, termed CREST (ACER,
progester-one adipoQ receptor (PAQR) receptor, Per1, SID-1, and
TMEM8)
25.
Significant/major differences are observed however between
ACER3 and ADIPORs. Unlike ADIPORs, the ACER3
intramem-brane pocket is not connected to the upper leaflet of the
membrane nor to the cytoplasmic domain, due to a distinct
N-terminus fold (Supplementary Figure 6). Conformational changes
within domains accessible to the hydrophilic cytoplasm must
occur for water molecules to access the active site. The difference
between the intramembrane pockets also resulted in distinct
calculated ceramide binding modes differing essentially at the
level of the sphingosine moiety position (Supplementary Figure 6).
These differences may have some impact on the intrinsic
enzymatic properties of ACER3 vs. ADIPORs, i.e., K
Mparameters
and substrate preference.
A key difference between ACER3, ADIPOR1, and ADIPOR2 is
seen in the TM4 and TM5 architecture. First, the ACER3 TM4 is
much shorter than that of the ADIPORs, resulting from a longer
ECL2 connecting TM3 and TM4 (Fig.
4
c). Second, as compared to
the
open
ADIPOR1
and
closed
ADIPOR2
TM4
and
TM5 structures, ACER3 presents an intermediate TM4-TM5
conformation (Fig.
4
c). These architectural differences are most
likely originating from the biochemical preparations as well as
from crystallization conditions: where a closed ADIPOR2 structure
favored the binding of an oleic acid; an intermediate ACER3 bound
a monoolein; and an open ADIPOR1 structure was ligand-free.
The three distinct conformations might however represent distinct
steps of the common catalytic process, the conformational changes
and dynamics of such action of intramembrane ceramidases
remains to be explored.
On the other hand, the described structure of the soluble
NCDase has nothing in common with the ACER3 structure apart
from the three histidines coordinating the Zn
2+(Supplementary
Figure 6). In particular, catalytic sites belong to two clearly
distinct scaffolds: intramembranous for ACER3 and
membrane-associated for NCDase with a water-soluble domain
predomi-nantly constituted of beta-sheets (Supplementary Figure 6)
forming the so-called beta-triangle hydrolase scaffold
9. These
clearly distinct structures are in agreement with the different
cellular localization as well as with the functional specialization of
these enzymes
3.
c
b
a
ACER3 Lumen Cytoplasm C-ter N-ter Zn2+ Ca2+ ECL3 R203ICL3 K204 ICL3 K205ICL3 V206ICL3 P207ICL3 P208ICL3 ECL1 ECL2 C196TM6 C21Nter TM6 TM1 TM7 N-terminus ICL1 ICL2 ICL3 ICL3 TM1 Ca2+ Ca2+ TM4 TM4 TM3 TM3 TM5 TM5 TM2 TM2 TM1 TM1 TM6 TM6 TM7 TM7Fig. 1 Crystal structure of ACER3. a Overall view of ACER3 crystal structure at 2.7 Å from within the membrane plane. The zinc and calcium ions are represented as spheres with a van der Waals radius of 0.88 and 1.14, respectively. Side chains of residues in close proximity to both ions are shown as sticks.b Close-up view of the N-terminus (colored from blue to red) and intracellular loop 3 (ICL3, colored in light blue) domains highlighting the disulfide bond formed by C21 and C196 (sticks).c Cartoon representation of the N-terminus domain colored as in (b) (left) revealing a spiral-like motif (right)
A Ca
2+-binding site within the N-terminus. Perhaps the most
interesting feature of the ACER3 structure is the presence of a
Ca
2+-binding site within the N-terminal domain (Fig.
5
a). Ca
2+was shown to modify the enzymatic activity of ACER3
10,12–14,
but the molecular basis for this effect was unknown. The Ca
2+ion is coordinated by six oxygens from the D19 carboxylate
(bidentate), the W20 backbone carbonyl, the E22 backbone
car-bonyl, the N24 side chain carcar-bonyl, and the E33 carboxylate
(monodentate) (Fig.
5
b). The resulting coordination geometry
resembles an incomplete pentagonal bipyramid. However, during
b
c
d
Lumen Cytoplasm Eisenberg hydrophobicity scale 1.38 –2.53 TM7 TM7 TM6 TM6 TM5TM5 TM3 TM3 TM2 TM2 TM1 TM1 S160 S160TM6TM6 H23 H231TM7TM7 S178 S178TM5TM5 V164 V164TM5TM5 Y176 Y176TM6TM6 L179 L179TM6TM6 V157 V157TM5TM5 I161 I161TM5TM5 D92 D92TM3TM3 S77 S77TM2TM2 H221 H221TM7TM7 H81 H81TM2TM2 H217 H217TM7TM7 H2Oa
TM7 TM7 TM6 TM6 TM5 TM5 TM3 TM3 TM2 TM2 TM1 TM1 180° Lumen Cytoplasm L179 L179TM6TM6V157V157 TM5 TM5f
e
MD simulations, the coordination of D19 carboxylate switches
from bidentate to monodentate, and the coordination sphere is
completed by a water molecule resulting in an octahedral calcium
site (Supplementary Figure 7). The loop forming the Ca
2+binding site is connected to the 7TM core through a disulfide
bond formed by C21 and C196
TM6positioned at the bottom of
TM6 (beginning of the ICL3). The sequences D
19WCE(X)N
24and
32AEF
34constituting the Ca
2+binding domain as well as the
C196
TM6forming the disulfide bond are strictly conserved among
the ACER family (Fig.
5
c) in agreement with the Ca
2+-dependent
ceramidase
activity
described
for
ACER1,
ACER2,
and
ACER3
10,12–14. Moreover, this domain is also strictly conserved
across species from yeast to human (Fig.
5
c, Supplementary
Figure 4). This strict conservation during evolution further
highlights the paramount regulatory role of Ca
2+in the
enzy-matic function.
Interestingly, based on the crystal structure and MD
simula-tions results, two residues appear to play critical roles in
physically linking the Ca
2+and the Zn
2+sites, W20 and E33.
Indeed, in the structure, the two residues interact simultaneously
with both metal sites (Fig.
5
d). First, E33 carboxylate interacts
with the Ca
2+ion and is in close proximity to H81
TM2side chain,
while H81
TM2coordinates the Zn
2+(Fig.
5
d). Interestingly, E33
carboxylate rearranges during MD simulations to form a
hydrogen bond with H81
TM2side chain (Fig.
5
d, e). Second,
W20 coordinates Ca
2+through its backbone carbonyl, and its
indole ring forms a His–aromatic complex with H81
TM2and
H217
TM7side chains (Fig.
5
d). Such His–aromatic interactions
are found in other enzymes and constitute key components of the
enzymatic catalytic mechanism by participating in the
transition-state stabilization or through critical constraints on the
conformation of the catalytic site (described in ref.
26). In
addition, W20 forms a network of hydrophobic interactions with
L18, F80
TM2, W189
TM6forming the bottom of the hook-shaped
intramembrane pocket toward the cytoplasm (Fig.
5
f). We
hypothesize that the functional effect of Ca
2+on the catalytic
activity of ACER3 originates from this direct link, with changes to
the Ca
2+site propagating to the Zn
2+catalytic site.
Remarkably, this discovery provides molecular insights into the
E33G ACER3 mutation carried by patients suffering
leukody-strophy, which results in the loss of ACER3 ceramidase activity
despite similar level of expression than in control membrane
preparations
15. We used MD simulations to investigate the effect
of this mutation on the stability of the ACER3 structure relative
to the CER18:1-bound wild type model (Fig.
6
). The effect
observed on the
flexibility of the Zn
2+itself is rather mild due to
the integrity of its coordinating residues and the presence of the
stabilizing C18:1 ceramide molecule (Supplementary Figure 8). Of
note, unlike the WT ACER3, the purified E33G ACER3 mutant
was highly unstable during purification and yielded mostly
aggregated protein eluting in the void volume during size
exclusion chromatography, suggesting that the destabilization of
the Ca
2+site might influence the overall protein stability. In
agreement with this experimental observation, MD simulations
revealed rapid Ca
2+unbinding followed by an overall
destabiliza-tion of the N-terminal/cytoplasmic region of the protein in the
mutated E33G model (Fig.
6
, Supplementary Figure 8). At the
level of the Ca
2+and Zn
2+sites, the loss of Ca
2+results in
increased
flexibility of W20 and motions of the Ca
2+binding
loop (D
19WCE(X)N
24) which deforms the substrate binding
pocket and increases water accessibility to the Zn
2+site
(Supplementary Figure 8). These calculated alterations most
likely represent a molecular explanation for the observed loss of
E33G ACER3 ceramidase activity in patients’cells.
In order to further validate the role of the Ca
2+binding site, we
performed some additional enzymatic assays on ACER3 single
point mutants D19G, E22G, N24G and E33G. As anticipated, we
confirmed the functional data already published for the E33G
mutant i.e., a dramatic decrease in the enzymatic function when
compared to the WT preparations (Supplementary Figure 7).
Two other mutants, E22G and N24G, behaved as E33G,
displaying a clear decrease in enzymatic activities (Supplementary
Figure 7). Surprisingly, the enzymatic activity of D19G was only
partially affected (Supplementary Figure 7). Altogether, these data
confirm the critical role of the Ca
2+binding site in ACER3
function.
Discussion
In this study, we solved the crystal structure of ACER3 revealing a
seven-transmembrane domain architecture harboring a catalytic
Zn
2+binding site nearly identical to the one we recently
uncovered in ADIPORs
21. Considering the fact that ACER3 and
ADIPORs share a similar fold, a common Zn
2+catalytic site and
similar functional enzymatic capability, it is highly likely that
ADIPORs are indeed genuine ceramidases. These discoveries are
expanding the family of ceramidases to, at least, seven members
in humans. Given the established functional link between fungal
PAQR and ceramidase activity
27, it is then tempting to speculate
that all the members of the PAQR family
28(11 proteins in
humans including ADIPOR1 and ADIPOR2) share this
func-tional characteristic with ACER3.
Moreover, our data provide a structural explanation of the
previously demonstrated regulatory role of Ca
2+on ACER3
enzymatic activity
12. As it is known that high pH can increase the
binding of Ca
2+29, this might also constitute the molecular basis
for the alkaline pH optima of ACER ceramidase activity
in vitro
12.
Although ADIPORs seem to be ligand-dependent ceramidases
(activated by adiponectin), the intracellularly residing ACER3
might be regulated through changes in cytoplasmic Ca
2+con-centration and/or local pH. In addition, the ACER3 structure and
computational studies highlight the role of E33 in the formation
of the Ca
2+binding site and provide insights into the loss of
ceramidase activity of the E33G–ACER3 mutant found in
leu-kodystrophic patients. This knowledge will enable the
develop-ment of pharmacological chaperones specifically designed to
restore the enzymatic function of ACER3 mutant. This may
constitute a potential treatment option for individuals diagnosed
with ACER3 mutation when leukodystrophy is suspected (at the
onset) and before severe clinical conditions manifest. In
addition, our study opens the way to the structure-based
dis-covery of small molecules able to control the ceramidase activity
of ACER3. Ultimately, such modulators could have beneficial
Fig. 2 ACER3 intramembrane domain. a View of the large hook-shaped internal cavity shown as surface (cavity mode 1) within the 7TM helix bundle (shown in light blue cartoon). The TM4 has been removed for clarity. The cavity is colored according to the Eisenberg hydrophobicity classification from red (high hydrophobicity) to white (low hydrophobicity).b, c Close-up views of the pocket on the top highlighting the observed density (blue mesh, 2Fo–Fc map contoured at 1σ) in which a water molecule was modeled (red sphere) b and on the side c with residues lining the pocket shown as sticks. d Close-up view of the zinc binding site highlighting the residues forming thefirst coordination sphere of the Zn2+shown as sticks. The modeled water molecule is shown as a blue sphere.e 180° rotation of the view described in (a). f Side view of the pocket shown as surface (cavity mode 0) revealing the pocket accessibility at the level of the Zn2+site and right above it
effects against the pathogenesis of diseases involving C18:1
cer-amide and ACER3 dysregulation including colon cancer and
AML.
Methods
ACER3 contructs. The full-length synthetic gene of human ACER3 (UniProtKB-Q9NUN7) was subcloned into a modified pFastBac vector resulting in ACER3–BRIL construct bearing a C-terminal BRIL soluble module (thermo-stabilized apocytochrome b562RIL20) and an N-terminal Flag epitope followed by a
tobacco etch virus protease site. The full-length ACER3–BRIL construct yielded diffraction quality crystals, however, those crystals diffracted to maximum 5 Å resolution despite extensive attempts to optimize the crystallization conditions to improve crystal quality. Therefore, based on an ab initio model of ACER3 obtained from the I-TASSER webserver30, a putativelyflexible C-terminal tail of ACER3
composed of 23 amino acids were truncated which yielded crystals allowing to
obtain high-resolution diffraction data. E33G-ACER3 mutant was generated using the full-length ACER3 cloned to pFastBac vector.
Expression and purification of ACER3 contructs. ACER3 constructs were expressed in Sf9 insect cells (Life technologies) using the pFastBac baculovirus system (ThermoFisher) according to manufacturer’s instructions. Insect cells were grown in suspension in EX-CELL®420 medium (Sigma) to a density of 4 × 10⁶cells
per ml and infected with baculovirus encoding ACER3–BRIL. Cells were harvested by centrifugation (3000g) 48 h postinfection and stored at−80 °C until purifica-tion. After thawing the frozen cell pellet, cells were lysed by osmotic shock in 10 mM Tris-HCl pH 7.5, 1 mM EDTA buffer containing 2 mg ml−1iodoacetamide and protease inhibitors. Lysed cells were centrifuged (38,420g) and the enzyme extracted using a glass dounce tissue grinder in a solubilization buffer containing 20 mM HEPES (pH 7.5), 100 mM NaCl, 1% (w/v) n-dodecyl-β-D-maltoside (DDM,
Anatrace), 0.1% (w/v) cholesteryl-hemi-succinate (CHS, Sigma), 2 mg ml−1 TM7 TM7 TM6 TM6 TM5 TM5 TM3 TM3 TM2 TM2 TM1 TM1 TM4 TM4
a
b
c
d
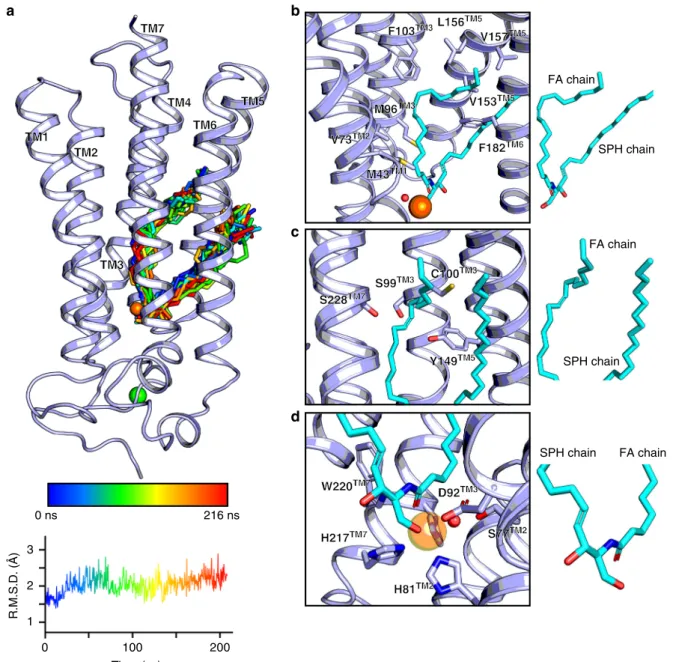
0 ns 216 ns R.M.S.D. (Å ) 3 2 1 0 100 200 Time (ns) SPH chain FA chain SPH chain FA chain SPH chain FA chain F10 F103TM3TM3L15L156 TM5 TM5 V15 V157TM5TM5 V15 V153TM5TM5 F18 F182TM6TM6 M4 M43TM1TM1 M9 M96TM3TM3 V7 V73TM2TM2 S22 S228TM7TM7 S9 S99TM3TM3 Y14 Y149TM5TM5 C10 C100TM3TM3 W22 W220TM7TM7 H21 H217TM7TM7 S7S77TM2TM2 H8 H81TM2TM2 D9 D92TM3TM3Fig. 3 Computational analyses of ceramide 18:1 docking into ACER3. a Top scoring C18:1 ceramide (shown as stick) docking pose (hydrogens were omitted for clarity) and observed ligand trajectory during a 216 ns long MD simulations (from blue to red with ligand snapshots extracted every 8 ns). A representative all-atom RMSD of the C18:1 ceramide is shown below (n = 5 in total). b View of the ceramide docking pose highlighting as sticks the residues in close proximity to the ceramide (colored in cyan, and also shown alone on the right to indicate the identity of the fatty acid (FA) and sphingosine (SPH) chains).c Environment around the site of unsaturation of the docked C18:1 ceramide with the side chains of polar residues close to the sp2carbons shown as sticks.d Close-up view of the Zn2+catalytic site (side chains represented as sticks) with the putative water molecule (red sphere)
ideally positioned to attack the amide bond of the C18:1 ceramide. In all panels, the Zn2+and Ca2+as well as the water molecule are represented as spheres (colored orange, green, and red, respectively)
iodoacetamide and protease inhibitors. The extraction mixture was stirred for 1 h at 4°C. The cleared supernatant (38,420g centrifugation) was adjusted to thefinal concentration of 20 mM HEPES (pH 7.4), 200 mM NaCl, 0.5% (w/v) DDM and 0.05% CHS and loaded by gravityflow onto anti-Flag M2 antibody resin (Sigma). The resin was then washed with 2 column volumes (CV) of DDM wash buffer containing 20 mM HEPES (pH 7.5), 200 mM NaCl, 0.025% (w/v) DDM, and 0.0001% (w/v) CHS. While on the M2 antibody resin, the protein was exchanged into lauryl maltose neopentyl glycol (MNG) detergent-containing buffer composed of 20 mM HEPES (pH 7.5), 0.5% MNG-14, 200 mM NaCl. The detergent exchange was performed by washing the column with a series of seven buffers (2 CV each) made up of the following ratios (v/v) of MNG exchange buffer and DDM wash buffer: 1:3, 1:1, 3:1, 9:1, 19:1, 99:1, and MNG exchange buffer alone. The column was then washed with 20× critical micelle concentration (CMC) MNG buffer containing 20 mM HEPES (pH 7.5), 0.02% MNG-14, and 200 mM NaCl and the bound enzyme was eluted in the same buffer supplemented with 0.4 mg ml−1Flag peptide. The eluted protein was concentrated to 500μl using 100 kDa spin filters
and further purified by size exclusion chromatography on a Superdex 200 Increase 10/300 column (GE Healthcare) in 20× CMC MNG buffer. Fractions containing monodisperse ACER3-BRIL were collected and concentrated to 20 mg ml−1for crystallization trials.
Crystallization, data collection, and processing. Crystallization of ACER3–BRIL was performed using the in meso method31. Concentrated ACER3–BRIL was
recon-stituted into 10:1 monoolein:cholesterol (Sigma) at a ratio of 1:1.5 protein:lipid by weight. Reconstitution was done using the coupled two-syringe method. The resulting mesophase was dispensed onto a glass plate in 50-nl drops and overlaid with 900 nl precipitant solution using a Gryphon LCP robot (Art Robbins Instruments). Crystals grew in precipitant solution consisting of 34–40% PEG 400, 0.1 M Hepes pH 7.5, 75 mM magnesium sulfate and 5% DMSO. Crystals were observed after one day and grew to full size (~20μm x 20 μm x 30 μm) after 5 days. Crystals were harvested from the lipidic mesophase using mesh grid loops and directlyflash-frozen in liquid nitrogen.
b
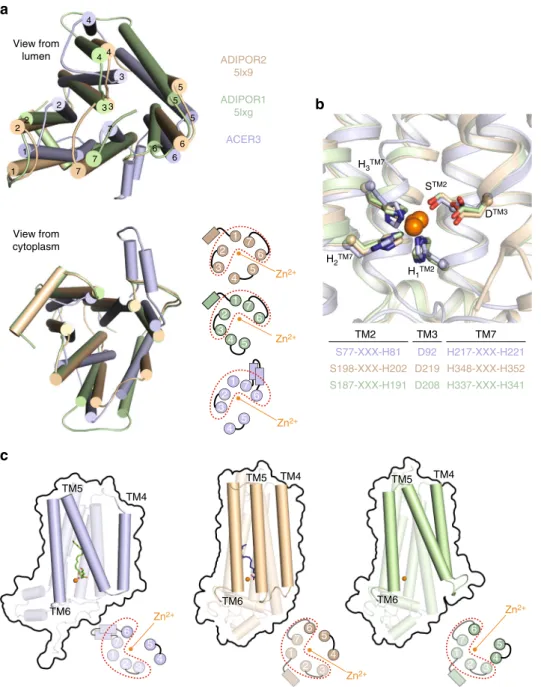
DTM3 STM2 H1TM2 H2TM7 ADIPOR1 5lxg ADIPOR2 5lx9 ACER3 7 2 4 1 5 3 6 7 2 4 1 5 3 6 7 2 4 1 5 3 6 TM7 H217-XXX-H221 H348-XXX-H352 H337-XXX-H341 TM3 D92 D219 D208 TM2 S77-XXX-H81 S198-XXX-H202 S187-XXX-H191 View from lumen View from cytoplasm Zn2+ Zn2+ Zn2+ TM6 TM5 TM4 TM6 TM5 TM4 TM6 TM5 TM4 Zn2+ 7 2 4 1 5 3 6 Zn2+ 7 2 4 1 5 3 6 Zn2+ 7 2 4 1 5 3 6 TM6 TM5 TM6 TM5 TM6 TM5 H3TM7 4 4 4 3 3 3 2 2 2 1 1 7 7 7 6 6 6 5 5 5a
c
Fig. 4 Comparison of ACER3 and ADIPORs structures. a Superposition of ADIPOR1 (light green), ADIPOR2 (dark yellow), and ACER3 (light blue) represented with cylindrical transmembrane helices viewed from the lumen (top) or from the cytoplasm (bottom). A scheme with numbered TMs is also shown at the bottom to highlight the similar architecture of TM1–3, 6, and 7. b Superposition of the three structures showing the strict structural conservation of the Zn2+catalytic site of ACER3, ADIPOR2, and ADIPOR1 (colored as above). The primary sequence with the H3SD motif is also shown.
c Views from within the membrane plane showing the differences in the architecture of TM4 and TM5 relative to the Zn2+(orange sphere) between ACER3, ADIPOR2, and ADIPOR1 (colored as described above). The bottom scheme represents views from the cytoplasm, with the red dots highlighting the constant domain. This view also reveals the large TM4 and TM5 shift between the three structures
Diffraction data were collected using in the meso crystallographic method32at
X06SA beamline of the Swiss Light Source (SLS), Villigen, Switzerland. Diffraction measurement from ACER3–BRIL microcrystals were carried out at tolerable dose under cryogenic condition (~100 K) with 10 × 10μm2micro-beam, providing
4.76 × 10¹¹photons/s at 12.4 keV (λ = 1.0 Å, i.e., native) as well as 2.47 × 10¹¹
photons/s at 9.67 keV (λ = 1.281 Å, i.e., Zn-edge) X-ray energies. Typically, 10° wedge of data was collected from each microcrystal (from ACER3 BRIL-native and Zn-edge) in oscillation step of 0.2° at a speed of 2°/s using EIGER16M detector with a sample-to-detector distance of 30 cm. A mesh-loop, containing LCP-bolus with many micro-crystals, was raster grid-scanned with microbeam X-ray to locate
the crystals. The rastering procedure for crystal detection is described elsewhere33.
In order to automate identification of tiny crystals, followed by data collection, a new graphical user-interface, called CY+ GUI, was developed as an extension of DA+ software suite34for the beamline at the SLS. Processing of individual small
wedges using XDS35was automated in DA+ software suite. Totally, 198 mini
datasets (i.e., 10° wedge/dataset) were collected from ACER3 BRIL native crystals at 12.4 keV X-ray energy. Individual small wedge of dataset measures weak and sparse diffraction spots, which in turn results in partial measurement of each reflection. Thereby, selecting datasets, which are correctly indexed in proper space group, and scaling a subset of statistically equivalent datasets are extremely important to
a
b
d
c
X-ray Molecular dynamicse
f
Cytoplasm Zn2+ Ca2+ N24 D19 W20 C21 E22 E33 Membrane C196TM6 Conserved Variable 1.5 2.0 2.5 0 100 200 Time (ns) Distance (Å) E33-H81TM2 E33-Ca2+ W20 H81TM2 E33 H217TM7 W20 H81TM2 E33 H217TM7 W20 W189TM6 L18 F80TM2 TM7 TM6 TM2 TM1 TM3generate a meaningful complete dataset for structural solution. An automated software suite for serial synchrotron crystallographic data selection and merging procedure was developed at the beamline (unpublished, code availability statement: the software will be made available upon request). In order to identify correctly processed datasets, individual mini dataset wasfirst checked for indexing consistency, against user-provided reference unit-cell parameters. Then, 194 datasets, identified as correctly indexed with a = 60.8 Å, b = 68.8 Å, and c = 257.0 Å in C2221space-group, were scaled together using XSCALE35program in XDS
package. After afirst round of scaling, many datasets, which have very low ISa values (described in ref.36), were rejected against a cut-off value of 3.0. Thus, 77
datasets were selected out of 194 datasets, and scaled using XSCALE for second round. This yielded a scaled but unmerged dataset with 100% completeness at 2.7 Å resolution. The resolution cutoff was decided based on CC1/2cut-off of 0.337.
Similar procedure was applied to 297 mini-wedges of datasets (i.e., 10°/dataset) of ACER3 BRIL–Zn collected at Zn-edge (i.e., λ = 1.281 Å). Out of 297 datasets, 198 datasets were selected based on indexing consistency and ISa cutoff of 3.0. These 198 statistically equivalent datasets were scaled together using XSCALE program, yielding a scaled but unmerged dataset with 100% completeness and high multiplicity at 3 Å resolution. Later, these scaled but unmerged HKLfiles (output from XSCALE) were converted into mtzfiles for structure determination. Wilson B factors were calculated in XDS.
Structure determination and refinement. The structure of ACER3–BRIL was determined by molecular replacement. Initial phases were obtained using the BRIL molecule extracted from PDB 4RWD (chain B) as a search model in PHASER38.
After density improvement using the CCP4 program parrot39, the electron density
corresponding to ACER3 was still poor and it was only possible to build the C-terminal half of helix 7 (h71/2), which is attached to the BRIL. Subsequently, an ab
initio model of ACER3 obtained from the I-TASSER webserver30was cut into
fragments of two transmembrane helices, which were used as additional search models in PHASER while keeping the BRIL–ACER3 h71/2fragment as afixed
solution. This procedure allowed us to successfully place two, and then four transmembrane helices. This in turn provided enough phase information to enable manual rebuilding of ACER3 in COOT40, as well as autobuilding in
BUCCA-NEER41. Subsequently, the structure was refined using AUTOBUSTER42. At late
stages of refinement, translation libration screw-motion parameters generated within AUTOBUSTER were used. MolProbity was used to assess the quality of the structure43and indicated that 98% of residues were within favored Ramachandran
regions. The data collection and refinement statistics are summarized in Table1. A stereo image of a portion of the electron density map (including contour level and type of map) is presented in Supplementary Figure 9. Data refinement and analysis software were compiled and supported by the SBGrid Consortium44. The Polder
OMIT map23and the zinc difference anomalous map where calculated in
PHENIX45.
Docking calculations. Computational docking of N-Oleoyl-D-sphingosine (d18:1/ 18:1) (C18:1 ceramide) was performed with the program Protein-Ligand ANT System (version 1.2) using as a receptor our 2.7 Å structure in which all nonprotein atoms except zinc and calcium were removed. PLANTS combines an ant colony optimization algorithm with an empirical scoring function for the prediction and scoring of binding poses in a protein structure46. Ten poses were calculated and
scored by the plp scoring function at a speed setting of one. Each of the ten ligand poses actually represents the best scoring pose from a cluster of solutions. The number of iterations necessary for adequate sampling of the ligand (and optionally receptor) degrees of freedom is determined automatically by the program and for this particular system was 1387, resulting in about 5 × 10⁷scoring function
eva-luations. The binding pocket of ACER3 was defined by all residues within a 25 Å radius around the zinc atom. All other options of PLANTS were left at their default settings. The top scoring pose was selected and used as input for MD simulations. Of note, similar top scoring C18:1 ceramide binding poses were obtained using GlideXP as well as the SWISSDOCK webserver (in blind docking mode) (Supplementary Figure 5c).
System preparation and MD simulations. Three protein-ligand systems were subjected to MD simulations. We initially performed two independent simulations of unliganded ACER3 (i.e., the crystal structure in which the BRIL moiety and the monoolein were deleted—system 1) of about ~300 ns. However, in this system the absence of a bound lipid resulted in rapid water influx in the zinc and lipid binding cavity and led to destabilization of the zinc binding site (and zinc unbinding). This system was not analyzed further. Subsequently, we used a model of ACER3 in complex with the top scoring ceramide–C18:1 (d18:1/18:1) docking pose (system 2). The crystallographic zinc and calcium ions, as well as three ordered water molecules located close to the zinc binding site were included in the system. The third system was identical to system 2 except that E33 was mutated to a glycine. The WT ACER3–ceramide–C18:1 and E33G mutant MD systems were then set up using the CHARMM-GUI membrane builder47. The proteins were inserted into a
hydrated, equilibrated bilayer composed of 80 molecules of 2-oleoyl-1-palmitoyl-sn-glycero-3-phosphocholine (POPC) and 20 molecules of cholesterol in the upper leaflet, and 115 molecules of ceramide–C18:1 in the lower leaflet in order to simulate in the presence of high concentration of substrate. Similar observations were obtained in MD trajectories performed in membranes composed of roughly 116 POPC, 44 POPE, 6 sphingomyelin, 14 POPI, and 14 POPS molecules (equally partitioned between the two leaflets). This composition should be close to the endoplasmic reticulum membrane48. These MD trajectories are available upon
request.
Totally, 32 sodium and 38 chloride ions were added to neutralize the system, reaching afinal concentration of approximately 150 mM. Topologies and parameters for ceramide–C18:1 (d18:1/18:1) were available in the additive all-atom CHARMM lipid forcefield49.
MD calculations were performed in in GROMACS 2016.3 using the CHARMM36 forcefield and the CHARMM TIP3P water model. The input systems were subjected to energy minimization, equilibration, and production simulation using the GROMACS input scripts generated by CHARMM-GUI50.
Briefly, the system was energy minimized using 5000 steps of steepest descent, followed by 375 ps of equilibration. NVT (constant particle number, volume, and temperature) and NPT (constant particle number, pressure, and temperature) equilibrations were followed by NPT production runs for both systems. The van der Waals interactions were smoothly switched off at 10–12 Å by a force-switching function51, whereas the long-range electrostatic interactions were calculated using
the particle mesh Ewald method52. The temperature and pressure were held at
310.15 K and 1 bar, respectively. The assembled systems were equilibrated by the well-established protocol in Membrane Builder, in which various restraints were applied to the protein, lipids, and water molecules, and the restraint forces were gradually reduced during this process. During production simulations an NPT ensemble was used with semi-isotropic pressure coupling via the
Parrinello–Rahman barostat method while the Nose–Hoover thermostat was used to maintain a temperature of 310.15 K (as described in ref.21). A leapfrog
integration scheme was used, and all bonds were constrained allowing for a time-step of 2 ps to be used during NPT equilibration and production MD simulations. For both wild type and E33G mutant systems, we performedfive independent production runs of ~ 200 ns each. Production runs were subsequently analyzed using GROMACS tools to yield RMSD and root mean squarefluctuations.
Ceramidase activity assay. The enzymatic activity of ACER3–BRIL was mon-itored by sphingosine detection and quantification using liquid chromatography (LC) MS/MS analyses. All solvents and reagents used were of highest available purity and purchased from typical suppliers. TheD-erythro-sphingosine (d18:1), ceramide C18 (d18:1/18), and ceramide C18:1 (d18:1/18:1) used in this study were synthesized according to previous methods developed by the Arenz laboratory53.
All other lipids were purchased from Avanti Polar Lipids. Mutants were generated by site-directed mutagenesis, confirmed by DNA sequencing (MWG-Eurofins) and expressed and purified as described for the ACER3–BRIL construct. The list of primers used in this study are listed in the Supplementary Table 1.
Ceramidase activity assays were performed by incubating purified ACER3–BRIL WT or mutants (1 µM) with ceramide (20 µM) for 1 h at room temperature in 20 mM HEPES (pH 7.5), 200 mM NaCl, 0.025% (w/v) DDM, and Fig. 5 Structure and function of the N-terminus Ca2+binding site of ACER3.a Overall view of the N-terminus Ca2+binding site of ACER3 crystal structure from within the membrane plane. Residues participating in Ca2+and Zn2+coordination as well as the disulfide bond formed by C21 and C196TM6are shown as sticks with oxygen, nitrogen, and sulfur atoms red, blue, and yellow, respectively. Crystallographic water molecule next to the Zn2+ion is shown as a red sphere.b Arrangement of polar residues and the disulfide bond formed by C21 and C196TM6around the Ca2+ion in ACER3 crystal structure viewed from the intracellular side. The black dashed lines indicate polar contacts.c Overall ACER3 crystal structure (left panel) and Ca2+binding site (right panel) are shown as cartoons and colored using the Consurf color scale according to degree of conservation ranging from not conserved, cyan, to highly conserved, magenta. Conserved residues around Ca2+and Zn2+ions (green and orange sphere, respectively) are displayed as sticks.d The two residues, W20 and E33, are linking the Ca2+and the Zn2+sites by interacting simultaneously with both metal sites. The top and bottom panels represent the observed structure and the initial pose of the MD simulation, respectively.e Panel showing the minimum distances between E33 carboxylate and H81TM2 side chain or Ca2+during MD simulations, reflecting the observed hydrogen bond network. f Hydrophobic network around W20 side chain forming the bottom part of the putative ceramide pocket
0.0001% (w/v) CHS. Reactions were quenched by addition of methanol (final concentration 30%) which contained 68.5 pg of the internal standard, sphingosine (d17:1).
Lipids were extracted from reaction samples using the previously reported method54. Briefly, a mixture of dichloromethane/methanol (2% acetic acid)/water
(2.5:2.5:2 v/v/v) was added to each reaction and the solution was centrifuged. The organic phase was collected and dried under nitrogen, then dissolved in 10 µL of MeOH. The lipid extract was stored at−20 °C before LC–MS/MS analysis.
LC-MS/MS analysis of formed sphingosine was performed using an Agilent 1290 Infinity. The samples were separated on an Acquity UPLC BEH-C8 column (particle size 1.7μm, 2.1 × 100 mm) (Waters) maintained at 35 °C. The mobile phases consisted of eluent A (99.9% H2O: 0.1% HCOOH, v/v) and eluent B (99.9%
CH3CN: 0.1% HCOOH, v/v). The gradient was as follows: 50% B at 0 min, 60% B
at 2 min, 60% B at 3 min, 100% B at 4 min, 100% B at 8.5 min and 50% B at 9 min. Theflow rate was 0.3 mL/min. The auto sampler was set at 5 °C and the injection volume was 5 µL. The HPLC system was coupled on-line to an Agilent 6460 triple
b
d
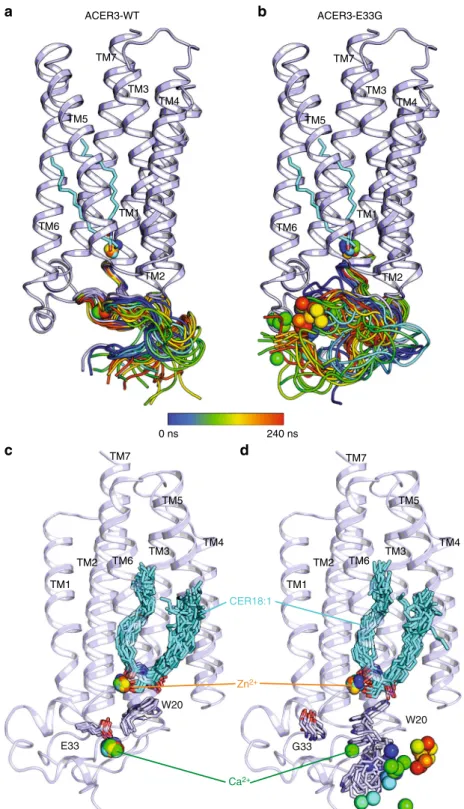
0 ns 240 ns Ca2+ W20 CER18:1 E33 W20 G33 Zn2+ ACER3-WT ACER3-E33G TM7 TM6 TM5 TM3 TM2 TM1 TM4 TM7 TM6 TM5 TM3 TM2 TM1 TM4 TM7 TM6 TM5 TM3 TM2 TM1 TM4 TM7 TM6 TM5 TM3 TM2 TM1 TM4a
c
Fig. 6 MD simulations of ACER3 wild-type and E33G mutant Snapshots of the calculated N-terminus domain trajectories during a 240 ns long MD simulation (from blue to red, taken every 10 ns) for the wild-type (a) or E33G mutant (b) showing that the mutation leads to a more dynamic/unstable N-terminus domain.c, d Snapshots of the ACER3 wt (c) or E33G mutant (d) showing the key ligands (Cer18:1, Zn2+and Ca2+) and contacting residues (shown as sticks) trajectories during a 200 ns long MD simulations colored as above and highlighting the motion/instability of the W20 side chain and of the Ca2+in the E33G mutant (d) in contrast to the wild-type ACER3 (c)
quadrupole MS equipped with electrospray ionization source operated in positive ion mode. The source parameters used were as follows: source temperature was set at 300 °C, nebulizer gas (nitrogen)flow rate was 10 L/min, sheath gas temperature was 300 °C, sheath gas (nitrogen)flow rate was 12 L/min and the spray voltage was adjusted to+4000 V. The collision energy optimums for sphingosine (d17:1) and sphingosine (d18:1) were 5 eV. Analyses were performed in selected reaction monitoring detection mode using nitrogen as collision gas. Peak detection, integration and quantitative analysis were done using MassHunter QqQ Quantitative analysis software (Agilent Technologies) and Microsoft Excel software.
Sphingosine (d18:1): precursor ion m/z= 300.5 and product ion m/z = 282.5. Sphingosine (d17:1): precursor ion m/z= 286.5 and product ion m/z = 268.5. The presented data for enzymatic activity are representative of three experiments performed on three independent ACER3–BRIL enzyme preparations and two independent mutants’ preparations, each experiment contained five or six replicates.
TR-FRET experiments in living cells. YFP-ADIPOR2 was kindly provided by the laboratory of Dr. Vazquez-Martinez. For the ADIPOR2-YFP construct, full-length AdipoR2 was inserted in frame of the N terminus of the YFP in pcDNA 3.1-YFP by PCR using the following specific oligonucleotides: forward 5′ TAAGCAGCTAGC ATGAACGAGCCAACAGAAAACC 3′ and reverse 5′ TAAGCAAAGCTTCA GTGCATCCTCTTCAC 3′. Full-length ACER3 was inserted in frame of the N terminus of the SNAP tag in the pSNAPf vector (New England Biolabs) by PCR using the following specific oligonucleotides: 5′ AAACGCTAGCGATATCATGG ACTACAAGGACGACGACGACAAGGCTCCTGCAGCTGACAG 3′ as forward and 5′ TATGCAACCGGTGTGCTTCCTCAAGGGCT 3′ as reverse.
HEK293 cells were grown in Dulbecco's Modified Eagle Medium supplemented with 10% fetal bovine serum and antibiotics at 37 °C, 5% CO2. Lipofectamine
2000-based reverse transfection were performed in polyornithine coated black-walled, dark-bottom, 96-well plates. We used 30 ng of ACER3–SNAP tag with either 50 ng of YFP-ADIPOR2, ADIPOR2-YFP, or empty PRK6 as control and 105cells per well.
After 24 h transfection cells werefixed with 3.6% PFA and permeabilised with 0.05% Triton X100. Then, intracellular ACER3–SNAP was labeled with BG-Lumi4-Tb (300 nM) for 1 h at 37 °C and after several washes, YFP and lumi4fluorescence signals were observed on an Infinite 500 (Tecan, Seestrasse, Switzerland). The signal was collected both at 520 nm and 620 nm (10flashes, 400 µs integration time, 150 µs lag time). Background values from nontransfected cells were removed from raw data in each channel. Subsequently, the normalized time resolved FRET ratio was obtained by dividing the specific acceptor signal at 520 nm by the specific donor signal at 620 nm data and plotted using GraphPad Prism (GraphPad Software, Inc., San Diego, CA).
Code availability. An automated software suite for serial synchrotron crystal-lographic data selection and merging procedure was developed at the beamline (unpublished, the software will be made available upon request).
Reporting summary. Further information on experimental design is available in the Nature Research Reporting Summary linked to this article.
Data availability
Data supporting thefindings of this manuscript are available from the corre-sponding authors upon reasonable request. Coordinates and structure factors for the ACER3-BRIL structure have been deposited in the Protein Data Bank under accession number 6G7O.
Received: 12 June 2018 Accepted: 3 December 2018
References
1. Hannun, Y. A. & Obeid, L. M. Sphingolipids and their metabolism in physiology and disease. Nat. Rev. Mol. Cell Biol. 19, 175–191 (2018). 2. Ogretmen, B. & Hannun, Y. A. Biologically active sphingolipids in cancer
pathogenesis and treatment. Nat. Rev. Cancer 4, 604–616 (2004). 3. Coant, N., Sakamoto, W., Mao, C. & Hannun, Y. A. Ceramidases, roles in
sphingolipid metabolism and in health and disease. Adv. Biol. Regul. 63, 122–131 (2017).
4. Nikolova-Karakashian, M. & Merrill, A. H. Jr. Ceramidases. Methods Enzymol. 311, 194–201 (2000).
5. Kohama, T. et al. Molecular cloning and functional characterization of murine sphingosine kinase. J. Biol. Chem. 273, 23722–23728 (1998).
6. Koch, J. et al. Molecular cloning and characterization of a full-length complementary DNA encoding human acid ceramidase. Identification of the first molecular lesion causing Farber disease. J. Biol. Chem. 271, 33110–33115 (1996).
7. Gebai, A., Gorelik, A., Li, Z., Illes, K. & Nagar, B. Structural basis for the activation of acid ceramidase. Nat. Commun. 9, 1621 (2018).
8. El Bawab, S. et al. Molecular cloning and characterization of a human mitochondrial ceramidase. J. Biol. Chem. 275, 21508–21513 (2000). 9. Airola, M. V. et al. Structural basis for ceramide recognition and hydrolysis by
human neutral ceramidase. Structure 23, 1482–1491 (2015).
10. Sun, W. et al. Upregulation of the human alkaline ceramidase 1 and acid ceramidase mediates calcium-induced differentiation of epidermal keratinocytes. J. Invest. Dermatol. 128, 389–397 (2008).
11. Xu, R. et al. Golgi alkaline ceramidase regulates cell proliferation and survival by controlling levels of sphingosine and S1P. FASEB J. 20, 1813–1825 (2006). 12. Mao, C. et al. Cloning and characterization of a novel human alkaline
ceramidase. A mammalian enzyme that hydrolyzes phytoceramide. J. Biol. Chem. 276, 26577–26588 (2001).
13. Sun, W. et al. Substrate specificity, membrane topology, and activity regulation of human alkaline ceramidase 2 (ACER2). J. Biol. Chem. 285, 8995–9007 (2010).
14. Hu, W. et al. Alkaline ceramidase 3 (ACER3) hydrolyzes unsaturated long-chain ceramides, and its down-regulation inhibits both cell proliferation and apoptosis. J. Biol. Chem. 285, 7964–7976 (2010).
15. Edvardson, S. et al. Deficiency of the alkaline ceramidase ACER3 manifests in early childhood by progressive leukodystrophy. J. Med. Genet. 53, 389–396 (2016).
16. Wang, K. et al. Alkaline ceramidase 3 deficiency results in purkinje cell degeneration and cerebellar ataxia due to dyshomeostasis of sphingolipids in the brain. PLoS Genet 11, e1005591 (2015).
17. Wang, K. et al. Alkaline ceramidase 3 deficiency aggravates colitis and colitis-associated tumorigenesis in mice by hyperactivating the innate immune system. Cell Death Dis. 7, e2124 (2016).
18. Chen, C. et al. ACER3 supports development of acute myeloid leukemia. Biochem. Biophys. Res. Commun. 478, 33–38 (2016).
19. Rosenbaum, D. M. et al. GPCR engineering yields high-resolution structural insights into beta2-adrenergic receptor function. Science 318, 1266–1273 (2007).
20. Chu, R. et al. Redesign of a four-helix bundle protein by phage display coupled with proteolysis and structural characterization by NMR and X-ray crystallography. J. Mol. Biol. 323, 253–262 (2002).
21. Vasiliauskaite-Brooks, I. et al. Structural insights into adiponectin receptors suggest ceramidase activity. Nature 544, 120–123 (2017).
22. Cumming, R. C. et al. Protein disulfide bond formation in the cytoplasm during oxidative stress. J. Biol. Chem. 279, 21749–21758 (2004).
23. Liebschner, D. et al. Polder maps: improving OMIT maps by excluding bulk solvent. Acta Crystallogr D Struct. Biol. 73, 148–157 (2017).
24. Hernick, M. & Fierke, C. A. Zinc hydrolases: the mechanisms of zinc-dependent deacetylases. Arch. Biochem. Biophys. 433, 71–84 (2005). 25. Pei, J., Millay, D. P., Olson, E. N. & Grishin, N. V. CREST—a large and diverse
superfamily of putative transmembrane hydrolases. Biol. Direct 6, 37 (2011). 26. Cauet, E., Rooman, M., Wintjens, R., Lievin, J. & Biot, C. Histidine–aromatic
interactions in proteins and protein-ligand complexes: quantum chemical study of X-ray and model structures. J. Chem. Theory Comput. 1, 472–483 (2005).
27. Villa, N. Y. et al. Sphingolipids function as downstream effectors of a fungal PAQR. Mol. Pharmacol. 75, 866–875 (2009).
28. Tang, Y. T. et al. PAQR proteins: a novel membrane receptor family defined by an ancient 7-transmembrane pass motif. J. Mol. Evol. 61, 372–380 (2005). 29. Langer, G. A. The effect of pH on cellular and membrane calcium binding and contraction of myocardium. A possible role for sarcolemmal phospholipid in EC coupling. Circ. Res. 57, 374–382 (1985).
30. Yang, J. & Zhang, Y. I-TASSER server: new development for protein structure and function predictions. Nucleic Acids Res. 43, W174–W181 (2015). 31. Caffrey, M. & Cherezov, V. Crystallizing membrane proteins using lipidic
mesophases. Nat. Protoc. 4, 706–731 (2009).
32. Huang, C. Y. et al. In meso in situ serial X-ray crystallography of soluble and membrane proteins. Acta Crystallogr D Biol. Crystallogr. 71, 1238–1256 (2015).
33. Wojdyla, J. A. et al. Fast two-dimensional grid and transmission X-ray microscopy scanning methods for visualizing and characterizing protein crystals. J. Appl. Crystallogr. 49, 944–952 (2016).
34. Wojdyla, J. A. et al. DA+ data acquisition and analysis software at the Swiss Light Source macromolecular crystallography beamlines. J. Synchrotron Radiat. 25, 293–303 (2018).
35. Kabsch, W. XdsActa Crystallogr. D Biol. Crystallogr 66, 125–132 (2010). 36. Diederichs, K. Quantifying instrument errors in macromolecular X-ray data
sets. Acta Crystallogr D Biol. Crystallogr 66, 733–740 (2010).
37. Karplus, P. A. & Diederichs, K. Linking crystallographic model and data quality. Science 336, 1030–1033 (2012).
38. McCoy, A. J. et al. Phaser crystallographic software. J. Appl. Crystallogr. 40, 658–674 (2007).