Design and Manufacture Study of Ocean Renewable Energy
Storage (ORES) Prototype
by G6khan Dtndar
B.S. Mechanical Engineering Turkish Naval Academy, 2006
Submitted to the Department of Mechanical Engineering in partial fulfillment of the requirement for the degree of
Master of Science in Mechanical Engineering
at the
Massachusetts Institute of Technology
June 2012
©2012 Gbkhan Dfindar. All rights reserved.
ARCHIVES
|MASSACHUSETTS INSTUTE' OF TECHNOLOGY
JUN
2
8
2012
LBRARIES
The author hereby grants to MIT permission to reproduce and to distribute publicly paper and electronic copies of this thesis document in whole or in part in any
medium known or hereafter created.
k Signature of Author:
K)i
Department of Mechanical Engineering11 May 2012
Certified by:
Alexander H. Slocum Pappalardo Professor of Mechanical Engineering Thesis Supervisor
Accepted by:
David E. Hardt Ralph E. and Eloise F. Cross Professor of Mechanical Engineering Chairman, Committee for Graduate Students
"Hayatta en hakiki mUrgit ilimdir, fendir." Mustafa Kemal Atatirk
Design and Manufacture Study of Ocean Renewable
Energy Storage (ORES) Prototype
By
Gbkhan Dtindar
Submitted to the Department of Mechanical Engineering on May 11, 2012 in Partial Fulfillment of the Requirements for
the Degree of Master of Science in Mechanical Engineering
Abstract
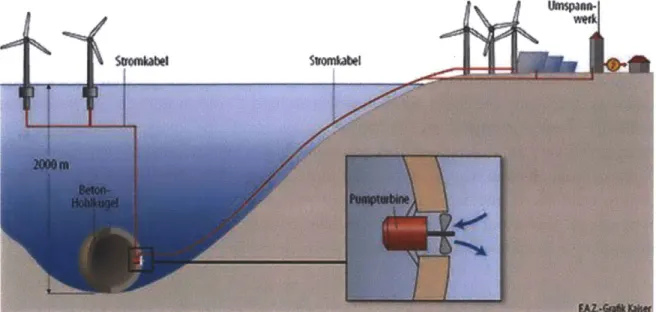
Utility scale energy storage is needed to balance rapidly varying outputs from renewable energy systems such as wind and solar. In order to address this need, an innovative utility scale energy storage concept has been created by the Precision Engineering Research Group (PERG) at MIT. The concept is to build hollow concrete structures to act as lower reservoir, install pump/turbine units, deploy them under the ocean and use the hydrostatic pressure of the water column as an upper reservoir to run the turbine and generate electricity, and pump the water out of the structure to store energy. The result is similar to a conventional Pumped Storage Hydroelectric (PSH) facility that operates on land using lakes and dams.
Evolution of the ORES project will be presented and design iterations discussed in detail. Each design option is evaluated to better understand advantages and disadvantages. Concrete related tests were conducted to develop manufacturing process and evolve design assumptions. Global sites are evaluated for ORES deployment including an intensive study on the Mediterranean and Japan.
Our research shows that storing energy underwater is technically and economically feasible and has great potential. Our geographical evaluations show that the Gulf of Maine, off coast of California, Hawaii, Mediterranean and Japan have great potential for both wind and ocean depths that favor ORES deployment.
Thesis Supervisor Alexander H. Slocum
Acknowledgements
I hereby want to acknowledge:e My advisor Prof Alex Slocum for his insights with the project, ability to solve design and
engineering problems and continuous support during my life at MIT. He is not only a professor but more than that a role model, a mentor and a sportsman. Thank you for your guidance and hospitality. I hope to see you in Turkey for a diving trip!
e Turkish Navy for financially supporting me during my education. I had two childhood
dreams, being an officer and coming to MIT. Thank you for making this possible. I am very proud of being a Turkish Naval Officer.
* Brian Hodder, for his friendship, hospitality and ability to look at the project from a broader perspective. He also had continuous support during my masters and made this experience unique for me. Thank you for editing and challenging my thesis.
e Gregory Fennell, James Meredith it was a pleasure to work with you. Elie Homsi from
Flatiron, Christoph Lay and Andreas Garg from Hochtief for their continuous input and bringing up solutions to the project challenges. Nevan Hanumara, Folkers Rojas and my lab mates, Precision Engineering Research Group. We established such a concrete relationship. It was a pleasure to meet and work with you.
e My great family, my mother Sevgi, my father Mustafa and brother
Ozgur.
I am verylucky for having such a loving and caring family. This wouldn't be possible without your continuous support and ability to calm me down. Your guidance enlightened my way. * And finally my fiance Emine. I am sorry for being away from you for two years but I
hope this will enforce our relationship and provide us better opportunities in the future. Thank you for your continuous support. You are the reason for me to stick to my goal.
Table of Contents
A cknow ledgem ents...5
Table of Contents...7 List of Figures ... 9 List of Tables ... 11 N om enclature...12 C p. Introduction ... 14 1.1. M otivation... 14 1.2. Thesis Outline ... 15
Chp 2. N eed for Energy Storage... 16
2.1. Energy Storage Technologies ... 22
2.1.1. Pum ped Storage Hydroelectric (PSH) ... 22
2.1.2. Com pressed Air Energy Storage (CA ES) ... 24
2.1.2. 1. Huntorf Air Storage Gas Turbine Pow er Plant... 26
2.1.2.2. M cIntosh - The Pow erSouth CA ES Plant... 28
2.1.3. Therm al M ass CAES ... 29
2.1.4. Innovative PSH or CAES Applications ... 31
Chp 3. ORES ... 33
3.1. Early Stages and Operating Concept of ORES... 33
3.2. Innovating for M anufacturability ... 36
3.3. Vertical H em ispheres... 39
3.4. Inner Balloon M ethod... 43
3.5. Consum able Steel M old... 47
3.6. Shotcrete use in ORES... 49
3.7. Bottom H em isphere and Rings... 52
Clp 4. A lternative Geom etry ... 54
4.1. Capacity Calculations ... 55
Chp 5. 3m Zorb Ball Concrete Pouring Experim ents... 57
5.1. Introduction and Purpose... 57
5.2. The H ypothesis ... 58
5.3. M aterials and M ethods... 58
5.4. D ata and Results ... 63
5.5. Conclusion ... 67
Clp 6. G lobal ORES Deploym ent... 68
6.2. Europe, M editerranean and A egean Sea... 73
6.3. A sia ... 80
Clp 7. Concluding Rem arks... 85
7.1. D esign A ssessm ent... 85
7.2. Zorb Ball and Concrete Test Results ... 86
7.3. Further Study and N ext Steps ... 86
Chp 8. References...88
C p 9. Appendix...92
List of Figures
Figure 1 Dispatch profile of power plants [4]... 17
Figure 2 Electricity price at Node MURRAY_6_NO15 for February 13th, 2011[5]... 18
Figure 3 Graph of typical load-leveling (a.k.a. peak-shaving) ... 18
Figure 4 Energy storage technologies with respect to their storage capacities and discharge rates (S ou rce:[8]) [7 ] ... 22
Figure 5 Diagram of Raccoon mountain Pumped Storage Plant (http://www.tva.gov/power/pumpstorart.htm)... 23
Figure 6 Superimposed image of high wind resources map and geologically available regions for CA ES installations in Europe [14]... 25
Figure 7 Superimpose of high wind resources with geologically available regions for CAES installations in U S [14]... 25
Figure 8 Schematic of Huntorf Air Storage Gas Turbine Power Plant... 27
Figure 9 Schem atic of M cIntosh Power Plant ... 28
Figure 10 Process Flow Diagram (PFD) of Thermal mass CAES... 30
Figure 11 Underwater Compressed Air Electrical Storage - Hydrostor (source: [22]) ... 31
Figure 12 Schmidt-B6cking & Luther's hollow sphere energy storage device (source:[23])... 32
Figure 13 Initial conical energy storage platform co-located with offshore energy harvesters by Prof. A lexander Slocum ... 33
Figure 14 Evolution of ORES project... 34
Figure 15 ORES operating concept acting as anchorage for Tension Leg Platform... 34
Figure 16 ORES energy capacity as a function of depth and diameter ... 35
Figure 17 ORES spheres used as catenary mooring for FWTs [27]... 36
Figure 18 Revision of conical cradle for ORES sphere [26]. (Previous design on the left, updated design on the right) ... 37
Figure 19 Examples of low bed heavy duty trailers carrying ship segments (on the left) and bridge/tunnel segments (on the right) (source:ttnet.net)... 39
Figure 20 Multiple-stave sphere (on the left) compared to hemisphere design (on the right) (credit A lex Slocum )... 40
Figure 21 Male-female fitting of bottom part and contact surfaces of staves ... 40
Figure 22 Exploded view of mold assembly describing key features ... 41
Figure 23 Vertical hemisphere with a boss to mount rotating equipment ... 42
Figure 24 Vertical hemisphere with inclined boss and 50 draft angle to mitigate demolding p rob lem s... 4 2 Figure 25 Schematic of RAS showing male-female joint (source: http://www.rolls-royce.com/marine/products/deck machinery/dm naval/ras/)... 43
Figure 26 22cm ID plaster sphere using inner balloon method. Threads for maintaining the concentricity is shown on the right picture (credit: James Meredith)... 44
Figure 27 Displacement of rubber balloon filled with water and fully submerged into wet co n crete ... 4 5 Figure 28 Types of drilling fluids and corresponding densities with respect to composition (source :( The University of Texas at Austin -Petroleum Extension Service, 1969)) ... 46
Figure 29 Cross section of ORES shotcrete concept ... 50
Figure 30 Automatically executed shotcrete (on the left Source: http://www.multicretesystems.com/shotcrete) and shotcrete dome (on the right source: http://www.reedpumps.com/concretedomes.htm) ... 51
Figure 31 Spiral cage steel reinforcement and cooling system... 52
Figure 32 Solid model of ORES sphere comprised of rings... 53
Figure 33 MV Blue marlin carrying USS Cole after a terrorist attack in Yemen ... 54
Figure 34 Maximum deployment depth as a function of wall thickness according to both thin-w all and thick-thin-w all assum ptions... 55
Figure 35 Zorb ball (3.6m OD, 3m ID) being tested in Lobby 7, MIT ... 57
Figure 36 Heat of hydration: Type I cement (Copyright ASTM International) [41]... 59
Figure 37 Cracks due to changing mold geometry ... 60
Figure 38 SW model of Zorb ball with pipe installations... 60
Figure 39 SW of Zorb ball resting on the cradle/base ... 61
Figure 40 Wooden reinforced gate (on the left SW model, real gate on the right) ... 62
Figure 41 1st Principal stress and displacement of wooden gate under 3.5 psi... 62
Figure 42 Offshore wind potential of US at 90m height (source: [43])... 69
Figure 43 US coast bathymetric chart (source: [43])... 69
Figure 44 Gulf of Maine ORES deployment site. Total surface are available for ORES deploym ent is 2,230km 2 ... . . . .. . . 70
Figure 45 New York and New Jersey ORES deployment site. Total surface area in 200-750m depths range is 1,000km 2 ... ... ... ... ... . . 70
Figure 46 ORES on south east US, Florida, South Carolina. Total surface area is 41,160km2 ... 71
Figure 47 Regions available for possible ORES deployment in Gulf of Mexico have a total of 25,929km2 surface area, and 50NM away from shore... 71
Figure 48 San Diego ORES deployment site has a total of 223km2 surface area with depths ranging 200-750m and is 5NM away from shore ... 72
Figure 49 Los Angeles possible deployment sites have 2263km2 2NM away and 257 km2 15NM aw ay from shore... 72
Figure 50 Possible Hawaii deployment site is 2NM away from shore and has a 206km2 surface area ... 7 3 Figure 51 Onshore and offshore wind installations in Europe (source:[44])... 75
Figure 52 European offshore wind atlas (source: Copyright C 1989 by Ris0 National Laboratory, R oskilde, D enm ark)... 76
Figure 53 Western Europe has two possible deployment sites a total of 3086km2 and 20 to 1 OON M aw ay from shore ... 77
Figure 54 Bay of Biscay deploym ent site ... 77
Figure 55 North Mediterranean deployment opportunities ... 78
Figure 56 Turkish Wind atlas (power density at the top and wind speed at the bottom) (source: w w w .dm i.gov .tr)... 79
Figure 57 Western Aegean Sea, Kusadasi Bay, Izmir deployment site (Turkey) ... 79
Figure 58 Saros Bay and Balikesir deployment site (Turkey)... 80
Figure 59 Eastern Mediterranean, Iskenderun Bay deployment site (Turkey)... 80
Figure 60 N uclear plants in Japan... 81
Figure 61 Bathym etry near Fukushim a... 82
Figure 62 Bathymetry near Chubu Electric -Hamaoka... 83
Figure 63 Bathymetry near Tokai Daini plant ... 83
List of Tables
Table 1 Types, capacity and cost of transmission lines (source:[6]) (all costs are $million/mi
unless otherw ise stated) ... 19
Table 2 Economic benefits of energy storage [7] ... 21
Table 3 Installed PSH capacity of EU countries [10], US [11], China [12] and Japan [13] ... 24
Table 4 Specifications of Huntorf Power Plant ... 27
Table 5 Specifications of ADELE CAES Plant... 30
Table 6 Storage capacity and volume calculations of ORES (an updated study of [30])... 38
Table 7 Volume and cost estimates of disposable steel mold... 48
Table 8 Underwater energy storage cylinder stress and capacity calculations under thick-wall assumption (credit: Alexander H. Slocum)... 56
Table 9 Top ten wind installations around the world ... 74
Table 10 Global offshore wind installations... 74
Table 11 Nuclear plants in Japan (credit: Brian Hodder) ... 81
Nomenclature
Variable Unit Description
h m Head. Height of water column. r/ Eta. Efficiency
p kg/m3 Density
D m Diameter
R m Outer radius
r n Radius
FoS Factor of Safety
t n Wall thickness
£ Joules Energy (unless otherwise stated)
kW W Kilowatt
MW W Megawatt
MWh Wh Megawatt-hour
mt Metric tonne
Psi Pound per square inch
Pa N/m2 Pascals
kPa 1E3 Pa Kilopascal
MPa 1E6 Pa Megapascals
W mt Weight
V Volume
NM Nautical miles (1852m)
a K:I Coefficient of thermal expansion
p Pa.s Viscosity P Pa Pressure T Kelvin Temperature g 2 Gravitational acceleration A iM2 Area L m Length a Pa Stress F N Force
Chp.1
Introduction
1.1.
Motivation
Demand for energy has been growing rapidly and is projected to continue increasing in the 21th century. Due to increasing oil prices, political instability on the supply side, need for a higher quality grid and rising environmental concerns more and more renewable energy is being installed. Wind followed by solar PV are the two major sources which accounts for 84% of global renewable investment in 2010 [1]. However these technologies, particularly wind, bring problems. As a result of the uncontrollable character of these resources, the biggest challenge is
the mismatch between the energy generated and the demand.
Recent studies on offshore wind show that better wind profiles exist and higher capacity factors can be achieved farther offshore [2]. There have been numerous studies on Floating Wind Turbines (FWTs) to exploit higher winds offshore. Even though higher winds can be utilized with proposed technologies, an energy storage capability will increase the real value of offshore wind. Furthermore these technologies will require anchors to stay in their projected places. Two different anchorage systems are envisioned to be used depending on the application, catenary mooring or Tension Leg Platform (TLP). Each of the anchoring system will have different requirements.
In order to address two major challenges for the offshore wind a utility scale energy storage project, Ocean Renewable Energy Storage (ORES) is developed as the focus of this thesis. Made from concrete, these structures can store energy for offshore wind for future use and can be connected to FWTs to meet the requirements for anchorage systems. While providing storage to increase the value of the renewable energy, the ORES system can also serve as anchorage systems thus share costs to reduce total system cost.
1.2.
Thesis Outline
Chapter 2 will primarily discuss about need for energy storage and introduce utility scale energy storage technologies. In addition to commercially viable applications, innovative approaches and recent studies are going to be discussed in detail.
Chapter 3 is going to review evolution of ORES simulations and analysis.
Chapter 4 is going to analyze cylindrical tubes as spherical approach. Capacity and volume calculations spherical approach.
Chapter 5 will provide information about research results, experience gained and lessons learned.
project, design features, calculations,
an alternative geometry to the current will be presented and compared to
we have done related to concrete, test
Chapter 6 will present possible deployment sites around globe will discuss in detail and preliminary analysis of sites.
In conclusion lessons learned will be summarized and next steps will be proposed for the ORES project.
Chp 2.
Need for Energy Storage
Utility scale energy storage is essential for various reasons primarily, load leveling, frequency regulations and transmission deferral. Power plants are dispatched according to merit order. Coal and nuclear plants from conventional sources and hydroelectric, geothermal, biomass and solar thermal with energy storage, from renewable sources are technologies which act as baseload plants. Baseload plants are used to satisfy the minimum continuous energy demand of a specific demand center. They can operate almost entire year and are stopped only because of maintenance. These plants have a long ramp-up time, which means they require long time to operate in their highest design efficiencies. Baseload plants operate in their most efficient output and generate constant power output thus electricity produced from these plants is relatively cheaper to other energy generating plants. Since these plants are designed to meet constant demand throughout the year and do not meet the instant demand changes additional power plants are required to meet the changing demand in the grid.
Intermediate plants, also known as load following power plants, are dispatched to meet the extra demand on the grid which baseload plants cannot satisfy. They have faster ramp-up times compared to baseload plants and can be operational within minutes to hours. Depending on the technology they can operate for long periods like baseload plants however are not designed to run almost during the entire year. Boiling Water Reactors (BWR), steam turbines, some of the gas turbines and hydroelectric plants are examples of intermediate plants. They start generating electricity hours before expected demand increase (i.e. before air conditioning makes peak) and stop after demand decreases. These plants are usually turned on and off daily to meet daily demands. However additional fast ramp-up power plants are required to meet peak demands.
Peak power plants, also known as peaker plants, are designed to meet only the peak demand. They are dispatched in cases where baseload plants and intermediate plants are operational yet cannot satisfy the peak demand. Even though these plants are used very rarely they are required in case of unpredicted spikes in the demand. 10% of the total electricity generating capacity, which is the peaker plants, is used only 50 hours a year [3]. Natural Gas (NG) turbines are generally used to meet the peak demand. They have very short ramp-up times and can be fully operational and synchronized with the grid within minutes. They are dispatched only to meet the peak demand and are turned off after demand is satisfied. The cost of electricity which peak plants produce is higher than intermediate and baseload plants.
Different levels of power plants are dispatched to meet the demand thus the price of electricity will be strongly correlated to demand. Utilities would use load leveling (a.k.a. peak-shaving) to store cheap energy from the baseload plants primarily, coal and nuclear plants, during off-peak times and release it when there is high demand and prices are high. Storage also
reduces the need for short-ramping-time expensive NG turbines. Dispatchability profile by power plants is shown in Figure 1.
Figure 1 Dispatch profile of power plants [41
Energy price corresponding to dispatched plants is shown in Figure 2. Figure 1 shows that the peak demand at 18.00 is satisfied by dispatching all baseload plants, intermediate plants and peaker plants, and the corresponding electricity price is also at a peak Figure 2.
Price
300
0 3 6 9 12 25 is 21 24
Figure 2 Electricity price at Node MURRAY_6_N015 for February 13th, 2011[5]
In order to lower the electricity price at peak times, cheap energy produced by baseload plants or renewables; namely wind, geothermal, tidal and current, during the off-peak times is stored in either PSH, CAES or advanced batteries in utility scale. A typical schematic for load leveling can be seen in Figure 3.
Peak-shaving
60000 50000 40000 30000 20000 10000 0-0+-25 Jun Texas Demand
-4-110% lowest demand
line
-- Peak-shaving line
1 3 5 7 9 11 13 15 17 19 21 23 Time
Figure 3 Graph of typical load-leveling (a.k.a. peak-shaving)
Another reason for storage is transmission deferral. Transmission line installations are very expensive and are subject to strict and complicated legal permitting. In addition depending on the location and coverage of the project it can be bound by multiple states legislations as well as federal legislations. Even though there have been numerous studies on transmission line installations there is not a universal agreement on absolute cost of transmission lines due to the
high number of variables. Most of this variation is highly because of different types (underwater, AC or DC) and various capacities (800kV, 765kV, 500kV, 345kV, 230kV and 115kV) of the lines. An extensive research conducted by Lawrence Berkeley National Laboratories shows that the cost for transmission lines range from $0.3-$2 million/mile [6]. The result of the study can be
seen in Table 1.
Table 1 Types, capacity and unless otherwise stated)
cost of transmission lines (source: [6]) (all costs are $million/mi
Average Number of
Transmission Lines Minimum Cost Cost Maximum Cost Sampes
Cost Samples 765 kV (no description) 2.0 3.2 5 500 kV (single circuit) 1.5 2.2 6 500 kV (double circuit) 2.0 3.5 5 500 kV (no description) 0.8 2.6 10 HVDC Line (800kV) 3.7 1 HVDC Line (345 - 500kV) 1.1 3.0 8 HVDC Undersea Cable 4.0 1 345 kV (single circuit) 0.6 1.5 4 345 kV (double circuit) 1.0 2.3 5 345 kV (no description) 0.5 2.2 10 230 kV (double circuit) 2.0 1 230 kV (no description) 0.3 1.6 6 230 kV (rebuild/reconductor) 0.5 1 115 kV (no description) 0.2 0.4 2 115kV (rebuild/reconductor) 0.1 0.3 2 115 kV (uprate) 0.05 0.4 2 Associated Equipment HV Substations ($/unit) 10 60 6 DC Terminal ($/MW) 0.1 0.2 4 DC Terminal ($/unit) 250 500 5
If there is a transmission bottleneck a solution is to build more transmission lines. Instead
of building costly transmission lines the problem can also be addressed by building a storage device on the demand side of the bottleneck. Therefore when demand exceeds the transmission capacity stored energy is released to satisfy the demand. An additional solution is "Demand
Response" (DR). When demand approaches critical levels and energy price spikes, consumers are encouraged to reduce their energy consumptions to decrease peak price and mitigate grid response problems. Customers are then compensated according to the reduction they make during the peak times. Even though these approaches are very innovative and a part of smart grid these scenarios are out the scope of this project and will not be discussed in detail.
The third reason for utility scale energy storage is efficient integration of higher levels of renewable energy, particularly wind power. The main disadvantage of intermittent renewable energy technologies, solar PV, solar thermal, wind, wave current and tidal, is the fact that there is a mismatch between demand and supply as demand is consistent according to diurnal and seasonal changes (peak in summer and afternoons) but supply (wind, wave) is dependent upon uncontrollable natural forces. Furthermore these power plants are not dispatchable. The intermittency problem can be answered by having spinning reserves connected to and synchronized with the grid and fast ramping power plants such as Advanced NG. However without a proper storage technology non-dispatchability of aforementioned energy resources remains still. Installing sufficient storage will increase the real value of renewables and allow them to be used in case of need. This supplementary capability can make a difference in the energy industry. Table 2 summarizes an extensive study conducted by national renewable energy laboratory which reveals the value of storage with respect to corresponding purposes [7].
Table 2 Economic benefits of energy storage [7]
Discharge capacity Benefit I Potential
Dsaratl.n* I (Power' kW M1W~I (tAWI** (MW. 10 Yas)
Economy
tomnfni t
# Benefit Type Low High Low High Low High CA U.S. CA U.S.
1 Oectric Energy Time-sift 2 8 1 MW 500 MW 400 700 1,445 18%41 795 10,129 2 ilectricSupp1y Cepeity 4 6 1 MW 500 MW 359 710 1,445 18,417 772 9,838
3 Load FoIeling 2 4 1 MW 500 MW 600 1,000 2,889 36,834 2,312 29,467
4 Area Regulstion 15 min. 30 MMu. 1 MW 40 MW 785 2,010 00 1,012 112 1,415
5 Eleutrlc Supply Resere Capacity 1 2 1 MW 500 MW 57 225 636 5,96 90 844
6 Votage Support 15 min. 1 1 MW 10 MW 400 722 9,209 433 5,S25
7 Transssio Support 2 sec. 5 sc. 10 MW 100 MW 192 1,084 13,813 206 2,646 $ Tranaissaw Congesnon Ref 3 6 1 MW 100 MW 31 141 2,889 36834 246 3,168 9.1 Decenilett & a 3 6 250 kW 5 MW 481 687 306 4,986 226 2,912
______ __
9.2 T6 Upgrae 00ewu1 9t 3 6 250 kw 2 MW 759 1,079 77 997 71 916
10 SubstatOn On-site Power 8 16 1.5 kW 5 kW 1,100 3,000 20 250 47 600
11 Time-of-us Energy Cost Managemnt 4 6 1 kW 1 MW 1,226 5,038 64,228 6,177 78,743
12 Demand Charge Munagement 5 11 50 kW 10 MW 582 2,519 32,111 1,466 18,695
13 Bectric Servle ReNsbtry 5 mna. 1 0.2kW 10 MW 359 976 722 9,209 483 6,154 14 Electric Service Power Quaity 10 sc. 1 nmn. 02 kW 10 MW 359 978 722 9,209 463 6,154
15 Rensasles Energy Tne-slit 3 5 1kW 500 MW 233 30 2.100 36,834 899 11,455
16 RenWsMes CapctRy Firming 2 4 1kW 500 MW 709 915 2,889 36,834 2,346 29,909 17.1 __Short Wid Ge'woi Ii Ouration_________ 10 sc. 15 min. 0.2 kW 500 MW 500 1,000 181 2,302 135 1,727
______ __
17.2 Long DurationII O Cou W Wan' 1 6 0.2 kW 500 MW 100 782 II1,445 18,417 637 8,122 'm u iO aWMendWe. ntL - mius s -seemn.
"L-Uf Ie. 10 ym2.5% escain. 10.0% demmt ra.
%ased on polmbai (MW. 10 yeurs) an aerage afloaangleou mu pA).
"a ime aer. 11.w. fra.. cam .reaUm. to umd ... m am. ... a.m.a. .m. . lomes .nl.. ..
In order to mitigate the risk and effects of allowing more renewables in the current energy portfolio different kinds of energy storage technologies are used. Pumped Storage Hydroelectric (PSH) and Compressed Air Energy Storage (CAES) are used to address utility scale energy storage needs. Fly-wheels and Electric Double-Layer Capacitors (EDLC) are used for improving grid power quality while high capacity batteries are used for the operations in between. Energy storage technologies used for different purposes with respect to their energy storage capacities and discharge rates are shown in Figure 4.
System
Ratings
Installed systems as of November 2008
Rated Power (MW)
Figure 4 Energy storage rates (Source: [8]) [7]
technologies with respect to their storage capacities and discharge
Power quality management and bridging powers are outside the scope of this project. This paper will focus on energy management storage solutions, which are served by utility scale energy storage. For the purpose of this paper energy storage will refer to utility scale energy storage.
2.1.
Energy Storage Technologies
2.1.1. Pumped Storage Hydroelectric (PSH)
PSH is the most common and well-proven energy storage technology which utilizes the head difference between two reservoirs. During low-demand (off-peak) times water is pumped from a lower reservoir to an upper reservoir. When power is needed, water is released to flow down to the lower reservoir through a turbine to generate electricity. A schematic of PSH in Racoon Mountain Pumped Storage Plant is shown in Figure 5.
10 E
I
1 0.1 0.01 0.001 0.0001 L-0.001 10,000Pumped-Storage Plant
Figure 5 Diagram of Raccoon mountain Pumped Storage Plant (http://www.tva.gov/power/pumpstorart.htm)
Essentially electrical energy is converted to, and stored as, potential energy. Energy capacity of the system is proportional to the head difference between the reservoirs and volume of the upper reservoir. The energy capacity of the system can be calculated as:
E = Pwater x
g
x h x Vreservoir X 7lpump X 7lturbineCompared to other energy storage technologies PSH is the oldest and most well-established technology. PSH was first commercially built back in 1890s in Italy and Switzerland and has been widely used since then. Currently led by Japan, worldwide PSH installed capacity is 104,453 GWh [9]. Table 3 represents worldwide PSH capacity by countries.
Table 3 Installed PSH capacity of EU countries [10], US [11], China [12] and Japan [13] Japan 25,583 USA 21,886 China 15,643 Italy 7,544 Spain 5,347 Germany 5,223 France 4,303 Austria 3,580 United Kingdom 2,744 Switzerland 1,655 Poland 1,406 Belgium 1,307 Czech Republic 1,147 Luxemburg 1,100 Portugal 1,029 Slovakia 916 Bulgaria 864 Latvia 760 Greece 699 Croatia 293 Ireland 292 Sweden 45
2.1.2. Compressed Air Energy Storage (CAES)
As its name suggests; CAES stores energy using compressed air; energy is then released by using the compressed air to spin a turbine. For conventional CAES, power is drawn from the grid off-peak to compress air, and delivered to the grid on-peak by expanding the air through a turbine. When the system is charged during compression, the air heats up, and that heat is dissipated to the environment. Since thermal energy during the compression stage is not stored in the existing systems, efficiency and capacity drops due to entropy generation. In order to compensate the losses, natural gas (NG) is combusted with the compressed air during discharge, and the combustion product is used to drive a turbine. Geological features, such as depleted underground salt caverns, are required with the current applications therefore both worldwide and domestic CAES installations are highly restricted geographically. Regions in Europe and US that can support conventional CAES are shown in Figure 6 and Figure 7 respectively.
Figure 6 Superimposed image of high wind resources map regions for CAES installations in Europe [14]
and geologically available Northern Germany, Belgium, Western UK, Eastern Coast of Spain, southern part of France and Sicily/Italy are places where high wind potential overlaps with underground salt caverns. It is also stimulating for ORES deployment in the Mediterranean, namely Spain, France and Italy, where wind profile is decent, demand is high and depths are promising.
Figure 7 Superimpose of high wind resources with geologically available regions for CAES installations in US [14]
Similarly southern part of US; Texas, Louisiana, Mississippi and Alabama are available for CAES installations. Furthermore corresponding offshore wind speeds in the region are encouraging for FWTs. There is intensive energy consumption in these states due to high temperatures in the summer and heavy usage of air conditioning. Because of this high energy usage, concentrated highly on late afternoon hours, energy price makes peak which creates an opportunity to utilize these caverns for energy storage.
However, despite the geographical availability of regions in Europe and US there are currently two running conventional CAES plants in the world:
e Huntorf Air Storage Gas Turbine Power Plant, in Huntorf, Germany e McIntosh- The PowerSouth CAES in Alabama, United States
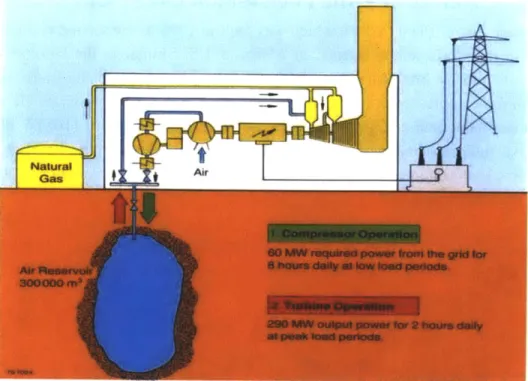
2.1.2.1. Huntorf Air Storage Gas Turbine Power Plant
In 1978, the Huntorf Power Plant (HPP) was commissioned in lower Saxony, Germany, an area known for its salt mines. The HPP is designed to serve peak load and competes with natural gas fired power plants. The main difference between HPP and traditional gas turbine power plants is that the generation of electricity and compressed air do not happen at the same time at HPP. This facility pumps air at off-peak times into two salt caverns, which lie in depths of 800 and 650 m and have a total volume of 310,000 M3. The plant was initially built with a nameplate capacity of 290MW; capacity was later increased to 321MW. During high demand, compressed air is released and burned with NG and then used in a gas turbine to generate electricity. The gas turbine used in the facility is capable of immediate start (without a long ramp-up time) and can reach the full output of 321MW within six minutes." [15]. Figure 8 below is a schematic of the facility.
Figure 8 Schematic of Huntorf Air Storage Gas Turbine Power Plant' The publically
Table 4 below [16].
available system parameters for the Huntorf plant are summarized in
Table 4 Specifications of Huntorf Power Plant
321 MW (for less than 3 hours) Air flow rate: 417 kg/s
Operation 60 MW (for less than 12 hours) Air flow rate: 108 kg/s
Number of Caverns: 2
Cavern 1 Volume: 140,000 m3 Cavern 2 Volume: 170,000 m3
Caverns Minimum pressure: 1 bar
Minimum operational (exceptional) pressure: 20 bar Minimum operational (regular) pressure:43 bar Maximum permissible & operational pressure: 70 bar
Huntorf plant was renovated. As a result of this, reservoir volume was increased to 31 0,000m3 and power output was upgraded to 321MW. However no updated schematic related to plant's current status is published in company's website or public materials
2.1.2.2. McIntosh - The PowerSouth CAES Plant
McIntosh Power Plant (MPP), which was built in 1991, is the second conventional CAES power plant in the world and is located in Alabama, US. Similar to the Huntorf Power Plant, compressors are run by low-cost energy at low-demand times to fill the underground storage reservoir with the compressed air. The compressed air is then used to generate electricity during the peak-demand/high cost energy times. MPP output is approximately 110MW electricity (for 26 hours). At full capacity the power plant is capable of meeting the peak demand of approximately 110,000 homes [17]. McIntosh CAES plant can serve roughly 3000 average US homes for a one month period [18].
During the peak/high demand times the MPP can reach its output, 110MW of electrical power, in a ramp-up time of 14 minutes. Figure 9 is a schematic of the MPP facility.
Power Power
Compressors from gri to grid Exaders
Stack
clutches Combustors
Aftercooler Intercoolers
1300-psig air 650-paig air
Figure 9 Schematic of McIntosh Power Plant
To store energy air is drawn through Low Pressure (LP) compressors and then compressed through 4 stages (LP, Intermediate Pressure (IP)-1, IP-2 and High Pressure (HP) compressors). During compression energy from grid is used to run the compressors. Between each stage compressed air is cooled via intercoolers. High pressured air after the last (4th) stage
runs through an aftercooler before it is stored in the caverns to maximize cavern storage capacity.
When power is needed, compressed air is released from the caverns and preheated by the recuperator. Pre-heated air is then combusted by NG and runs the first set of HP turbines. Exhaust of HP turbines is burned again before it runs the LP turbines. Relatively high
temperature exhaust of LP turbine, compared to cavern temperature, is used in the recuperator to preheat the inlet of the HP turbines and then released to the atmosphere.
2.1.3. Thermal Mass CAES
The process is often called adiabatic CAES, however for the purpose of this paper it will be referred to thermal mass since heat is transferred to and from the system during the processes of compression and expansion. Thermal mass CAES is an innovative method of CAES, with a thermal mass as an additional unit operation. In a thermal mass CAES system, the thermal energy generated as a result of compression is stored in a thermal mass, which is either liquid or solid selected for its heat transfer and retention capacities, so that heat is reused during expansion. Such a system offers numerous advantages over traditional CAES, reducing temperature in the storage tank, reduces heat loss through the tank walls, increasing the tank energy storage capacity, and reduces the rate of oxidations.
To charge the system, electricity is drawn from the grid to supply a motor which in turn drives a compressor. As the air is compressed, it rapidly generates heat. To later utilize this heat, the hot air passes through a heat exchange mechanism. Several concepts have been proposed for the heat exchange mechanism including: (1) the use of a conventional heat exchanger to transfer heat between the air and a thermal storage medium such as oil, and (2) a self-contained drum with heating tiles to absorb, retain and transfer heat as the hot air passes through. The thermal medium, whether heating tiles or oil, retains the transferred heat for later use and the cooled air is stored in a pressure vessel or natural salt cavern. ESPC, a US based power consulting firm, has discussed a design similar to that described in option 1 above, while RWE, a European-based company, is currently working on the ADELE project utilizing the heat transfer mechanism described in option 2 [19] [20].
To discharge the system, the compressed air in storage is drawn into use again. Because the expansion results in a substantially lower air temperature (which in turn could affect the integrity of the turbine) the air passes back through a heat exchange mechanism for thermal interaction with the thermal storage medium to regain heat prior to entering the expansion process. After the heat exchanger the air undergoes expansion through a power generation device such as a turbine which in turn drives electricity back to the grid. A process flow diagram (PFD) for the Thermal Mass CAES system as described is shown in Figure 10.
I '
Figure 10 Process Flow Diagram (PFD) of Thermal mass CAES
The publically available system parameters for the ADELE plant, a thermal mass CAES plant, are summarized in Table 5 below [20].
Table 5 Specifications of ADELE CAES Plant
Max pressure at outlet: 100 bar
Compressor Max temperature at outlet: 600 Celsius Thermal Mass Height: 40 m
Material: bed of stones or ceramic molded bricks
Cavern Max pressure: 70 bar
Turbine Max power: 300 MW
Max duration per cycle: 3.3 hours
Overall Round trip efficiency: 70%
2.1.4. Innovative PSH or CAES Applications
Hydrostor, a Toronto based company, is seeking for innovative ways to store energy underwater [21]. The company aims storing compressed air in underwater flexible bags which are anchored at the bottom to overcome buoyancy forces. Hydrostatic pressure of water column is used to keep the bags pressured. Similar to thermal mass CAES to store energy compressed air runs through thermal energy storage to transfer excess heat to the storage tank and when energy is needed relatively cold compressed air due to the lower temperatures of sea water runs back through the same thermal mass, heats up and runs a turbine [22]. The capacity of the system is limited to the depth of the bags, thermal energy storage capacity of the thermal mass and heat transfer rate (a function of material properties and contact surfaces). A schematic of Underwater Compressed Air Electrical Storage (UCAES) is shown in Figure 11.
Figure 11 Underwater Compressed Air Electrical Storage - Hydrostor (source: [22])
Two German physicists Horst Schmidt-B6cking and Gerhard Luther worked on a similar concept to the ORES to store energy underwater in spheres [23]. The idea is similar, build hollow concrete spheres which are envisioned to have 280m diameter, deploy them under water in depths of 2000m, and use them as a lower reservoir. When energy is needed high pressure water will run into the sphere through a turbine and generate electricity. Water is pumped through the same reversible turbine (i.e. Francis turbine) to charge the spheres. They envision
NLJ 11I
Figure 12 Schmidt-Bocking & Luther's hollow sphere energy storage device (source: [231) In addition to prior implementations a UK professor from Nottingham University, Seamus Garvey, envisions building a hydraulic ram using low pressure high flow rate tidal power to generate high pressure and low flow rate and storing 25 megajoules of energy per cubic meter
Chp 3. ORES
3.1.
Early Stages and Operating Concept of ORES
ORES units are hollow concrete structures which can store utility scale energy and provide anchorage for offshore energy harvesting platforms. ORES concept was first created by Prof. Alexander H. Slocum as a conical energy storage platform co-located with offshore energy harvesters, most notably, offshore wind, current and tidal. ORES can facilitate great integration of renewable energy at higher levels of penetration. First design of ORES concept is presented in Figure 13 as a conical, hollow, concrete structure on which energy harvesting devices can be mounted.
Figure 13 harvesters
Initial by Prof.
conical energy storage platform co-located with offshore Alexander Slocum
These ground mounted conical structures didn't allow installations for far offshore energy harvesters. Alison Greenlee then joined the project in 2008 and worked on subsea chambers which replaced conical structures [25]. She designed and analyzed chambers with hexagonal prism and cylinder with a spherical end cap. Instead of mounted conical platforms these chambers, connected to each other and filled with rock, could provide sufficient anchorage for mooring floating platforms so that even greater depths and farther areas from shore could be exploited for better winds.
After 2009, extensive research on both economics and design was conducted by Gregory Fennell [26]. During this period, spherical ORES design evolved and was evaluated. Hexagonal
and cylindrical geometries were revised and studies focused on spherical structures [27]. These structures were designed to function as a lower reservoir for PSH. Energy is stored during the energy
off-peak times or when there is excess renewable energy by pumping water out of the sphere. When there is a demand on the grid or energy prices are high, water is allowed to run into the spheres under hydrostatic pressure of water through a turbine and electricity is generated. ORES project evolution since 2007 and operating concept can be seen in Figure 14 and Figure 15 respectively.
2007 2008 2009 2010 2011
Figure 14 Evolution of ORES project
As mentioned earlier ORES spheres act as the lower reservoir of a PSH system and hydrostatic pressure is the governing force to store energy. The energy capacity of the system
can be calculated as:
E [MWh] = Psw xgxxxVspherexlpump Xflturbine
3600000000 (2)
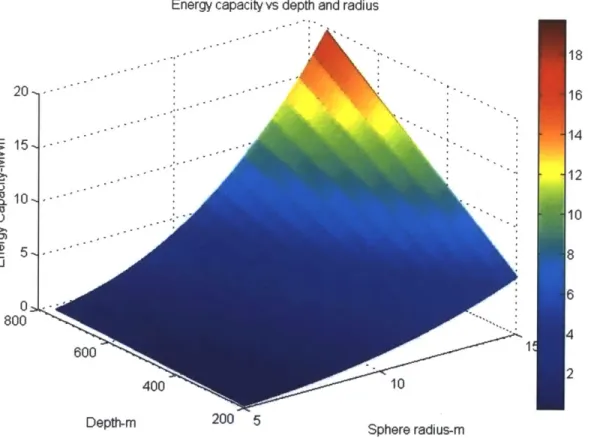
Conventional PSH typically works with round trip efficiencies of 70-85% [28]. To be conservative side of the calculations 70% round trip efficiency and 95% of volume utilization is assumed. Volume utilization refers to the ratio of actual volume of the water running into the sphere to the inner volume of the sphere. 5% accounts for the volume of sphere which cannot be used for reasons including the minimum head for the pump to operate and not make cavitation and air pocket which remains when sphere is full with water. Resulting ORES capacity as a function of depth and radius is shown in Figure 16.
Energy capacity vs depth and radius
20 -, 15, CL10 , (D0 02 800 18 16 14 1 112 10 1
Depth-r 200 5 Sphere radius-rn
Figure 16 ORES energy capacity as a function of depth and diameter
Figure 16 clearly illustrates that greater depths and larger radius favor the capacity of each ORES sphere and the system as a whole. However despite being technically feasible it is not economically feasible to work at deeper depths than 800-900m. High costs associated with special equipment and advanced Unmanned Autonomous Vehicles (UAVs) make it challenging to deploy spheres and maintain rotating equipment at 900m depth.
3.2. Innovating for Manufacturability
Manufacturing ORES spheres is neither an easy nor an impossible process. There are two main challenges awaiting the full-scale mass production. First is the high production rate. In order to build 1GWh storage field at 750m depth consisting of 27m inner diameter (ID) ORES spheres in one year, 70 spheres should be manufactured, towed, deployed and connected to the grid. This production rate yield a sphere fully connected to the grid in 6 days. In order to achieve this goal complicated design features should be eliminated without compromising the structural strength. Steel rebars are avoided and replaced with increased wall thickness to overcome high hydrostatic pressures. Increased wall thickness allows excess ballast to act as sufficient anchorage for TLPs and catenary mooring for FWTs. ORES spheres acting as catenary mooring is shown in Figure 17.
Water level
Storage Sphere
Figure 17 ORES spheres used as catenary mooring for FWTs [27]
500mt ballast for catenary mooring and 3000mt ballast for TLP are required for FWTs [29]. Minimum wall thickness at equilibrium state for buoyancy is calculated as:
Wsphere = Fbuoyancy (3)
4 4
Pconcrete x g x - x I7 x ((r + t) 3 - r3) = - x r x (r + t) 3 X Psw
3 3
When equation (3) is solved with values for an equilibrium state, wall thickness is derived as 10.8% of diameter.
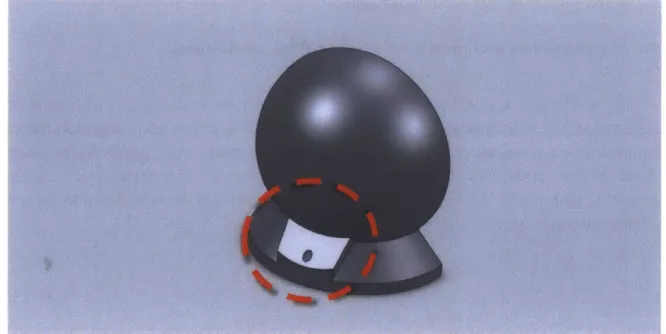
An additional conical base is required to act as a cradle and hold the sphere. The conical base envisioned and calculated in [26] is revised to facilitate manufacturing. The new approach
Figure 18 Revision of conical cradle for ORES sphere [26]. (Previous design on the left, updated design on the right)
This revision provides a more realistic calculation while avoiding double-counting of the wall intersecting at the bottom of the sphere. Volume of conical base is calculated as:
VconicatBase - x x h x r2 - f( 2 x xr 2 x sin
#
d#)dr (4) All this data and equations (3) and (4) are incorporated into an Excel spreadsheet and data including volume, capacity, mass, ballast, volume of concrete for each sphere is calculated in Table 6.Table 6 Storage capacity and volume calculations of ORES (an updated study of [30])
Density sea water (kg/m3) 1025
Density concrete (kg/m3)
2400
Inside diameter (m) 27
Concrete strength (MPa, psi) 34.5 5000
Strength Factor of Safety 1.5
Minimum ballast safety factor 1
Inner volume (m3
) 10306
Required ballast for total inner volume (mt) 10564
Volume - conical base: height=base D=sphere Dinside (M3) (Eq. 4) 1443
FWT anchor system Moored TLP
Required ballast for anchoring FWT (mt) 500 3000
Total required submerged ballast (mt) 11064 13564
Volume of concrete required for ballast (m3
) 8046 9864
Approximate sphere wall thickness to self-ballast (m) 2.9 3.8
Actual submerged weight of concrete (mt) 13141 17576
Actual dry land weight (mt) 22937 30678
Actual ballast safety factor 1.2 1.3
Pump/turbine efficiency 70% 70%
Percent useable volume (to maintain pump head height) 95% 95%
Planned deployment depth (m) 400 400
Charge capacity at 400m (MWh) (Eq. 1) 7.6 7.6
Maximum safe depth (m) 671 799
Charge capacity at maximum safe depth (MWh) 12.8 15.3
Table 6 indicates that dead weight of 27m ID ORES sphere with a 2.9m wall thickness and a conical base is 22,937mt. Moving a monolithic structure with a 32.8m OD and weighing 22,937mt easily on manufacturing plant is not a trivial process. Ship industry is using low bed heavy duty trucks to carry and move ship segments which can weigh hundreds of tons. Bridge construction is another industry which deals with the same problem. Big size bridge segments are constructed at the manufacturing facility and moved with low bed truck and loaded on heavy duty trucks or trains for longer distance transportation. Examples of heavy segments in different industries being carried by low bed trucks are shown in Figure 19.
Figure 19 Examples of low bed heavy duty trailers carrying ship segments (on the left) and bridge/tunnel segments (on the right) (source:ttnet.net)
Another method used heavily in shipyards is rails. Big segments are built on site and transferred/carried to next stage or another place via rail network. Even though carriage capacity of rail system is substantially higher than it is for low bed trucks, building the infrastructure for a rail network is costly and the modifications of the network is highly restricted. Regardless of the methodology securing and safely moving spherical concrete structures will be time and skill intensive. In order to overcome this challenge some new approaches and design were developed. Some of these improvements and alternative approaches will be discussed in the following section.
3.3.
Vertical Hemispheres
This concept was first developed with Prof. Alexander Slocum, Gregory Fennell and G6khan Ditndar [26]. Each hemisphere is envisioned to be poured vertically. The idea was developed to overcome the complex assembly procedure of multiple-stave design. This approach will eliminate the requirement of high capacity cranes to lift horizontal hemispheres. Furthermore having vertical hemispheres instead of multiple-sliced staves will allow match-casting to enhance sealing in the contact surfaces. In the multiple-sliced design all of the parts should be assembled simultaneously otherwise final assembly cannot be accomplished. Comparison of multiple-stave design with vertical hemisphere design is shown in Figure 20.
Figure 20 Multiple-stave sphere (on the left) compared to hemisphere design (on the right) (credit Alex Slocum)
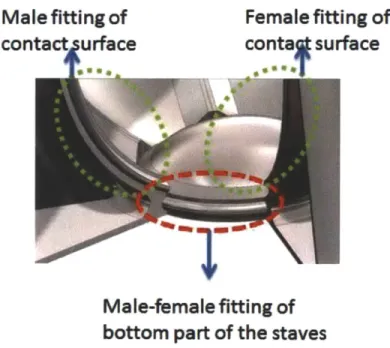
Compared to complex geometry of 6-stave design, vertical hemisphere design is simpler and eliminates multiple alignment issues. A closer look of the male-female joints of the bottom part of the staves and contact surfaces can be seen in Figure 21.
Male
fitting
of
contact urface
T...
a
Female fitting of
contag surface
Male-female fitting of
bottom part of the staves
Figure 21 Male-female fitting of bottom part and contact surfaces of staves
Even though male-female fitting on the bottom parts of the staves provides sealing and a better alignment, additional match-cast features on the mating surfaces (male and female fitting of contact surface) make it impossible to assembly unless all pieces are assembled simultaneously.
Main production concept for the vertical hemisphere design is having an inner and outer mold. Molds are attached to each other via flanges. After molds are assembled concrete is poured to the space in between from the port at the top of the mold. There are three key characteristics of the design:
" Match-cast surface to enhance sealing of the mating surfaces
e A surface at the back of the hemisphere where rotating equipment can easily and
precisely be mounted
" Conical base to provide sufficient anchorage for catenary mooring or TLP for FWTs.
Inner mold
Figure 22 Exploded view of mold assembly describing key features
However some features are added to or taken from the initial design with to meet the arising or changing requirements. Rotating equipment installation has been subject to numerous design iterations and was studied intensively. Initially an extruded boss parallel to the ground at the back of the hemisphere was developed. The idea here is to provide surface to install pump/turbine unit on top of this boss and connecting to a pipe that directly goes into the sphere. This approach can be seen in Figure 23.
Horizontal surface to
mount rotating
equipment
Figure 23 Vertical hemisphere with a boss to mount rotating equipment
Building a horizontal boss makes it hard to demold the hemisphere. A draft angle should be applied in order to provide a smoother demolding. This improvement was applied to the design and inclined boss feature replaced the horizontal boss. This approach is shown in Figure 24.
Figure 24 Vertical hemisphere with inclined boss and 50 draft angle to mitigate demolding problems
It can be seen in Figure 24 that the boss is revised and designed as inclined surface. In addition to making the boss inclined a 50 draft angle is introduced on the both sides of the boss. Despite the fact that designing an inclined boss with draft angle mitigates demolding problems it is still a complicated feature for full-scale ORES sphere. Mounting the pump/turbine unit precisely on this inclined boss is not simple either. Precision of the installation and complexity of the structure led us to create an innovative approach, plug-and-play.
Rotating equipment can be lowered by using tension legs as guideline and can be plugged to its place. A male probe at the bottom of the pump/turbine unit will fit to its female probe on the sphere side. When plugged in male probe will automatically open the valve on the female side so that it can start operating. When plugged out the valve will close automatically and prevent water running into the sphere. This plug-and-play capability has been used in the Navy for replenishment at sea (RAS) operation and will increase the operation efficiency of the system by eliminating the long maintenance and installation procedures. A schematic of RAS showing male and female probe is shown in Finure 25.
Figure 25 Schematic of RAS showing male-female joint (source: http://www.rolls-royce.com/marine/products/deck machinery/dm naval/ras/)
3.4.
Inner Balloon Method
Vertical pouring added value to the project in terms of manufacturing. It is easier to pour concrete, to move the hemisphere around the manufacturing site and requires less specialized and heavy duty equipment compared to horizontal hemisphere approach. To make the manufacturing process even easier some innovative ideas were generated yet none of them could be experimented because of the time constraints.
First solution is using a rubber balloon as inner mold. Similar to the vertical pouring there is going to be two vertical molds, assembled to form a spherical outer mold. A polyurethane or rubber balloon is going to be placed in the mold. Concrete is going to be poured simultaneously while a same density fluid is pumped into the balloon. Balloon will be attached to the bottom and various points to the pouter mold to overcome buoyancy forces and maintain concentricity. In order to test this model rubber 22cm diameter volleyball is used as inner balloon and 24cm hard plastic bowl was used as outer mold. After the third trial a perfect sphere with uniform wall thickness was achieved. Figure 26 shows the experiment and the final sphere cast from plaster.
Figure 26 22cm ID plaster sphere using inner balloon method. Threads for maintaining the concentricity is shown on the right picture (credit: James Meredith)
Initially water was decided to be used to fill the balloon. The advantage of water is abundance, low price and ability to be easily to transported (pump and discharge). Density of water is 1000kg/m3 compared to 2400kg/m3 of self-consolidating concrete. The difference between the densities results in less hydrostatic pressure of water compared to the hydrostatic pressure of the same column of wet concrete. In addition to pressure differential problem low density results in less weight of the balloon when totally filled with water thus more force to be compensated to attach the balloon to the mold. Buoyancy force applied to the balloon totally submerged to the wet concrete can be calculated as:
Fbuoyancy = Vsubmerged X Pconcrete x g (5)
4
Fbuoyancy - 4 x r x 12.53 x 2400 X 9.81 = 192.6E6 [N]
It can be seen that buoyancy force applied to a fully submerged balloon is very high (192000 kN) hence large displacements and deformations are expected in the balloon. The SW simulation of rubber balloon, filled with water and fully submerged in the wet concrete is shown
in Figure 27. It can be seen that if rubber ball is not properly pressurized and contacted to the mold hydrostatic pressure of wet concrete will squeeze the balloon upwards and will result in total deformation of balloon.
1.664e+006 1.525e4006 1.3879406 1248e+006 1 109e+006 9.706e+005 8.320e+005 6.933e+005 5.547e+005 4.160e+005 2.773e+005 1.387e+005 1.000e-031
Figure 27 Displacement of rubber balloon filled with water and fully submerged into wet concrete
However because of the pour rate and cure time the balloon will never be totally submerged in wet concrete. If an average 1 00m3/h concrete pour rate [31] and 2 hour for initial curing time is assumed for the concrete to carry its own weight, this yields approximately 4cm of wet concrete volume (depending on bottom, medium or top part of the sphere. 4cm example is from the medium part of the sphere). Low pour rates will have a negative impact on the total pour time but will decrease the buoyant and contact forces applied to mold and the balloon. Based on our experience and tests done in American Concrete, Maine, concrete starts to cure immediately after the mix and can carry its own weight after one hour. To be on the conservative side two hours is assumed for the concrete top carry its own weight. Our tests, results and experience gained related to the concrete are going to be discussed in Chp 5 with more detail.
Drilling fluid was also evaluated to replace water. Drilling fluid, known as drilling mud, is a fluid comprised of different elements including water, clay, barite etc., to maintain the
![Figure 6 Superimposed image of high wind resources map regions for CAES installations in Europe [14]](https://thumb-eu.123doks.com/thumbv2/123doknet/14680581.559168/25.918.205.699.131.488/figure-superimposed-image-resources-regions-caes-installations-europe.webp)

![Figure 11 Underwater Compressed Air Electrical Storage - Hydrostor (source: [22])](https://thumb-eu.123doks.com/thumbv2/123doknet/14680581.559168/31.918.207.694.403.712/figure-underwater-compressed-air-electrical-storage-hydrostor-source.webp)