HD28
.M414
no.
35/4
<?3
WORKING
PAPER
ALFRED
P.SLOAN
SCHOOL
OF
MANAGEMENT
Data
Quality
Requirements
Analysis
and Modeling
December
1992WP
#3514-93
CISL
WP#
92-03Richard
Y.Wang
H.
B.Kon
StuartE.Madnick
Sloan
SchoolofManagement,
MIT
MASSACHUSETTS
INSTITUTE
OF
TECHNOLOGY
50
MEMORIAL
DRIVE
To
appear
inthe
Ninth
International
Conference
of
Data
Engineering,
Vienna,
Austria, April
1993
Data
Quality
Requirements
Analysis
and Modeling
December
1992WP
#3514-93
CISL
WP#
92-03Richard
Y.Wang
H.
B.Kon
StuartE.Madnick
Sloan
SchoolofManagement,
MIT
*seepage bottomforcompleteaddress
Richard
Y.Wang
E53-317
Henry
B.Kon
E53-322 StuartE.Madnick
E53-321Sloan School
ofManagement
Massachusetts
InstituteofTechnology
MJ
'FEB
2 3
1993
To Appear
in theNinth
InternationalConference on
Data Engineering Vienna, Austria April 1993Data
Quality
Requirements
Analysis
and
Modeling
Richard Y.
Wang
Henry
B.Kon
Stuart E.Madnick
Sloan School of
Management
Massachusetts Institute ofTechnology Cambridge,
Mass
02139ABSTRACT
Dataengineeringisthemodelingandstructuringofdata in
its design, development and use.
An
ultimate goal of dataengineering is to put quality data in the hands of users.
Specifyingandensuring the qualityofdata, however,isan area
in data engineering that has received little attention. In this paper we: (1) establish a set ofpremises, terms, anddefinitions for data quality management, and (2) develop a step-by-step
methodology for defining and documenting data quality parameters importantto users. Thesequalityparametersareused todeterminequalityindicators, tobe taggedtodataitems,about thedatamanufacturingprocesssuchasdatasource, creation time,
andcollection method. Given such tags,and the ability toquery
over them, users can filter out data having undesirable
characteristics.
The methodology developedprovidesaconcreteapproachto
data quality requirements collection and documentation. It
demonstratesthat data quality can be an integral part of the database designprocess. Thepaperalsoprovides a perspective
for the migration towards quality
management
of data in adatabaseenvironment.
1.
INTRODUCTION
As
data processing has shiftedfrom
a role ofoperations support to
becoming
amajor
operation initself, the
need
arises for qualitymanagement
of data.Many
similarities existbetween
quality datamanufacturing
and
quality product manufacturing, suchas conformity to specification, lowered defect rates
and
improved
customersatisfaction. Issuesof qualityproduct manufacturinghave
been a major concern formany
years[8][20]. Product quality is
managed
through
qualitymeasurements,
reliability engineering,and
statistical qualitycontrol[6][11].1.1.
Related
work
indata
qualitymanagement
Work
on
data qualitymanagement
hasbeen
reported in the areas of accounting, data resource
management,
record linking methodologies, statistics,and
large scale survey techniques.The
accounting areafocuses
on
the auditing aspect [3][16]. Data resourcemanagement
focuses primarilyon managing
corporatedata asanasset|1][12). Record linking methodologies can
be traced to the late
195CS
[18],and have
focusedon
matching
records in different fileswhere
primary
identifiers
may
notmatch
forthesame
individual[10][18].Articles in large scale surveys
have
focusedon
datacollection
and
statisticalanalysis techniques[15][291.Though
databasework
has not traditionally focusedon
data qualitymanagement
itself,many
of the toolsdeveloped have relevancefor
managing
dataquality. Forexample, research hasbeen conducted
on
how
topreventdata
inconsistencies (integrity constraintsand
normalization theory)
and
how
to prevent data corruption(transaction
management)
[4][5][9][21]. Whileprogressinthese areas is significant, real-world data is imperfect.
Though
we
have gigabit networks, not all information istimely.
Though
edit checks can increase the validity ofdata,datais notalwaysvalid.
Though
we
try tostart withhighqualitydata, the source
may
only be abletoprovideestimates with varying degrees of accuracy (e.g., sales
forecasts).
In general, data
may
be of poor quality because itdoes not reflect real worldconditions, orbecauseit is not
easilyused
and
understoodby
thedata user.The
cost ofpoor data quality
must be measured
in terms of userrequirements[13].
Even
accuratedata, ifnot interpretableand
accessibleby
theuser,isoflittlevalue.1.2.
A
data
qualityexample
Suppose
that a salesmanager
uses a database oncorporate customers, including their
name,
address, andnumber
of employees.An
example
for this isshown
inTable1.
disparate sources,
knowledge
ofdata quality dimensionssuch as accuracy, timeliness,
and
completenessmay
beunknown. The manager
may
want
toknow
when
thedatawas
created,where
itcame
from,how
and
why
itwas
originallyobtained,
and
by what means
itwas
recordedinto the database.
The
circumstances surrounding thecollection
and
processing of the data are often missing,making
thedatadifficulttouse unless the userofthe dataunderstands thesehidden orimplicit data characteristics.
Towards
the goal of incorporating data qualitycharacteristics into the database,
we
illustrate in Table 2an
approach
inwhich
the data is tagged with relevantindicators of data quality. These quality indicators
may
help the
manager
assess or gain confidence in thedata.Co name
FruitCo
Nut
Co
address 12 JaySt (1-2-91, sales) 62LoisAv
(10-24-91, acct'g)#employees
4,004 (10-3-91,Nexis) 700 (10-9-91, estimate)Table
2:Customer
information with quality tagsForexample, 62Lois Av,(10-24-91, acct'g) in
Column
2 of Table 2 indicates that
on October
24, 1991 theaccounting
department
recorded thatNut
Co's addresswas
62LoisAv. Using suchcell-leveltagson
thedata,themanager
canmake
ajudgment
as to the credibility or usefulness of thedata.We
develop in this paper a requirements analysismethodology
to both specify the tagsneeded
by
users to estimate,determine, orenhance dataquality,and
toelicit,from
the user,more
general data quality issues notamenable
to tagging. Quality issues notamenable
totagging include, for example, data completeness
and
retrieval time.
Though
notaddressablevia cell-level tags,knowledge
ofsuchdimensions canaiddata quality controland
systems design. (Tagging higher aggregations, suchasthe table or databaselevel,
may
handlesome
of thesemore
general quality concepts. For example, themeans
by which
a databasetablewas
populatedmay
givesome
indication ofits completeness.)
Formal
models
for cell-level tagging, theattribute-based
model
[28]and
thepolvgen source-taggingmodel
[24] [25],
have
been developedelsewhere.The
function ofthese
models
is the tracking of the production history ofthedata artifact (i.e.,the processed electronic symbol)via
tags.
These
models
include data structures,query
processing,
and
model
integrity considerations. Theirapproach demonstrates
that the datamanufacturing
process can be
modeled
independentlyof the applicationdomain.
We
develop
in thispaper
amethodology
todetermine
which
aspects of data quality are important,and thus
what
kind of tags toputon
the data so that, atquery time, data with undesirable characteristics can be
filtered out.
More
generaldata quality issuessuchasdataquality assessment
and
control arebeyond
the scope ofthe paper.
The
terminology usedin thispaper isdescribednext.1.3.
Data
qualityconcepts
and
terminology
Before one can analyze or
manage
data quality, onemust
understandwhat
data quality means. This can notbe
done
out of context, however. Just as itwould
bedifficult to
manage
thequalityofaproduction linewithoutunderstanding dimensionsofproduct quality, data quality
management
requires understandingwhich
dimensionsofdata qualityareimportant totheuser.
It is widely accepted that quality can be defined as
"conformanceto requirements" [7]. Thus,
we
definedata qualityonthis basis. Operationally,we
define data qualityin terms of data quality parameters
and
data qualityindicators(dennedbelow).
•
A
data qualityparameter
is a qualitative orsubjective
dimension
by which
a user evaluates dataquality. Source credibility
and
timeliness are examples,(called quality parameter hereafter)
•
A
data quality indicator is a data dimensionthat provides objective* information about the data.
Source, creation time,
and
collectionmethod
areexamples, (called quality indicator hereafter)
•
A
data quality attribute is a collective termincluding bothquality parameters
and
quality indicators,as
shown
in Figure 1 below, (called quality attributehereafter)
OuHh
Figure 1: Relationship
among
quality attributes,parameters,
and
indicators•
A
data quality indicator value is ameasured
characteristic of the stored data.
The
data qualityindicator source
may
have an indicator value Wall StreetJournal, (called quality indicator value hereafter)
•
A
dataqua
lityparameter
value is the value determinedfor aquality parameter(directly orindirectly)based
on
underlying quality indicator values.User-defined functions
may
be used tomap
quality indicatorvalues toqualityparameter values. Forexample, because
the
source
is Wall Street Journal,an
investormay
conclude that data credibility is high, (called quality
parameter value hereafter)
Theindicator valueis generated using a well-defined
•
Data
quality
req
uirements
specify theindicators required to be tagged, or
otherwise
documented
for the data, so that at query time users canretrieve data of specific quality (i.e., within
some
acceptable range of quality indicator values), (called
quality requirements hereafter)
•
The
data quality administrator isa person (orsystem)
whose
responsibilityit istoensurethatdata in thedatabase conform to thequality requirements.
Forbrevity, the term "quality" will be used to refer to
"dataquality"throughout thispaper.
2.
FROM DATA
MODELING TO
DATA
QUALITY
MODELING
It is recognized in
manufacturing
that the earlierquality is considered in the production cycle, the less
costly in the long run because
upstream
defects causedownstream
inspection, rework,and
rejects [22].The
lesson todata engineering isto design data quality into
the database,i.e.,qualitydata
by
design.In traditional databasedesign, aspects of data quality
are not explicitly incorporated.
Conceptual
designfocuses on application issues such as entities
and
relations.
As
data increasingly outlives the application forwhich
itwas
initially designed, is processed along withotherdata,
and
isused over timeby
users unfamiliar withthe data,
more
explicit attentionmust
be given to dataquality. Next,
we
presentpremises related todata qualitymodeling.
In general, different users
have
different data qualityrequirements,
and
different data is of different quality.We
present related premisesin the following sections.2.1.
Premises
related
todata
quality
modeling
Dataquality
modeling
isan
extension of traditionaldata
modeling
methodologies.Where
datamodeling
captures the structure
and
semanticsofdata,data qualitymodeling
captures structuraland
semantic issuesunderlyingdataquality.
(Premise
1.1)Relatedness
of applicationand
quality attributes: Application attributes
and
qualityattributes
may
notalways be distinct. For example, thename
of thebank
tellerwho
performs a transactionmay
be considered an application attribute. Alternatively, it
may
bemodeled
asa quality indicatorto be used for dataquality administration. Thus,
we
identifytwo
distinctdomains
ofactivity: datausageand
quality administration.If the information relates to aspects of the
data
manufacturing process, such as
when,
where,and by
whom
thedatawas
manufactured,thenitmay
bea qualityindicator.
(Premise
1.2)Quality
attribute
non-orthogonality: Different quality attributes need not be
orthogonal toone another. Forexample, the
two
qualityparameters timeliness
and
volatilityare related.(Premise 1.3)
Heterogeneity
and
hierarchy inthe quality of supplied data: Qualityofdata
may
differacross databases, entities, attributes,
and
instances.Database example: data in the alumni database
may
beless timely than data in the student database. Attribute
example: in the student entity, grades
may
bemore
accurate than addresses. Instance example: data about
an internationalstudent
may
be less interpretablethan
that of adomesticstudent.
(Premise 1.4) Recursive quality indicators:
One
may
ask"what
is the quality of the quality indicator values?" Inthis paper,we
ignore the recursive notion ofmeta-quality indicators, as
our
main
objective is todevelop a quality perspective in requirements analysis.
Thisisavalidissue,however,
and
ishandled in [28]where
thesame
taggingand
query
mechanism
applied toapplicationdataisappliedtoqualityindicators.
2.2.
Premises
related
todata
quality
definitions
and
standards across users Becausehuman
insight isneeded
for data qualitymodeling
and because people have individual opinionsabout data quality, different quality definitions
and
standards exist across users.
The
users of a given (local)system
may know
the quality of the data theyuse.When
dataisexportedtootherusers,however,or
combined
withinformation ofdifferent quality,data quality
may
become
unknown,
leading to different needs in quality attributesacross application
domains and
users.The
following twopremises discuss that "data quality is in the eye of the beholder."
(Premise
2.1)User
specificity of qualityattributes: Quality parameters
and
quality indicatorsmay
vary fromone
user to another. Quality parameterexample:for a
manager
the critical quality parameter fora research report
may
be cost,whereas
for a financialtrader, credibility
and
timelinessmay
bemore
critical.Quality indicator example: the
manager
may
measure
cost in terms of the quality indicator (monetary) price,
whereas
the tradermay
measure
cost in terms ofopportunitycostor competitivevalueofthe information,
and
thus the quality indicatormay
beage of thedata.(Premise
2.2)Users
have
different quality standards: Acceptablelevels ofdata qualitymay
differfrom one usertoanother.
An
investor loosely followingastock
may
consider a tenminute
delay for share pricesufficiently timely,
whereas
a traderwho
needs pricequotes in real time
may
not consider ten minutes timelyenough.
2.3.
Premises
relatedtoa single userWhere
Premises 2.1and
2.2 stated that differentstandards, a single user
may
specify different qualityattributes
and
standards for different data. This issummarized
in Premise3below.(Premise 3) For a single user;
non-uniform
dataquality attributes
and
standards:A
usermay
havedifferent quality attributes
and
quality standards acrossdatabases, entities, attributes, or instances. Across
attributes example: a user
may
need
higher qualityinformation for
address
than for thenumber
ofemployees. Across instances example: an analyst
may
need higher quality information for certain
companies
than for others as
some
companies
may
be of particularinterest.
3
.
DATA
QUALITY
MODELING
We
now
present the steps in data quality modeling.In Section 2,
we
described data qualitymodeling
as aneffort similar in spirit to traditional data modeling, but
focusingonqualityaspects of thedata.
As
a result ofthissimilarity,
we
candraw
parallelsbetween
thedatabaselifecycle [23]
and
the requirements analysismethodology
developed in thispaper.
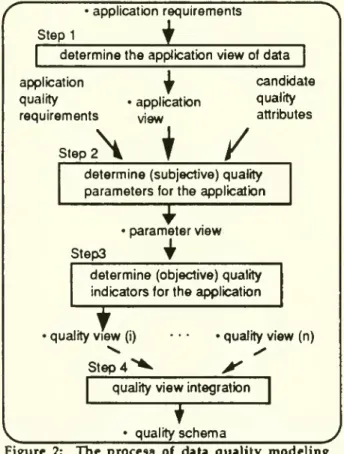
•applicationrequirements
Stepl
J
determinetheapplicationviewofdata
application quality requirements •application view candidate quality attributes Step 2
\
/
determine (subjective) quality
parametersforthe application
Step3
•parameter view
determine(objective) quality indicatorsfortheapplication
'qualityview (i)
Step
4
N
•qualityview(n)
quality viewintegration
T
quality
schema
Figure 2:
The
process of data qualitymodeling
The
finaloutcome
of data quality modeling, thequality schema,
documents
both application datarequirements
and
data quality issues considered importantby
the design team.The methodology
guidesthe design
team
as towhich
tags to incorporate into thedatabase. Determination of acceptable quality levels(i.e.,
filtering of data
by
quality indicator values) isdone
atquerytime. Thus, the
methodology
does not require thedesign
team
to define cut-off points, or acceptabilitycriteria
by which
data will be filtered.The
overallmethodology
isdiagrammed
above in Figure2. For eachstep,the input,output
and
process are included.A
detaileddiscussionofeach step is presented in the followingsections.3.1.
Step
1: Establishing the applicationview
Input. application requirements
Output:
applicationview
Process: This initial step
embodies
the traditional datamodeling process
and
willnot beelaboratedupon
here.A
comprehensive
treatment of the subject hasbeen
presented elsewhere[17][23].
The
objective is to elicit anddocument
application requirementsof thedatabase.We
will use the followingexample
applicationthroughoutthis section(Figure3).
Suppose
a stock traderkeeps information
about
companies,
and
trades ofcompany
stocksby
clients. Client is identifiedby
anaccount number,
and
has a name,address,and
telephonenumber.
Company
stock is identifiedby
thecompany's
ticker symbol*,
and
has share priceand
research reportassociated withit.
When
aclientmakes
a trade (buy/sell),information
on
thedate, quantity of sharesand
trade priceis stored as a record of the transaction.
The
ER
application
view
fortheexample
application isshown
inFigure3below.
CLIENT
COMPANY
STOCK
Figure 3: Application
view
(outputfrom
Step 1)3.2.
Step
2:Determine
(subjective) qualityparameters
Input: application view, application quality
requirements,candidate qualityattributes
Output: parameter
view
(quality parametersadded
to theapplicationview)A
tickersymbolisa short identifier for the companyProcess:
The
goal here is to elicit data quality needs,given an application view. For each
component
of theapplication view, thedesign
team
should determine thosequality parameters
needed
to support data qualityrequirements. For example, timeliness
and
credibilitymay
betwo
important quality parameters for data in a tradingapplication.Appendix
A
provides a list of candidate qualityattributes forconsiderationin this step.
The
list resultedfrom survey responses from several
hundred
data usersasked to identify facets of the term "data quality" (26).
Though
itemsinthe listare not orthogonal,and
thelist isnot provably exhaustive, the
aim
here is to stimulatethinking
by
the designteam
about
data qualityrequirements. Dataquality issuesrelevant for future
and
alternative applications should also be considered at this
stage.
The
designteam
may
choosetoconsider additionalparameters not listed.
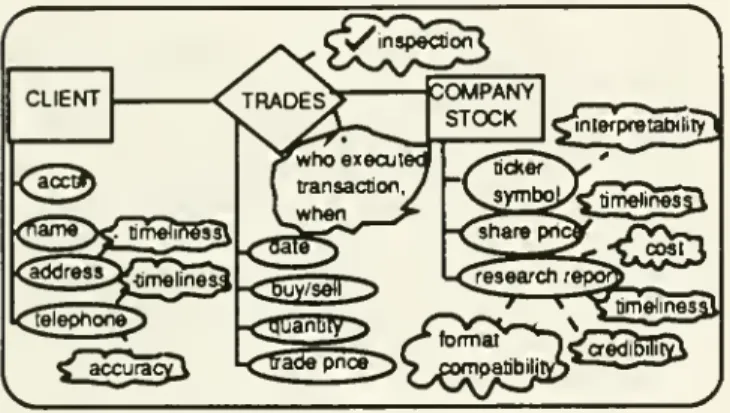
CLIENT ttckar share pricy
/VVh
-C"Pa 5**>Si^padbilja^r '* "^' " **Figure 4:
Parameter
view: quality parametersadded
to applicationview
(outputfrom
Step 2)An
example
parameterview
for the application isshown
above
in Figure 4. Each parameter is inside a "cloud"inthediagram. For example, timelinesson
shareprice indicates thatthe userisconcerned with
how
old the datais; cost fortheresearch report suggests that the userisconcerned withthe priceofthedata.
A
specialsymbol,V
inspection" is used to signify inspection (e.g., dataverification) requirements.
Quality parameters identified in this step are
added
to the application
view
resulting in the parameter view.The
parameterview
shouldbe
included as part of thequality requirements specification documentation.
3.3.
Step
3:Determine
(objective)quality
indicators
Input: parameter
view
(theapplicationview
withquality parameters included)
Output:
qualityview(theapplicationview withqualityindicators included)
Process:
The
goalhere is to operationalizethe subjectivequality
parameters
intomeasurable
or precisecharacteristics for tagging.
These
measurablecharacteristics are the quality indicators. Each quality
indicator isdepicted as a dotted-rectangle (Figure 5) and
is linked to the entity, attribute, or relation
where
therewas
previouslya qualityparameter.It is possiblethatduring Step2, thedesignteam
may
havedefined
some
quality parameters that aresomewhat
objective. Ifaquality parameteris
deemed
in this step tobe sufficiently objective (i.e., can
be
directlyoperationalized), it can remain. For example, if age had
been defined as a quality parameter,
and
isdeemed
objective, it can remain as a quality indicator. Quality
indicators replace the quality
parameters
in theparameterview, creatingthe quality view.
From
Figures 4and
5; corresponding to the qualityparameter
timeliness, is themore
objective quality indicatorage (ofthedata).The
credibility of the research reportisindicatedby
the qualityindicator analyst name.f who
—
™]j fwrion—
™
j nnspectioh-| rinspecaorTj
|_ in_s^ectedj (jnspectedj [procedurej LTSSHIL
_
J/l~oornpanyl /^ljiaxpe.
J
tttf
t ("report! Lnat-i _ freporij _'1
_
J '-^
4 rmedjg Ianalys| l_namej . CLIENT £acctJ) /_<3a»>
ana. ^addres^Iage, telephon^
fcATleHidrt—
I \ I"tra3enf^ f tfansa£Tio?ilLJV.J
Figure 5: Quality
View:
quality indicatorsadded
toapplication
view
(outputfrom
Step 3)Note
the quality indicator collectionmethod
associated with the telephone attribute. It is included to
illustratethat multipledata collection
mechanisms
can beusedfora given typeof data. Inthe telephone example, values for collection
method
may
include "over thephone"
or "froman
information service". In general,different
means
of capturing data such as bar codescanners in supermarkets, radio frequency readers in the
transportation industry,
and
voice decoders each hasinherent accuracy implications. Error rates
may
differfrom devicetodevice orin different environments.
The
quality indicator media for research report is to indicate
the multiple formatsof database-stored
documents
suchasbit
mapped,
ASCIIor postscript.The
quality indicatorsderived
from
the"•
inspection" quality parameter indicate the inspection
mechanism
desired to maintain data reliability.The
specific inspection or control
procedures
may
beidentified as part of the application documentation.
These
procedures
might
includedouble
entry ofupdate constraints, or
manual
processes for performingcertification
on
thedata.The
resulting quality view, together with theparameterview, should be included as part of the quality
requirements specification documentation.
3.4.
Step
4:Perform
qualityview
integration(and
applicationview
refinement)
Input: qualityview(s)
Output: (integrated) quality
schema
Process:
Much
likeschema
integration [2],when
thedesign is large
and
more
thanone
set of applicationrequirements is involved, multiple quality views
may
result.
To
eliminateredundancy and
inconsistency, theseviews
must
be consolidated into a single globalview
sothata variety of data qualityrequirements canbemet.
This involves the integration of qualityindicators. In
simplercases,a union of these indicators
may
suffice. Inmore
complicated cases, such as non-orthogonal qualityattributes, thedesign team
may
examine
the relationshipsamong
the indicators in order to decidewhat
kind ofindicators tobe includedinthe integrated quality schema. For example,
one
qualityview
may
have age
asan
indicator,whereas anotherquality
view
may
have
creationtime. In this case, the design
team
may
choose creationtime for the integrated
schema
because age can becomputed
givencurrenttimeand
creationtime.Anothertask that needsto beperformedat this stage
is are-examination of thestructural aspectofthe
schemas
(Premise 1.1). In the
example
application, for instance,company
name
is not specified as an entity attribute ofcompany
stock (in the application view) but ratherappears
as a quality indicator toenhance
theinterpretability of ticker symbol. After re-examining the
application requirements, the design
team
may
concludethat
company
name
should be included as an entityattribute of
company
stock instead of a quality indicator forticker symbol.In the
example
application, because onlyone
set ofrequirementsis considered,only
one
qualityview
resultsand
thereis noview
integration.The
resultingintegratedquality schema,togetherwiththe
component
quality viewsand
parameter views, should be included as part of thequality requirements specification documentation.
Thisconcludes the four steps of the
methodology
fordata quality requirementsanalysis
and
modeling.4.
DISCUSSION
The
data qualitymodeling approach
developed inthispaper providesa foundationfor the
development
ofaquality perspectiveindatabasedesign. End-usersneed to
extract qualitydata from the database.
The
dataqualityadministrator needs to monitor, control, or report
on
thequality of information.
Users
may
choose
to only retrieve or processinformation of a specific "grade" (e.g., provided recently
via a reliable collection
mechanism)
or inspect dataquality indicators todetermine
how
to interpretdata[28].Data
quality profilesmay
be stored for differentapplications.
For example, an information clearing
house
foraddresses of individuals
may
haveseveralclasses of data.Fora mass mailing application there
may
be no need toreach thecorrect individual (by name),
and
thusa querywith
no
constraints over quality indicatorsmay
beappropriate. For
more
sensitive applications, suchasfundraising, the user
may
query
overand
constrain qualityindicators values, raising the accuracy
and
timeliness ofthe retrieved data.
The
administrator's perspective is in the area ofinspection
and
control. In handling an exceptionalsituation, such as tracking an erred transaction, the
administrator
may
want
to track aspects of the datamanufacturing process, such as the time of entry or
intermediate processing steps.
Much
like the "papertrail" currently
used
in auditing procedures, an"electronictrail"
may
facilitate theauditing process.The
"inspection" indicator is intended to
encompass
issuesrelated to the data quality
management
function.Specifications
may
be
included such as those forstatistical process control, data inspection
and
certification, data-entry controls,
and
potentially includeprocess-based
mechanisms
such asprompting
for datainspection on a periodic basis orinthe event of peculiar
data.
Developing ageneralizable definition fordimensions
ofdata quality is desirable. Certain characteristics
seem
universally important such as completeness, timeliness,
accuracy,
and
interpretability.Some
of theitems listed inAppendix
A, however, applymore
to the information system (resolution of graphics), the information service (clear data responsibility), or the information user (pastexperience), than tothe data itself.
Where
oneplaces theboundary
of the concept of data quality will determinewhich
characteristics are applicable.The
derivationand
estimation of quality parameter values
and
overall dataquality from underlying indicator values remains anarea
forfurther investigation.
Organizational
and
managerial issues indata qualitycontrol involve the
measurement
or assessment of dataquality, analysis of impacts
on
the organization,and
improvement
ofdata qualitythroughprocess and systemsredesign
and
organizationalcommitment
to data quality[13H27]. Cost-benefit tradeoffs in tagging
and
trackingdata quality
must
be considered.Converging
on
standardized data qualityattributes
may
be necessary fordata quality
management
in caseswhere
data istransported across organizations
and
application domains.These additional implementation
and
organizationalissues are critical to the
development
ofa quality controlperspective in data processing.
5.
CONCLUSION
In this paper
we
have
established a set of premises,terms,
and
definitions for data quality,and
developed astep-by-step
methodology
for data quality requirementsanalysis, resulting in an ER-based quality schema. This
paper contributes in three areas. First, it provides a
methodology
fordata quality requirements collectionand
documentation. Second,it demonstrates that data quality
canbeincludedasanintegralpart of the database design
process. Third, it offers a perspective for the migration
from today's focus
on
the applicationdomain
towards abroader concern fordata quality
management.
6.
REFERENCES
[I] Ballou, D. P.
&
Kumar.Tayi,G.(1989).Methodology
forAllocating Resources for Data Quality
Enhancement.
Communications
of theACM,
32(3),pp. 320-329. [2] Batini,C,
Lenzirini, M.,&
Navathe, S. (1986).A
comparative analysis of methodologies for database
schema
integration.ACM
Computing
Surveys, 18(4), pp.323-364.[3] Bodner, G. (1975). Reliability
Modeling
of InternalControl Systems. Accounting Review,50(October), pp.
747-757.
[4]
Codd,
E. F.(1970).A
relationalmodel
ofdatafor largeshared data banks.
Communications
of theACM,
13(6),pp. 377-387.
[5)
Codd,
E. F. (1986).An
evaluationscheme
fordatabasemanagement
systems thatare claimed toberelational.The
Second
InternationalConference
on
Data
Engineering,LosAngeles,
CA.
1986.pp.720-729.[6] Crosby, P. B. (1979). Quality is Free.
New
York: McGraw-Hill.[7] Crosby, P.B.(1984).QualityWithoutTears.
New
York:McGraw-Hill
Book
Company.
[81
Deming,
W.
E. (1982). Quality, Productivity,and
Competitive Position. Cambridge,
MA:
MIT
CenterforAdvanced
EngineeringStudy.[9] Elmasri,R. (1989).
Fundamentals
ofDatabaseSystems.Reading,
MA:
The Benjamin/Cummings
PublishingCo., Inc.
[10] Fellegi,I.P.
&
Sunter, A.B.(1969).A
TheoryforRecord
Linkage. Journal of the
American
StatisticalAssociation,
64(number
328),pp. 1183-1210.[II] Garvin, D. A. (1988).
Managing
Quality-TheStrategicand
CompetitiveEdge
(1 ed.).New
York:The
FreePress.
[12]
Goodhue,
D. L.,Quillard,J. A.,&
Rockart,J.F.(1988).Managing
The
Data
Resources:A
Contingency
Perspective.
MIS
Quarterly,12(3),pp. 373-392.[13] Ishikawa,K. (1985).
What
is Total QualityControl?-theJapanese
Way. Englewood
Cliffs, NJ. Prentice-Hall[14] Laudon,K. C. (1986). DataQualityand
Due
ProcessinLarge
Interorganizational
Record
Systems.Communications
of theACM,
29(1),pp.4-11.[15] Liepins,G.E.it.Uppuluri,V.R. R. (1990). Data Quality
Control:
Theory and
Pragmatics.New
York: MarcelDekker, Inc.
[16] Lindgren, B. (1991). Getting data with integrity. Enterprise, (Winter), pp. 30-34.
[17] Navathe, S., Batini,
C,
&
Ceri,S. (1992).The
EntityRelationshipApproach.
New
York: Wileyand
Sons.[18]
Newcombe,
H. B.&
Kennedy,
J.M.
(1962). RecordLinkage:
Making
maximum
use of the discriminatingpower
ofidentifying information.Communications
of theACM,
5.[19]
Newcombe,
H. B., etal. (1959). Automatic Linkageof Vital Records.Science, 130(3381), pp. 954-959.[20] Shewhart,
W.
A.(1925).The
Application ofStatisticsasan
Aid
in Maintaining Quality of aManufactured
Product. Journal of the
American
Statistical Association,20,pp.546-548.[21] Stonebraker,
M.
&
Kemnitz, G. (1991).The
PostgresNext-Generation
Database
Management
System.Communications
of theACM,
34(10), pp. 78-92 (October).[22] Taguchi, G. (1979). Introduction to Off-line Quality
Control.
Magaya,
Japan: Central Japan QualityControlAssociation.
[23] Teorey,T.J. (1990).Database
Modeling
and
Design:The
Entity-RelationshipApproach.
San
Mateo,CA
:Morgan Kaufman
Publisher.[24]
Wang,
Y. R.&
Madnick,S. E. (1990).A
PolygenModel
for
Heterogeneous
Database
Systems:The
Source Tagging Perspective, 16th Conferenceon Very
LargeDataBases, Brisbane,Australia. 1990.pp.519-538. [25]
Wang,
Y. R.&
Madnick,S.E.(1990).A
Source TaggingTheory
forHeterogeneous
Database
Systems,International
Conference
on
Information Systems,Copenhagen, Denmark.
1990. pp. 243-256.[26]
Wang,
Y. R.&
Guarrascio,L.M.
(1991).DimensionsofData
Quality:Beyond
Accuracy.
(CISL-91-06)Composite
InformationSystems
Laboratory, Sloan School ofManagement,
Massachusetts Institute ofTechnology, Cambridge,
MA,
02139 June1991.[27]
Wang,
R. Y.&
Kon, H. B.(1992).Towards
Total Data QualityManagement (TDQM).
In R. Y.Wang
(Ed.),Englewood
Cliffs,NJ: PrenticeHall.[28]
Wang,
Y. R.tcReddy,M.
P., Kon,H.B.(1993).Toward
Quality Data:
An
Attribute-based Approach, to appearin the Journal of Decision
Support Systems
(DSS),Special Issue
on
Information Technologiesand
Systems
[29] Zarkovich. (1966).Qualityof Statistical Data.
Rome:
Food
and
Agriculture Organization of the UnitedA
ppendix
A
:Candidate
Data Quality Attributes (input to Step 2)Date
Due
»8I»|(
MIT LIBRARIES DUPl