Comparison of the Growth and Monoclonal Antibody Production
of Suspended Mammalian Cells in Three Perfusion Systems
by
Kathy Hufford B.S. Chemical Engineering
Massachusetts Institute of Technology, 2005 Submitted to the Biological Engineering Division In Partial Fulfillment of the Requirements for the
Degree of
Master of Engineering in Biological Engineering at the
Massachusetts Institute of Technology February 2007
© 2007 Massachusetts Institute of Technology All Rights Reserved
Signature of Author
Certified by
Biological Engineering Division January 19, 2007
Jean-Francois Hamel Research Engineer and Lecturer of Chemical Engineering Associate Industrial Liaison Thesis Supervisor
Accepted by
C.-Bevin Engelward Associate Professor of Biological Engineering MEBE Program Director
O'-'kHUSETTS ECHNOSLY
O
z TECHNOLOGY
AUG 0
2
2007
LIBRARIES
--- r--I -. · I~M n I . . . II ILComparison of the Growth and Monoclonal Antibody Production of
Suspended Mammalian Cells in Three Perfusion Systems
by
Kathy Hufford
Submitted to the Biological Engineering Division On January 19, 2007 in Partial Fulfillment of the
Requirements for the Degree of
Master of Engineering in Biological Engineering ABSTRACT
The purpose of this thesis was to provide a broad survey of bioprocess options for typical drug production vehicles in the biotechnology industry. This goal was
accomplished by comparing the growth and monoclonal antibody production by HPCHO Chinese hamster ovary cells and IB4 hybridoma cells in batch, fed-batch, and three perfusion systems: the stirred ceramic membrane reactor (SCMR), the alternating tangential flow (ATF) hollow fiber membrane system, and the external spin filter (ESF)
system.
The batch experiments for each cell line were used as base case scenarios for the comparisons of cell growth and monoclonal antibody production. The fed-batch
experiments for each cell line did not vastly improve the cell growth and monoclonal antibody production over the batch cases. The SCMR perfusion system greatly improved the cell growth and monoclonal antibody production for each cell line. The maximum viable cell concentration of the IB4 hybridoma cells in the SCMR experiment was over seven times that found in the batch experiment and the monoclonal antibody production in the SCMR experiment was over ten times that found in the batch experiment. The
ATF perfusion system greatly increased the cell growth for each cell line over the batch
cases, but the shear forces created by the system adversely affected the viability of the cells and the monoclonal antibody production was less than that of the SCMR
experiments. The ESF perfusion system damaged the HPCHO Chinese hamster ovary cells. For the production of the IB4 hybridoma cells, the ESF system, as well as a modified ESF system, did not vastly improve the cell growth and monoclonal antibody over the base case due to cell aggregation and filter fouling.
The cell growth and productivity data, along with economic considerations, were evaluated for the purpose of recommending the best feeding strategy for each of the two cell lines studied. It was concluded that the most successful operation mode for the two cell lines studied was the SCMR perfusion system. More research is needed regarding the scale-up ramifications of the SCMR perfusion system as well as in the quantification of monoclonal antibodies, the optimization of fed-batch systems, and the use of
alternative perfusion systems.
Thesis Supervisor: Jean-Francois Hamel
Title: Research Engineer and Lecturer of Chemical Engineering Associate Industrial Liaison
Acknowledgements
This thesis would not have been possible without the support and advice of many different individuals and organizations.
First, I would like to thank my thesis supervisor, Chemical Engineering Research Engineer and Lecturer Jean-Francois Hamel. Since I began working in the chemical engineering teaching laboratory during 10.28 my junior year, Jean-Francois Hamel has been an indispensable resource in my academic and professional pursuits. I would like to thank him for his guidance and support over the past three and a half years.
Several staff members of the Hamel lab provided valuable assistance to this research. I would like to thank Erin Mathewson, Gemma Mendel, Tracie Saunders, and Anjali Verghese for their help with reactor sampling and maintenance of the cell culture
lab. Lindsay Tunney also helped in this manner, and also provided assistance with constructing schematic diagrams of feeding strategies and proofreading early copies of this report. Cem Albayrak provided instruction in operating the ATF system. These individuals, as well as Markdta Valterovi, also provided open ears and different perspectives when I encountered problems with research.
Many undergraduates provided assistance with routine tasks such as reactor sampling and medium preparation, as well as unique points of view regarding my research. I would like to thank the students that I taught in 10.28, as well as the undergraduate researchers that worked in the Hamel lab. In particular, I would like to thank Carissa Moore, Alyse Wu, and David Whitehead for their support, excitement, and hard work. Alyse Wu also provided assistance with constructing schematic diagrams of perfusion equipment and proofreading early copies of this report.
The professors and staff of both the Biological Engineering Division and the Chemical Engineering department at MIT were also quite helpful. I would like to thank the professors in particular for quality instruction and the departments in general for financial and intellectual support. I would like to thank Associate Professor Bevin Engelward, the director of the MEBE program. I would also like to thank Institute Professor D.I.C. Wang for his insight on the growth and production of Chinese hamster ovary cells in batch and fed-batch culture.
Several companies provided materials or assistance to make this research
possible. I would like to thank BD Biosciences, for the donation of cell culture medium. I would like to thank Sartorius BBI Systems for repairs and advice concerning the external spin filter system. I would also like to thank Groton Biosystems for an initial loan of the capillary electrophoresis unit and later advice on quantification of monoclonal antibodies in cell culture samples.
In conclusion, I would like to thank my family and friends, who have been supportive of all of my academic and personal adventures. This group includes my father, Kent Hufford, my mother, Nancy Hufford (who good-naturedly edited the results portion of this thesis), my sister, Kristin Swain, my best friend, Beth Clites, and finally, my fianc6e, Alex Golden.
Table of Contents
List of Figures 7
List of Tables 10
1 Introduction 11
1.1 Animal Cell Culture and the Production of Monoclonal Antibodies 11
1.2 Feeding Strategies for Animal Cell Culture 12
2 Research Objective and Experimental Design 18
2.1 Objective of Research 18
2.2 Hypothesis 19
2.3 Experimental Design - Cell Lines and Medium 20 2.4 Experimental Design - Analytical Equipment 21
2.5 Experimental Design - Feeding Strategies 24
2.6 Experimental Design - Cell Retention Devices 26 3 Experiments with HPCHO Chinese Hamster Ovary Cells 32
3.1 Batch system 32
3.2 Fed-batch system 36
3.3 Ceramic membrane system 50
3.4 Alternating tangential flow hollow fiber membrane system 58
3.5 External spin filter system 68
4 Experiments with IB4 Hybridoma Cells 76
4.1 Batch system 76
4.2 Fed-batch system 80
4.3 Ceramic membrane system 87
4.4 Alternating tangential flow hollow fiber membrane system 99
4.5 External spin filter system 108
5 Conclusions 122
5.1 Feeding Strategies of Mammalian Cells: Perfusion vs. Fed-Batch 122
5.2 HPCHO Chinese Hamster Ovary Cells 124
5.3 IB4 Hybridoma Cells 128
6 Future Directions 133
6.2 Optimized Fed-Batch System 134
6.3 Alternative Perfusion Systems 135
List of Figures
Figure 1 - A stirred tank reactor in batch mode. 13
Figure 2 - A stirred tank reactor in fed-batch mode. 14
Figure 3 - A stirred tank reactor in perfusion mode. 15 Figure 4- Standard curve for concentration of IgG2a measured by capillary
electrophoresis. 22
Figure 5 - Example of absorbance data generated by capillary electrophoresis analysis of an IgG2a sample from the perfusion experiment involving the
stirred ceramic membrane reactor. 23
Figure 6 - Flow rates of distilled water for various pump speeds on dual-headed
Masterfiex peristaltic pump. 25
Figure 7 - The stirred ceramic membrane reactor system, consisting of a ceramic membrane module of 10 cylindrical rods inserted into a typical bioreactor
set-up (adapted from figure by Alyse Wu). 27
Figure 8 - The ATF system, consisting of the controller, pump, housing, filtration device, joint assembly (connects the housing to the vessel), and typical bioreactor set-up. Pressurization and exhaust cycles alternate according to specified time sequences (adapted from figure by Alyse Wu). 28 Figure 9 - The ESF 100 G external spin filter system, consisting of a filter
element, stand, rotor, and typical bioreactor set-up (adapted from figure by
Alyse Wu). 30
Figure 10- Growth Data for HPCHO Batch Run 32
Figure 11 - Metabolic Data for HPCHO Batch Run 33
Figure 12 - Diameter and Osmolality Data for the HPCHO Batch Run 35
Figure 13 - Growth Data for HPCHO Fed-Batch No. 1 37
Figure 14- Comparison of Growth Data for HPCHO Batch Run and HPCHO
Fed-Batch Run No.1 38
Figure 15 - Metabolic Data for HPCHO Fed-Batch Run No. 1 40 Figure 16 - Diameter and Osmolality Data for HPCHO Fed-Batch Run No.1 41 Figure 17- Growth Data for HPCHO Fed-Batch Run No. 2 42 Figure 18 - Comparison of Growth Data for HPCHO Batch Run and HPCHO
Fed-Batch Run No. 2 43
Figure 19 - Metabolic Data for HPCHO Fed-Batch Run 2 (AA added) 46 Figure 20- Comparison of Diameter and Osmolality Data for HPCHO Fed-Batch
Run No. 1 and HPCHO Fed-Batch Run No. 2 48
Figure 22 - Growth Data for HPCHO SCMR Run
53
Figure 23 - Comparison of Growth Data for HPCHO Batch Run and HPCHOSCMR Run 55
Figure 24 - Metabolite Data for HPCHO SCMR Run 56
Figure 25 - Diameter and Osmolality Data for HPCHO SCMR Run 57
Figure 26- Growth Data for HPCHO ATF Run 60
Figure 27 - Comparison of Growth Data for HPCHO Batch Run and HPCHO
ATF Run 61
Figure 28 - Comparison of Growth Data for HPCHO SCMR Run and HPCHO
ATF Run 62
Figure 29- Metabolic Data for HPCHO ATF Run 63
Figure 30 - Diameter and Osmolality Data for HPCHO ATF Run 66
Figure 31 - Growth Data for HPCHO ESF Run 70
Figure 32 - Metabolic Data for HPCHO ESF Run 74
Figure 33 - Growth Data for IB4 Batch Run 76
Figure 34 - Metabolic Data for IB4 Batch Run 77
Figure 35 - Monoclonal Antibody Concentration Data for IB4 Batch Run 78 Figure 36 - Total Amount of Monoclonal Antibody Produced vs. Time for IB4
Batch Run 79
Figure 37 - Growth Data for IB4 Fed-Batch Run 81
Figure 38 - Comparison of Growth Data for IB4 Batch Run and IB4 Fed-Batch
Run 82
Figure 39- Metabolic Data for IB4 Fed-Batch Run 84
Figure 40 - Monoclonal Antibody Concentration Data for IB4 Fed-Batch Run 85 Figure 41 - Total Amount of Monoclonal Antibody Produced vs. Time for IB4
Fed-Batch Run 86
Figure 42 - Growth Data for IB4 SCMR Control Batch Run 88 Figure 43 - Monoclonal Antibody Concentration Data for IB4 Control Batch Run 89
Figure 44 - Total Amount of Monoclonal Antibody Produced vs. Time for IB4
Control Batch Run 90
Figure 45 - Growth Data for IB4 SCMR Run 92
Figure 46 - Comparison of Growth Data for IB4 Batch Run and IB4 SCMR Run 94
Figure 47 - Metabolic Data for IB4 SCMR Run 95
Figure 48 - Monoclonal Antibody Concentration Inside Reactor vs. Time for IB4
Figure 49 - Total Monoclonal Antibody Production vs. Time for IB4 SCMR Run 98
Figure 50 - Growth Data for IB4 ATF Run 101
Figure 51 - Comparison of Growth Data for IB4 Batch Run and IB4 ATF Run 102 Figure 52 - Comparison of Growth Data for IB4 SCMR Run and IB4 ATF Run 103
Figure 53 - Metabolic Data for IB4 ATF Run 104
Figure 54 - Monoclonal Antibody Concentration Inside Reactor vs. Time for IB4
ATF Run 105
Figure 55 - Total Monoclonal Antibody Produced vs. Time for IB4 ATF Run 106
Figure 56 - Growth Data for IB4 ESF Run 110
Figure 57- Comparison of Growth Data for IB4 Batch Run and IB4 ESF Run 111 Figure 58- Comparison of IB4 SCMR Run and IB4 ESF Run 112
Figure 59- Metabolic Data for IB4 ESF Run 115
Figure 60 - Monoclonal Antibody Concentration Inside Reactor vs. Time for IB4
ESF Run 116
Figure 61 - Total Monoclonal Antibody Produced vs. Time for IB4 ESF Run 117
Figure 62 - Growth Data for IB4 Modified ESF Run 118
Figure 63 - Metabolic Data for IB4 Modified ESF Run 119 Figure 64 - Cell Aggregation and Clumping in IB4 Modified ESF Experiment 120 Figure 65 - Summary of Growth Data for HPCHO Experiments 126
Figure 66 - Summary Growth Data for IB4 Experiments 129
List of Tables
Table 1 - Direct comparison of batch, fed-batch, and perfusion strategies. 16 Table 2 - Optimal Set of Perfusion Rates for SCMR Culture of IB4 Hybridoma
Cells in Serum-Free Medium in a 1 Liter Working Volume (adapted from
24). 52
Table 3 - Actual Set of Perfusion Rates for SCMR Culture of HPCHO Cells 52 Table 4 - Actual Set of Perfusion Rates for ATF Culture of HPCHO Cells 59 Table 5 - Actual Set of Perfusion Rates and Spin Filter Rotation Speeds for ESF
Culture of HPCHO Cells 69
Table 6 - HPCHO ESF Rotational Speeds and Corresponding Cell Densities in
the Reactor and Harvest Bottle, and Cell Viability in the Reactor 72 Table 7- Actual Set of Perfusion Rates for SCMR Culture of IB4 Cells 91 Table 8 - Actual Set of Perfusion Rates for ATF Culture of IB4 Cells 100 Table 9 - Actual Set of Perfusion Rates and Spin Filter Rotation Speeds for ESF
Culture of IB4 Cells 109
Table 10 - IB4 ESF Rotational Speeds and Corresponding Cell Densities in the
Reactor and Harvest Bottle, and Cell Viability in the Reactor 113 Table 11 - Direct comparison of batch, fed-batch, and perfusion strategies
(adapted from 1, 6, and research generated by this thesis). 123
Table 12- Summary of Key Data for HPCHO Experiments 125
1
Introduction
1.1 Animal Cell Culture and the Production of Monoclonal Antibodies
The pharmaceutical and biotechnology industries are vibrant and rapidly growing. The current demand for biopharmaceutical products is high and is expected to
significantly increase over the next few years. Across the market today, there are approximately 35 biopharmaceutical products available. An estimated 700
biotherapeutics are currently in clinical development, with nearly 200 of these products in late-stage trials (1). There are approximately 92 companies located in the United States and Europe operating Good-Manufacturing-Practice facilities to manufacture
biopharmaceutical products for clinical trials and market supply using mammalian cell culture. The worldwide mammalian cell culture capacity for the manufacturing of
biopharmaceuticals was estimated to be 1.7 million liters in 2004 and production capacity is expected to rise 48% over the next five years (1). This drastic increase in production capacity, however, is still insufficient to meet the growing market demand for
biopharmaceutical products.
One of the most important biopharmaceutical products manufactured by the pharmaceutical and biotechnology industries is the monoclonal antibody. Therapeutic monoclonal antibodies (mAbs) have developed into a beneficial and profitable class of biopharmaceutical products. The recombinant proteins currently in development are predominantly monoclonal antibodies and there are more than 150 mAb products in studies sponsored by companies worldwide (2). The market for monoclonal antibodies is expected to increase by 30% a year after having reached sales of over $6.5 billion in 2004. By 2008, 16 new monoclonal antibody products are expected to enter the market (3). The vast majority of these monoclonal antibodies are secreted from mammalian cell lines such as Chinese Hamster Ovary (CHO) cells and hybridoma cells. Human
Embryonic Kidney (HEK-293) and NSO (murine myeloma) cells are also utilized to produce monoclonal antibodies.
Current research focuses on the effort to meet this increasing market need for monoclonal antibodies by increasing the volumetric productivities of the bioreactors used
for their production. Some methods of meeting this demand include improving the design of the gene vector system of the cell line, optimizing the medium used to grow the cell line, down-regulation of apoptosis to prolong cell survival, and reducing the
heterogeneity of glycoforms of the product (4). Another method of meeting the increasing market need for monoclonal antibodies involves moving away from the
industry standard of the stirred tank reactor (STR) and investigating alternative bioreactor designs such as the airlift bioreactor (1). An airlift bioreactor is a bioreactor in which the cell culture is kept mixed and gassed by the introduction of a gas mixture at the base of a column-like reactor. The reactor is equipped with either a draught tube or another device by which the volume of the reactor is partitioned into a gassed and ungassed region. This experimental design generates a vertically circulating flow. The idea of utilizing novel bioreactors such as the Wave bioreactor in monoclonal antibody production has also shown some promise (5). In the Wave reactor, cells are grown in a pre-sterilized bag and agitation is accomplished by waves created by gently rocking the bag back and forth. Another way to increase volumetric productivity that shows great promise involves optimizing the feeding strategy of the production process. This method is best achieved by optimizing a fed-batch or perfusion process in the STR, but can also be accomplished by combining a fed-batch or perfusion feeding strategy with an unconventional bioreactor such as the Wave reactor (4).
1.2 Feeding Strategies for Animal Cell Culture
There are three main feeding strategies in cell culture: batch, fed-batch, and continuous feeding, also known as perfusion. In the batch mode of operation, cells are inoculated into nutrient-rich medium in the bioreactor and allowed to grow undisturbed. No additional nutrients are added during the run and cell growth continues only until the concentration of one of the nutrients becomes limiting or toxic waste products build up in the culture. The volume of the liquid in the bioreactor remains constant throughout the process because nothing is being added or removed. An illustration of batch mode is shown in Figure 1.
/
I
f.7A DLJAQ=
-*
t=to
LIQUID
PHASE
Figure 1 - A stirred tank reactor in batch mode (adapted from figure created by L. Tunney). Another approach to stirred-tank bioreactor operation controls cell growth by the addition of nutrients at one time or several times during the cycle. This operational mode is referred to as fed-batch because the bioreactor is inoculated in the same way as in the batch process but the cell culture is fed periodically while the experiment is running. Adding nutrients to a batch culture during the run can increase the amount of product harvested (6). In this case, the volume of liquid in the bioreactor increases with time due to the addition of nutrients during the run. About 70-90% of the final working volume is inoculated into the bioreactor and the remaining 10-30% of the final working volume is added during the run at one or several different time points. An illustration of fed-batch mode is shown in Figure 2.
There are many different approaches that may be taken in designing a fed-batch process (7). Feeding may be based on the consumption of glucose or other nutrients, such as amino acids. Feeding may also be based on the production of waste products or the ratio or nutrients to waste products. In addition to determining the basis for medium addition, the medium to be added to the culture must be chosen carefully. In some cases, concentrated commercial medium is used. In other cases, an initial medium is created from stock solutions of important nutrients and then is subsequently optimized to provide the culture the best growth and production possible (8). Various issues, such as expense, ease of use, and available analytical equipment, govern the choice of feeding strategy and medium composition of the fed-batch reaction.
.4
Feed
Figure 2 - A stirred tank reactor in fed-batch mode (adapted from figure created by L. Tunney). Fed-batch operation is an excellent way to increase the volumetric productivity of a bioreactor and is becoming one of the most popular production modes in industry (6). Since fed-batch operation is a variant of the standard batch mode, cells have already been well characterized for this mode of operation. Fed-batch operation can be performed in essentially any vessel in which a batch is performed, from a stirred tank reactor to a Wave bioreactor. Because of this characteristic, it is relatively easy to change cell lines and desired products in fed-batch facilities. Fed-batch systems are usually faster, cheaper, and easier to implement and reproduce than more complex feeding strategies such as perfusion. The validation and characterization of a fed-batch process, as well as the purification of the desired product, is therefore easier than with perfusion systems. The risk of contamination is less for a fed-batch process than for a perfusion process because fed-batch experiments require less equipment and fewer disturbances to the cell culture experiment. The production levels associated with fed-batch operation are significant and some yields of up to 5 g/L have been reported (9). Although high titres. have been achieved with fed-batch processes, greater volumetric productivity may be possible if growth-inhibitory by-products could be removed from the culture and a greater amount of fresh nutrients could be provided to the cells. Finally, the start-up costs and necessary plant capacities are generally higher for fed-batch processes than for perfusion processes (10).
In perfusion culture, the mammalian cells are retained in the reactor while fresh medium is added and toxic metabolites are removed. These cultures can be maintained for several weeks or months at a time. The main benefit of perfusion systems is that cells remain in the reactor while the secreted product is continuously harvested. A cell
retention device is typically used to allow for the separation of waste products from the cells and this device could be external or internal to the reactor. Cell densities greater than 107 cells/mL and with higher productivities have been achieved with perfusion systems in much smaller reactors than in other systems (4). Some examples of methods of cell retention devices include continuous centrifuges (11), tangential flow membrane filters (12, 13), dynamic filters (14, 15), spin-filters (16, 17), ultrasonic (18, 19) and dielectrophoretic separators (15, 20), gravity settlers (15, 21), hydrocyclones (15, 22), and ceramic membrane filters (23, 24). The most important technical aspects of any perfusion system are the method of cell retention and the feed rate of fresh medium. An illustration of perfusion mode is shown in Figure 3.
Harvest
Feed
Figure 3 - A stirred tank reactor in perfusion mode (adapted from figure created by L. Tunney). Perfusion culture of suspension mammalian cells offers several advantages over traditional batch and fed-batch modes of culture, all of which are important in the
volumetric productivities (in terms of the volume of the reactor used, rather than the medium consumed), and fast medium exchanges. A bioreactor used in a perfusion process may be up to ten times smaller for the production of the same quantity of product as would be necessary with other production modes of cell culture (4). Perfusion cultures can be more demanding to set up, can require more medium (which can be costly), may produce less consistent lots of product, and can be more susceptible to contamination than other production systems, but they provide a continuous stream of product over several weeks or months. A continuous stream of product is particularly useful if the desired product is susceptible to degradation in the culture environment or if the product stream can be transported directly to downstream processing. The economics of
perfusion processes can be quite favorable in the case of specialty pharmaceutical products, since a smaller reactor and media formulated in-house can be used to create a significant amount of valuable product.
Table 1 - Direct comparison of batch, fed-batch, and perfusion strategies (adapted from 1, 6). Process characteristics Batch Fed-Batch Spin-filter / Dialysis Membrane Perfusion
Cell generations Low Medium High
Cell concentration Low Medium High
Volumetric productivity Low Medium High
(reactor)
Volumetric productivity Medium High Low
(media)
Throughput (product/reactor) Low Medium High
Lot consistency High Medium Low
Cycle time Short Medium Long
Turnaround time Low Medium High
Waste generation Low Low High
Required materials Low Medium High
Operation Simple Simple More complex
Failure risk < 5% < 5% < 10%
Process development Low Medium High
Scale-up Easy Easy More complex
A direct comparison of batch, fed-batch, and various perfusion strategies is shown above in Table 1. Although the fed-batch strategy is currently the most popular operation mode in industry, there is much debate about the benefits of perfusion. Research is
underway to determine if the benefits of perfusion over fed-batch strategies outweigh the associated costs and risks associated with such complex systems.
2
Research Objective and Experimental Design
2.1
Objective of Research
The purpose of this thesis was to optimize and compare the growth and
production of monoclonal antibodies (mAb) by HPCHO Chinese hamster ovary (CHO) cells and IB4 hybridoma cells in three perfusion systems: the stirred ceramic membrane reactor (SCMR), the alternating tangential flow (ATF) hollow fiber membrane system, and the external spin filter (ESF) system. The growth and productivity data gathered from the perfusion systems were also compared to growth and productivity data gathered from batch and fed-batch systems. The cell growth and productivity data were
considered along with economic factors in recommending the best feeding strategy for each of the two cell lines evaluated.
The specific goals of this thesis project are outlined below:
1. To gain proficiency in operating laboratory bench scale bioreactors in batch,
fed-batch, and perfusion modes.
2. To analyze cell growth and health via the automated trypan blue assay.
3. To analyze metabolite and waste concentrations of the cell culture.
4. To analyze monoclonal antibody production of the suspended mammalian cells via capillary electrophoresis (CE).
5. To experiment with different fed-batch mediums and timelines to find the fed-batch feeding strategy yielding the greatest cell growth and productivity of two suspended mammalian cell lines.
6. To optimize the SCMR system in order to find the best conditions for cell growth and mAb productivity of two suspended mammalian cell lines.
7. To optimize the ATF system in order to find the best conditions for cell growth and mAb productivity of two suspended mammalian cell lines.
8. To optimize the external spin filter system in order to find the best conditions for cell growth and mAb productivity of two suspended mammalian cell lines.
9. To compare the three systems studied in terms of cell growth, mAb production, and economic factors and recommend the best feeding strategy for two suspended mammalian cell lines.
2.2 Hypothesis
It was believed that all three perfusion systems, as well as the fed-batch system, would support cell growth to a greater maximum cell concentration and achieve a greater monoclonal antibody production than the corresponding batch system for both the
HPCHO Chinese hamster ovary cells and the IB4 hybridoma cells. The fed-batch system would exhibit greater productivity per cell, but a lower maximum cell concentration than the three perfusion systems. All three perfusion systems would show productivities per cell that were greater than the batch system but less than the fed-batch system. The total productivities would nonetheless be higher in the three perfusion systems than both the batch and fed-batch systems.
From the findings of previous research (24), it was believed that the stirred ceramic membrane reactor system would reach a maximum cell concentration of IB4 hybridoma cells of approximately 3 x 10⁷ cells/mL at a viability of greater than 90%.
The productivity of this system was expected to be on the order of hundreds of
milligrams per liter. Because the HPCHO Chinese hamster ovary cells reached a lower maximum cell density and showed lower productivity in batch culture than the IB4 hybridoma cells, the stirred ceramic membrane reactor system was expected to perform worse for this cell line. The alternating tangential flow hollow fiber membrane system was expected to perform worse than the stirred ceramic membrane reactor system because the shear forces resulting from the ATF pump were expected to affect the viability of the cells and limit the possible maximum cell densities and productivities. Fouling of the hollow fiber membrane was also expected after several days of perfusion. Since there was not much research available on the use of external spin filters, it was difficult to predict the results of these experiments. Due to the greater amount of control over the forces felt by the cells, however, it was believed that the external spin filter
system would lead to the greatest maximum cell concentrations and the greatest productivities of monoclonal antibodies.
2.3 Experimental Design - Cell Lines and Medium
Two suspended mammalian cell lines that produced monoclonal antibodies were studied in this thesis project: a Chinese hamster ovary cell line referred to as "HPCHO" and a hybridoma cell line referred to as "IB4." These cell lines and the medium
necessary to grow these cell lines are detailed below.
The HPCHO cell line was a Chinese hamster ovary cell line producing
monoclonal antibody immunoglobulin G subclass 1 (IgGI). A 50-50 mixture of BD CHO Medium (BD Biosciences, MD) and Sigma-Aldrich Ex-Cell Animal Component Free CHO Medium (Sigma-Aldrich Corp., MO) was used in all experiments for this cell line. Additives to the BD CHO medium included penicillin-streptomycin (100 IU/mL and 0.1 mg/mL, respectively, Sigma-Aldrich Corp., MO), L-glutamine (2mM), sodium pyruvate
(1mM), and Pluronic-F68 (0.1% w/v, Sigma-Aldrich Corp., MO). Additives to the Sigma-Aldrich Ex-Cell medium included penicillin-streptomycin (100 IU/mL and 0.1 mg/mL, respectively, Sigma-Aldrich Corp., MO), L-glutamine (4mM), and sodium pyruvate (1mM).
The IB4 cell line was a mouse-mouse hybridoma cell line producing monoclonal antibody immunoglobulin G subclass 2a (IgG2a). BD Cell mAb Medium Quantum Yield (BD Biosciences, MD) was used in all experiments for this cell line. Additives included
10% w/v Fetal Bovine Serum (Hyclone, UT), penicillin-streptomycin (100 IU/mL and 0.1 mg/mL, respectively, Sigma-Aldrich Corp., MO), L-glutamine (2mM), sodium pyruvate (1mM), and Pluronic-F68 (0.1% w/v, Sigma-Aldrich Corp., MO).
To prepare for inoculation of all experimental systems, 1 mL samples of the cell lines from cryovial that had been frozen in liquid nitrogen were thawed and resuspended with fresh medium into 75 cm2 tissue culture flasks and stored inside an incubator (5%
CO2, 370C, 90% humidity). Once the cells fully recovered from liquid nitrogen storage
(the cell viability maintained a level above 90%), the cell lines were grown in spinner flasks inside the same incubator and were passaged every 3 days. The cell lines were
repeatedly passaged for at least 2 weeks before experiments in bioreactors were begun. Prior to inoculation, cells in 250-mL spinner flasks were harvested by centrifugation and resuspended with fresh medium. The desired initial cell concentration of all experimental systems was 1.5 - 2.5 x 10⁵ cells/mL after inoculation.
2.4 Experimental Design - Analytical Equipment
Cell density and viability were measured by an automated trypan blue cell density examination system (Cedex, Innovatis GmbH, Germany). For this reason, the term 'cell density' is used throughout this report to refer to 'cell concentration.' Growth rates were calculated from the data gathered by this examination system. The growth rate was calculated using a form of the exponential population growth equation,
Nf
=Noe&,in which Nf was the number of viable cells in the culture after time t; No was the number
of viable cells at the initial time; k was the growth rate; and At was the time elapsed (tf
-to). Rearranging this equation to solve for k and substituting Nv and Ntot with viable cell density, pv, and total cell density, ptot, because the ratio between these two parameters is the same as between Nv and Ntot, the growth rate k was solved by:
k In pf - ln p0 At
This formula was used to solve for point growth rates, or the growth rate over the interval of time between each sampling of the reactor. The growth rate was only calculated for points that fell in the exponential growth phase of the cell culture. The average growth rate for the entire exponential growth phase was then determined by averaging the point growth rates.
Glutamine, glutamate, glucose, lactate, ammonium, sodium, and potassium concentrations were measured off-line by a NOVA BioProfile 400 (Nova Biomedical Corporation, MA), which utilized a series of membranes and electrodes. The osmolality of the culture was calculated, also by the NOVA BioProfile 400. When certain
concentration was not considered in the analysis of the data. When this calibration error also effected the osmolality concentration, the osmolality value for that sample was also discarded. An external pH meter (Coming Inc., NY) was used to verify the pH of the culture off-line. flne U.U4 0.045 S0.04
S0.035
0.03 0.025 '0.015
w 0.01
0.005 0Figure 4 - Standard curve for concentration of IgG2a measured by capillary electrophoresis. The antibody content of the IB4 hybridoma cell culture was analyzed by capillary electrophoresis (Groton Biosystems, MA). The antibody content of the HPCHO cell line was not detected by this instrument and was therefore qualitatively compared by a number of variables to be discussed below. Culture samples were centrifuged at 1000 rpm for 1 minute and the supernatant was filtered through a 0.2 gm syringe filter. A filtered sample of 150 tL was mixed with 150 tL of sample buffer (CGE Protein Sample Buffer, Groton Biosystems, MA). Each sample was run on the machine with the
following protocol: run buffer was delivered through the capillary for 3 minutes at 1000 mBar and no voltage, then the sample was delivered through the capillary for 0.2 minutes at 200 mBar and no voltage, and finally the capillary was placed in run buffer and a voltage of -23.3 kV was maintained for 50 minutes. The temperature of the sample and capillary electrophoresis machine was maintained at 260C, the wavelength of the lamp
I I
0 50 100 150 200 250
used was 214 nm, the range was 0.2 absorbance units (AU), and the time constant was 0.1 second.
A standard curve was first generated using IgG2a mouse isotype control (Sigma-Aldrich Corp., MO). This standard curve is shown in Figure 4. A linear regression trend line was fit to the data and is shown in Figure 4. The R-value for this trend line was 0.983, which is a good fit. The line was not fit through the origin of the standard curve, because the capillary electrophoresis system did not detect concentrations below 10 ng/mL and the data was nonlinear below 25 ng/mL. The peak area calculated from the absorbance plot was used to estimate the concentration of the antibody. An example of the most concentrated antibody sample from the perfusion experiment involving the stirred ceramic membrane reactor system is shown in Figure 5.
3- • 1t'iS•llmlE!Im -t~ I0S~pO~d¶ ~lO8O2OO~a J. V ' 004 .... ... . ...---0.0 - --- ... --- ... --- ... --- . . ... --- -- ... ... .. ... ... . . ... ... ... --- -- --- -- - - --- - . ... 0 .... ---
---Figure 5 - Example of absorbance data generated by capillary electrophoresis analysis of an IgG2a sample from the perfusion experiment involving the stirred ceramic membrane reactor.
An attempt was made to evaluate the reproducibility of the capillary
electrophoresis data. A sample of 100 ng/mL was analyzed and the area of a sample peak determined seven times. The average value was 0.0009397 AU and the standard
deviation was determined to be 0.0001417 AU. The standard deviation of the seven samples was found to be about 15% of the average value of the seven samples.
electrophoresis instrument was not possible due to blockage of the capillary used for experimental analysis. Changing this capillary would have altered the conditions under which the experimental data was analyzed, and would have produced reproducibility and accuracy data that would not have been reflective of the analysis of the experimental samples. Since further quantification was not possible, error bars representing 15% of the experimental values will appear in the capillary electrophoresis data below.
2.5 Experimental Design - Feeding Strategies
A batch run was performed for each cell line as a base case for comparing the fed-batch and perfusion systems. The bioreactor used was a 3-L (1.8-L working volume) Applikon glass autoclavable bioreactor (Applikon Biotechnology B.V., Netherlands) with two three-fin pitched-blade impellers. An ADI 1030 Bio Controller (Applikon
Biotechnology B.V., Netherlands) was used to control temperature, dissolved oxygen, and pH using proportional integral derivative (PID) control of all three culture conditions. During batch culture, the air flow rate to the reactor was set at 0.1 vvm. The dissolved oxygen (DO) value was maintained at 50% of air saturation by sparging of 02. The pH of the culture was maintained at 7.0 with the combined addition of an aqueous solution of
IM NaOH and the sparging of CO2. The agitation of the culture was kept at 100 rpm. The temperature of the culture was maintained at 370C using a heat jacket. The inoculation density of each batch run was 1.5 - 2.5 x 10⁵ cells/mL and the working volume was 1.8 L. Sampling with the analytical equipment described in the previous section was performed twice daily, once in the morning and once in the evening. The sampling line was purged with 3 mL of culture and then 5 mL of culture was taken from the reactor to be analyzed.
Fed-batch experiments were performed for each cell line. The goal of these experiments was to develop an optimized feeding strategy to increase the maximum density and the monoclonal antibody productivity of the cells over the standard batch case. Time and equipment limitations were strong factors in the number of fed-batch experiments that were ultimately completed. In each fed-batch experiment, the same bioreactor, controller, and conditions were used as in the batch experiment, except that
the initial working volume was 1.6 L for the HPCHO cells and 1.65 L for the IB4 hybridoma cells. Concentrated basal medium was used for feeding the culture and was prepared using a Rota-Vapor apparatus (Btichi Labortechnik AG, Switzerland). For the HPCHO cells, 1 L of BD CHO Medium (BD Biosciences, MD) was concentrated to 250 mL. For the IB4 hybridoma cells, 1 L of BD Cell mAb Medium Quantum Yield (BD Biosciences, MD) was concentrated to 300 mL. The first feeding for both cell lines was
initiated after about 3 days, when the glutamine concentration was reduced to about a third of its original value, the glucose concentration was reduced to about half of its original value, and the concentrations of lactate and ammonium ion had rapidly
increased. Various later time points for feeding and additives to the concentrated feed mediums were considered.
0
4.5
4-S3.5
a E 2.5E 2
0 0 1.5 17 o 0.5-0 I I 40 50 60 70 Pump Speed (rpm)Figure 6 - Flow rates of distilled water for various pump speeds on dual-headed Masterflex peristaltic pump.
Perfusion experiments were performed for each cell line, using three different cell retention devices that will be described in the next section. The goal of these experiments was to find the optimal cell retention device and feeding strategy to increase the
maximum density and productivity of the cells over the standard batch and experimental fed-batch modes. Again, time and equipment limitations were strong factors in the number of perfusion experiments that were ultimately completed. In each perfusion
batch experiment. The reactor was inoculated in the same manner as the batch runs, but after about 70 hours, the cell retention device was initiated and the perfusion feeding strategy begun. At the 70 hour point, the cell culture was at about 2/3 of the maximum density of the batch experiment and there were significant decreases in glucose and glutamine concentrations and significant increases in lactic acid and ammonium
concentrations. The medium used in the perfusion feeding was the same basal medium with the same supplementations as described above for the batch experiments. Feeding
and harvesting was controlled by a dual-headed peristaltic pump (Masterflex, Cole-Parmer Instrument Company, IL) that was calibrated with distilled water. The flow rates
for various pump speeds are illustrated in Figure 6. Autoclaved 3 liter Nalgene bottles (Thermo Fisher Scientific Inc., MA) were used to supply the fresh medium and collect the spent medium. The feeding and harvesting rate began at about 0.5 working volumes /
day and then increased daily by 0.5 working volumes / day to a final rate of about 3 working volumes / day. If there were significant losses of glucose and glutamine concentrations to the culture or significant increases in lactic acid or ammonium
concentrations to the culture, the feeding and harvesting rates were increased twice daily instead of once daily. The culture was continued until the cell retention device was fouled, ending flow to the harvest bottle, or when the viability of the cell culture decreased below 75%.
2.6 Experimental Design - Cell Retention Devices
Three different cell retention devices were utilized in the perfusion experiments. One of these devices, the stirred ceramic membrane reactor (SCMR), was an internal cell retention device. The two other devices, the alternating tangential flow hollow fiber membrane (ATF) and the external spin filter (ESF), were external cell retention devices. The three methods of cell retention are described in more detail and accompanied by schematics below.
One method of perfusion culture involves inserting a system of ceramic
membranes into a stirred tank reactor. This stirred ceramic membrane reactor (SCMR) system has been used to obtain a dense cell culture of Saccharomyces cerevisiae with a
cell mass concentration or 207 g/L (25). A similar SCMR system utilizing asymmetric porous ceramic tubes was used to maintain a high filtrate flux and high cell density (141 g/L with 94% viability) of Lactococcus lactis (26). Yield and productivity were
improved by optimizing the feeding of fresh medium and filtering the supernatant of the dense cell culture. The SCMR system has been used for continuous production of lactic acid from molasses by dense perfusion culture of Lactococcus lactis (23). In addition, the SCMR system utilized in this thesis has been used to study the effects of increasing rates of perfusion rate on the cell growth of IB4 suspension hybridoma cells and the IgG2a
productivity of the cells (24). An optimal feeding strategy was found and led to a
maximum density of 350 x 105 cells/mL, a high mAb volumetric productivity (690 mg/L-d), and a high yield (340 mg/L). This paper, however, did not evaluate the effect of the presence of the ceramic membranes inside the reactor on the health and productivity of the cells, used serum-free medium, and did not involve comparisons to other types of perfusion systems.
Ceramic Membrane Module
Room for Probes /lembrane Jule rical rods) m port Teflon Holder
Figure 7 - The stirred ceramic membrane reactor system, consisting of a ceramic membrane module of 10 cylindrical rods inserted into a typical bioreactor set-up (adapted from figure by Alyse Wu).
A schematic of the SCMR system is shown in Figure 7. This system was
The ceramic material withstood high temperature and pressure well, so the bioreactor was autoclaved with the ceramic membrane module inside the bioreactor with a working volume of phosphate buffer saline solution. Each porous ceramic cylinder (Cefilt; NGK
Co. Ltd., Japan) was made of A1203 with a mean pore size and thickness of 25 gtm and 1.3 mm at the inner layer and 0.2 gm and 0.2 mm at the surface layer, respectively. Each ceramic cylinder had an inner diameter of 8 mm, and outer diameter of 11 mm, and a length of 115 mm. The total active surface area of the filter module, or the ten ceramic cylinders connected together, was approximately 400 cm2. The filter unit was connected
to tubing that led to the head plate of the reactor and then to the harvest line, which was controlled by a peristaltic pump. A second pump head on the same peristaltic pump was used to feed medium drop-wise into the reactor from a feeding line. The ceramic filter provided a 4.0 mL/h-cm2 flux for drawing distilled water. Experiments were carried out as described in the previous section. A control experiment in which the filter module was placed in the reactor for a batch run (with no feeding or harvesting of medium) was performed for each cell line.
. Quick Connect
Diaphragm Pump ...
Figure 8 - The ATF system, consisting of the controller, pump, housing, filtration device, joint assembly (connects the housing to the vessel), and typical bioreactor set-up. Pressurization and exhaust cycles alternate according to specified time sequences (adapted from figure by Alyse Wu).
Another method of perfusion culture is called the alternating tangential flow (ATF) filter system (Refine Technology, Co., NJ) (12, 13). A schematic of this system is shown in Figure 8. The ATF has three principal components: a hollow fiber filter
cartridge (0.2 gm pore size), the ATF diaphragm pump, and the ATF controller. The pump generates alternating tangential flow through the hollow fibers, reversing the fluid flow through the filter by changing pressure differences across the hollow fiber cartridge. This is accomplished by dividing the pump into two chambers with a flexible, medical-grade silicone diaphragm. The ATF controller cycles filtered air to and from one of the pump chambers, generating a positive of negative pressure gradient relative to the bioreactor and reversing the fluid flow through the hollow fiber membrane. This alternating tangential flow reduces the likelihood of filter fouling, a major disadvantage of using filter systems for perfusion culture. The cell-free filtrate is harvested by a peristaltic pump while the cells are returned to the reactor. Fresh medium is added to the reactor using another pump head on the same peristaltic pump but a separate line.
Sterilization is possible because the hollow fiber filter cartridge is autoclave safe. The ATF system has been used to grow mammalian cells to densities of over 107 cells/mL
(12). The ATF system has also been used in fed-batch investigations to concentrate culture before fresh medium was added.
In this thesis, the ATF system was used with both CHO cells and hybridoma cells in an effort to produce higher yields of monoclonal antibodies than was possible with other systems. The set-up of the system was as described above. It was necessary to determine pressure conditions and timing that best retained cells of each cell line without significantly damaging the cells in the process. The ideal pressure set point of the ATF controller was determined to be about 4 psi and the exhaust cycle lasted approximately 10
seconds. Experiments were carried out as described in the previous section.
A final method of perfusion culture involves the use of a spin filter. There are two types of spin filters: internal and external. Internal spin filters consist of a cylindrical metal wire mesh that spins on the impeller shaft of the bioreactor. The spinning of the mesh generates a centripetal force that forces cells to the outside walls of the reactor and allows smaller particles in the media, such as metabolites, to pass through the wire mesh. The particles that pass through the mesh are harvested from the reactor while the cells are
retained inside the reactor and fresh medium is added to the reactor through a different line. In an external spin filter system, the same principles apply, but the spin filter is not contained inside the bioreactor. Cell suspension is harvested from the bioreactor by a peristaltic pump and fed into the base of a glass vessel containing the external spin filter. The cells are kept against the vessel wall by centripetal force and are returned to the bioreactor, along with fresh medium. The smaller particles in the media are harvested from a line inside the wire mesh. Since the spin filter is not mounted on the impeller of the bioreactor, different speeds may be used to agitate the cells in the bioreactor and to separate them from media components in the spin filter.
io
Spin Filter Controller
Filtered Suspension
Filtrate
1Filter Housing
n Filter
Figure 9 - The ESF 100 G external spin filter system, consisting of a filter element, stand, rotor, and typical bioreactor set-up (adapted from figure by Alyse Wu).
There are many papers in the literature concerning the use of internal spin filters (16, 27), but external spin filters represent a relatively new method that has not been researched extensively. It has been found that scaling up the size of a spin filter does not affect the fluid exchange flow per unit bioreactor volume because the screen surface area
per bioreactor volume decreases (27). Since the fluid exchange flow per unit bioreactor volume is not increased with scale-up, it can be assumed that the risk of filter fouling will not increase with scale-up and that cell retention will not decrease with scale-up. It has been shown that at high spin speeds, fouling of the filter is prevented but the efficiency of cell retention is decreased. It has been shown that at low spin speeds, however, the efficiency of cell retention is increased while the incidence of filter fouling is increased (27). It is therefore necessary to find an optimal spin speed that maximizes cell retention but minimizes filter fouling. The use of external spin filters may make this goal possible because the speed of the external spin filter module is not limited by the rate of agitation in the bioreactor.
In this project, the ESF 100 G (Sartorius BBI Systems, Germany) was used. A picture of this system is shown in Figure 9. The system consists of a rotating spin filter element mounted on a stand and controlled by a rotor. The spin filter element is a closed rotating sleeve carrying a multilayer stainless steel mesh of 20 gm. The rotor can spin the element from 1 rpm to 2000 rpm, although the stand is only stable up to about 500 rpm. At 350 rpm, the flow in the filter element becomes turbulent, thus improving cell retention. It was necessary to determine the optimal rotation speed of the spin filter for perfusion of each cell line. A peristaltic pump with two heads was used to feed fresh medium to the reactor and extract medium from the external spin filter apparatus. An additional peristaltic pump was used to extract cell culture from the reactor at 200 rpm and deliver the material to the base of the external spin filter apparatus. Sterilization was possible because the entire spin filter apparatus may be autoclaved and aseptically
connected to the bioreactor. Experiments were carried out as described in the previous section.
3
Experiments with HPCHO Chinese Hamster Ovary Cells
3.1
Batch system
A batch experiment was performed with the HPCHO Chinese hamster ovary cell
line in the manner described above. The three-liter bioreactor was inoculated with a 1.8-liter working volume of cell culture at a density of around 2.5 x 10⁵ cells/mL. The only disturbance to the culture was the purging of the sample line of 3 mL and the sampling of
5 mL twice daily. The total amount of medium supplied to the HPCHO batch experiment was 1.8 liters. 5U 50 2 40
E
.° 30 , 20 10 n I UU 90 80 70 60 50 40 30 20 10 n 0 20 40 60 80 100 120 140 160 180 200 220Culture Time (Hours)
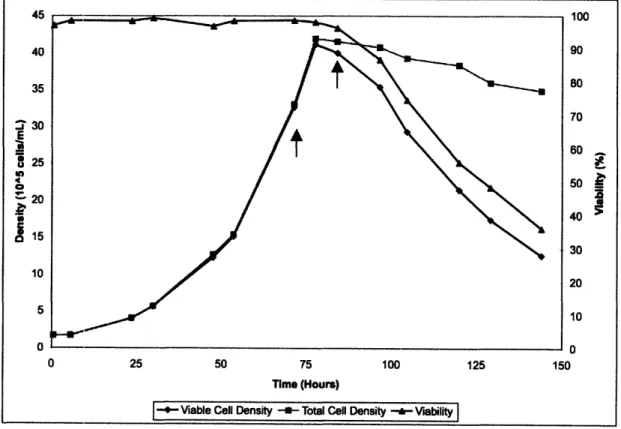
--- Viable Cell Density - Total Cell Density -- Viability
Figure 10 - Growth Data for HPCHO Batch Run
The cell concentration and viability data for the batch experiment are shown in Figure 10. The culture experienced a lag phase until around 30 hours. During this time, the CHO cells were adjusting to the change in environment resulting from transitioning from the spinner flask to the stirred tank reactor. Exponential growth of the culture began around 30 hours and continued until around 80 hours. The average growth rate during
this period was 0.026/hr. The maximum growth rate during this period was 0.058/hr and occurred at the end of the exponential growth phase around 75 hours. The culture experienced a stationary phase from around 80 hours to about 120 hours. A relatively long death phase began around 120 hours and continued until about 215 hours, when the viability of the cells dropped below 20% and the experiment was ended.
The maximum viable cell concentration reached by the batch CHO culture was 38.62 x 10⁵ cells/mL at 105 hours. The maximum total cell concentration achieved was 50.72 x 10⁵ cells/mL at 175 hours. The viability of the culture was very high throughout the lag, exponential growth, and stationary phases. The viability of the cells remained above 95% until 105 hours and remained above 90% until 130 hours. The cells began dying around 120 hours. For fed-batch and perfusion culture of these CHO cells, it was determined that feeding of additional nutrients should begin prior to 120 hours.
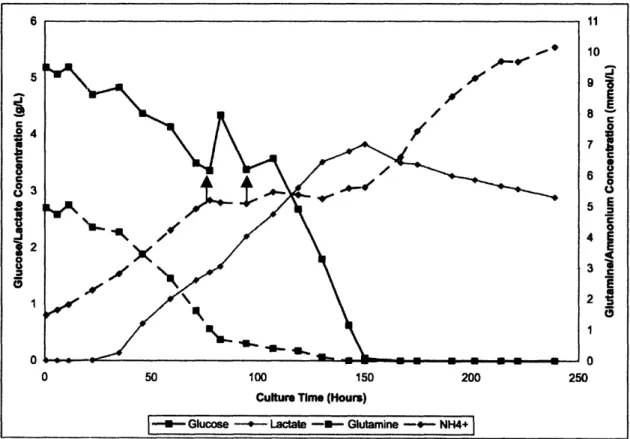
Figure 11 - Metabolic Data for HPCHO Batch Run
The major metabolite concentrations of the batch CHO culture are shown in Figure 11. The glucose concentration began at around 5.5 g/L, and was reduced to 0 g/L
by 120 hours. The lactate concentration began at 0 g/L and increased to over 3 g/L by 105 hours. After this point, the lactate concentration decreased until it was around 1 g/L
U 0
a
7 . 56-J 5 0C 40 0C 3 2 1 1 1c3 U5
4
a 3 0 0 A 0 20 40 60 80 100 120 140 160 180 200 220 Culture Time (Hours)at 220 hours. The increases in lactate concentration corresponded to the decreases in glucose concentration. The lactate concentration stopped increasing as soon as the glucose concentration fell to significantly low levels. The glutamine concentration began at around 6 mmol/L and was reduced to below 0.2 mmol/L by 105 hours. The
concentration of ammonium ion began at around 1 mmol/L and increased until it reached nearly 8 mmol/L at 220 hours. There was a slight decrease in ammonium ion
concentration from 80 to 105 hours, possibly due to the fact that the glutamine concentration fell to significantly low levels at this point. The ammonium ion
concentration begins to increase again after 105 hours, most likely due to death of the cells. It appears that the culture utilized glutamine at a faster rate than it used glucose and produced ammonium ion at a faster rate than it created lactate. This observation is incorrect, however, because less glutamine than glucose was initially available to the culture. The two metabolites may be used for two purposes. Glutamine may serve to jump start the growth of the cells and glucose may be more useful for division and the productivity of cells. From the metabolite concentration data, it is apparent that for the fed-batch and perfusion experiments, feeding should begin prior to 80 hours, or the point at which glutamine concentrations have decreased significantly.
Because the capillary electrophoresis assay was not reliable for analyzing the productivity of the HPCHO cell line, it is only possible to predict the productivity of the
cells and make qualitative comparisons between the batch experiment and the experiments involving other feeding strategies. It has been found that the specific antibody production rate of the H22 hybridoma cell line in perfusion culture is strongly related to the viable cell density of the culture (28). This correlation has been found, even though the substrate consumption and product formation rates of metabolites were
strongly related to specific growth rate (28). Although the HPCHO cells were not a hybridoma cell line like H22, they produced a similar product and it was assumed that the specific antibody production of the HPCHO cells correlated to the viable cell density of the culture. It could be argued that the viable cell concentration data for the batch experiment, therefore, establishes a base case scenario of antibody production for a comparison of the production achieved by the various feeding strategies.
From discussions with D.I.C. Wang about productivity of CHO cells (29), researchers have noticed that CHO cells produce more antibodies when the cells are placed under stress. This information is substantiated by a study involving humanized antibody production in CHO cells (30). When a single stressful culture condition is applied to the cell culture system (osmotic stress or low temperature, for example), the specific production of erythropoietin by a recombinant CHO cell line was enhanced 1.8-to 2.2-fold. When a rapid increase in the osmolality was induced in a culture of CHO cells, there was inhibited cell growth and increased mAb production (31). There is also evidence that an increase in osmolality in cell culture medium can lead to an increase in diameter of the cells (32). It is a logical assumption, then, that cells in an environment with a high osmolality that stop doubling but continue to grow larger are probably taking up nutrients for the purpose of antibody production rather than division (29).
ALU 18 16 14 C 0 a. 12 W E
'1
10
E a 6 4 2 n Duu 500 400 XE
0 0 E 3000
200 E 100 0 0 20 40 60 80 100 120 140 160 180 200 220 Time (Hours) -4- Diameter -i- OsmolalityFigure 12 - Diameter and Osmolality Data for the HPCHO Batch Run
Because of this assumption, the diameter of the HPCHO cells and the osmolality of the medium in the batch experiment were investigated. These data appear in Figure
constant and was in the 16 to 17 micron range. When the viability of the culture began to drop below 90% after about 120 hours, the diameter of the cells decreased to the 13.5 to
14.5 micron range. There were no significant increases in cell diameter during the batch experiment. The osmolality of the cell culture medium was over 320 mOsm/kg, which is a bit high for CHO medium (29). The osmolality increased slightly until 105 hours, when there was a sharp peak of 400 mOsm/kg. This may correspond to a peak in
production by the cells, according to the assumptions described above. The osmolality of the medium then decreased and leveled out around 340 mOsm/kg. With the viable cell concentration data, the cell diameter and osmolality data was used to qualitatively compare the production of the HPCHO cells in the batch mode to that of other feeding strategies.
3.2 Fed-batch system
Several fed-batch experiments were performed with the HPCHO Chinese hamster ovary cell line as described above. Initial fed-batch experiments were performed with various starting volumes ranging from 1 L to 1.65 L of a 50-50 mixture of BD CHO Medium (BD Biosciences, MD) and Sigma-Aldrich Ex-Cell Animal Component Free CHO Medium (Sigma-Aldrich Corp., MO). Each medium was supplemented as
previously described. It was found that 1.65 L of medium allowed the cells to grow in a matter most similar to that in the early stages of the batch experiment. This was due to the need for the volume of the culture to be great enough to completely immerse the two sets of impeller blades on the drive shaft of the reactor. These initial experiments also showed that feeding of the culture should proceed after about 72 hours of growth and could be supplied in around 100 mL bulk doses via a sterile syringe.
The next fed-batch experiments involved varying the composition of the feed medium. A 50-50 mixture of supplemented BD CHO medium concentrated via Rota-Vapor apparatus from 1 L to 250 mL and supplemented Sigma-Aldrich Ex-Cell Animal Component Free CHO medium concentrated via Rota-Vapor apparatus from 1 L to 350 mL was first utilized. As soon as this medium was added to the culture, glucose and glutamine uptake by the cells halted, the ammonium ion concentration increased
significantly, and the cells quickly began dying. Next, supplemented BD CHO medium concentrated via Rota-Vapor apparatus from 1 L to 250 mL was used as the only feed medium. Again, glucose and glutamine uptake by the cells halted, the ammonium ion concentration increased, and the cells began dying.
The first relatively successful fed-batch experiment with the HPCHO Chinese hamster ovary cell line utilized BD CHO medium that was only supplemented with penicillin-streptomycin (100 IU/mL and 0.1 mg/mL, respectively), sodium pyruvate (1mM), and Pluronic-F68 (0.1% w/v) as the feed medium. Again, this medium was concentrated via Rota-Vapor apparatus from 1 L to 250 mL. The three-liter bioreactor was inoculated with a 1.65-liter working volume of HPCHO culture with an initial density of around 1.5 x 10⁵ cells/mL. Disturbances included the purging of the sample line of 3 mL and the sampling of 5 mL twice daily, as well as two 120 mL bulk doses of feed medium delivered via sterile syringe at around 78 and 95 hours. When concentrated medium is considered, the total amount of medium supplied to the first HPCHO fed-batch experiment was 2.65 liters.
"U IUu
IUU
90 80 70 60~ 50 40 30 20 10
n
4UW 35 30E 25
20 15 10 5 0 0 n 0Culture Time (Hours)
-*--Viable Cell Density --*-Total Cell Density -k- Viability
100
150
200
250
The cell concentration and viability data for this fed-batch experiment are shown in Figure 13. The culture experienced a lag phase until around 45 hours. During this time, the CHO cells were adjusting to the change in environment resulting from
transitioning from the spinner flask to the stirred tank reactor. This period was probably longer in the fed-batch experiment than in the batch experiment for two reasons. First, the initial cell concentration in the reactor was lower in the fed-batch experiment than in the batch experiment (1.5 x 10⁵ cells/mL rather than 2.5 x 10⁵ cells/mL). Second, the
environment in the reactor was probably harsher in the fed-batch experiment due to the decreased working volume of medium. This difference in the length of the lag phase also caused the start and end of the exponential growth phase of the fed-batch and batch cultures to differ by about 15 hours. A graph showing the cell concentration data for both the batch and fed-batch CHO experiments is shown in Figure 14, so that the two
experiments may be compared visually. The fed-batch data series have solid lines and the batch data series have dashed lines.
ou 50 -J
E
40 aS30
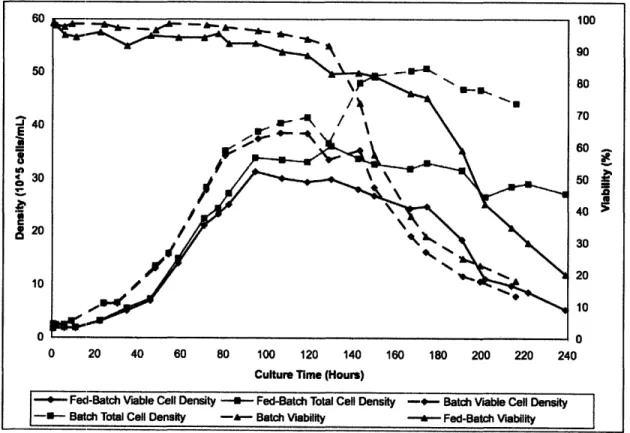
C 20 10 0 100 90 80 70 60 50 40 30 20 10 0 0 20 40 60 80 100 120 140 160 180 200 220 240Culture Time (Hours)
-- Fed-Batch Viable Cell Density --- Fed-Batch Total Cell Density -- Batch Viable Cell Density --- Batch Total Cell Density -A-- Batch Viability --- Fed-Batch Viability
Figure 14 - Comparison of Growth Data for HPCHO Batch Run and HPCHO Fed-Batch Run No.1 Exponential growth of the fed-batch culture began around 45 hours and continued until around 95 hours. The average growth rate during this period was 0.029/hr. The