HAL Id: hal-00304071
https://hal.archives-ouvertes.fr/hal-00304071
Submitted on 1 Apr 2008HAL is a multi-disciplinary open access
archive for the deposit and dissemination of sci-entific research documents, whether they are pub-lished or not. The documents may come from teaching and research institutions in France or abroad, or from public or private research centers.
L’archive ouverte pluridisciplinaire HAL, est destinée au dépôt et à la diffusion de documents scientifiques de niveau recherche, publiés ou non, émanant des établissements d’enseignement et de recherche français ou étrangers, des laboratoires publics ou privés.
Downslope windstorm in Iceland ? WRF/MM5 model
comparison
Ó. Rögnvaldsson, J.-W. Bao, H. Ágústsson, H. Ólafsson
To cite this version:
Ó. Rögnvaldsson, J.-W. Bao, H. Ágústsson, H. Ólafsson. Downslope windstorm in Iceland ? WRF/MM5 model comparison. Atmospheric Chemistry and Physics Discussions, European Geo-sciences Union, 2008, 8 (2), pp.6437-6468. �hal-00304071�
ACPD
8, 6437–6468, 2008 Downslope windstorm – WRF/MM5 comparison Ó. Rögnvaldsson et al. Title Page Abstract Introduction Conclusions References Tables Figures ◭ ◮ ◭ ◮ Back CloseFull Screen / Esc
Printer-friendly Version Interactive Discussion
Atmos. Chem. Phys. Discuss., 8, 6437–6468, 2008 www.atmos-chem-phys-discuss.net/8/6437/2008/ © Author(s) 2008. This work is distributed under the Creative Commons Attribution 3.0 License.
Atmospheric Chemistry and Physics Discussions
Downslope windstorm in Iceland –
WRF/MM5 model comparison
Ó. Rögnvaldsson1,2, J.–W. Bao3, H. Ágústsson1,4, and H. Ólafsson1,4,*
1
Institute for Meteorological Research, Reykjavík, Iceland
2
University of Bergen – UiB, Norway
3
NOAA/ESRL, Boulder, CO, USA
4
University of Iceland, Reykjavík, Iceland
*
now at: Bergen School of Meteorology, Geophysical Institute UiB, Norway
Received: 1 February 2008 – Accepted: 28 February 2008 – Published: 1 April 2008 Correspondence to: Ó. Rögnvaldsson ([email protected])
ACPD
8, 6437–6468, 2008 Downslope windstorm – WRF/MM5 comparison Ó. Rögnvaldsson et al. Title Page Abstract Introduction Conclusions References Tables Figures ◭ ◮ ◭ ◮ Back CloseFull Screen / Esc
Printer-friendly Version Interactive Discussion
Abstract
A severe windstorm downstream of Mnt. Öræfajökull in Southeast Iceland is simulated on a grid of 1 km horizontal resolution by using the PSU/NCAR MM5 model and the Advanced Research WRF model. Both models are run with a new, two equation plane-tary boundary layer (PBL) scheme as well as the ETA/MYJ PBL schemes. The storm is
5
also simulated using six different micro-physics schemes in combination with the MYJ PBL scheme in WRF. Output from a 3 km MM5 domain simulation is used to initialise and drive both the 1 km MM5 and WRF simulations. Both models capture gravity-wave breaking over Mnt. Öræfajökull, while the vertical structure of the lee wave differs be-tween the two models and the PBL schemes. The WRF simulated downslope winds,
10
using the MYJ PBL scheme, are in good agreement with the strength of the observed downslope windstorm, whilst using the new two equation scheme surface winds are considerably less than observed winds. The MM5 simulated surface winds, with the new two equation model, are in better agreement with observations than when us-ing the ETA scheme. Micro-physics processes are shown to play an important role in
15
the formation of downslope windstorms and lifting of the upslope isotherm layer from mountain height to about 1.3 times the mountain height leads to a significant increase in the downslope windstorm.
1 Introduction
Iceland is a mountainous island located in the middle of the North Atlantic Ocean in
20
the northern part of the storm track. Due to this, the climate and weather of Iceland are largely governed by the interaction of orography and extra-tropical cyclones. This interaction can be in the form of cold air damming by mountains or warm downslope descent. The atmosphere-mountain interaction can also cause local acceleration of the airflow or a forced ascending motion, causing extreme precipitation. As a result of
25
ACPD
8, 6437–6468, 2008 Downslope windstorm – WRF/MM5 comparison Ó. Rögnvaldsson et al. Title Page Abstract Introduction Conclusions References Tables Figures ◭ ◮ ◭ ◮ Back CloseFull Screen / Esc
Printer-friendly Version Interactive Discussion
Mountain waves and downslope windstorms have long been a target of research campaigns as well as theoretical and numerical research. The prime focus of the recent T-REX (Terrain-induced Rotor EXperiment) campaign Grubišić et al., 20071 in Sierra Nevada was on observations of mountain waves, rotor flow and low- and upper-level turbulence. This was done by means of ground-based observations and
5
state of the art remote sensors and airborne observing systems. A linear theory of downslope winds was developed bySmith(1985). The theory reasonably predicts the height of the dividing streamline (i.e. flow over vs. flow around), the turbulent zone, the wind speed and pressure. The theory is however limited to uniform incoming flow and stability. Durran (1990) described the fundamental concepts of mountain
10
waves and downslope winds. The effects of non-linearity were investigated and the importance of upslope stability in order for gravity waves to develop was emphasised. Research on Icelandic downslope windstorms was quite limited until recent studies byÁgústsson and Ólafsson(2007) andÓlafsson and Ágústsson(2007) (hereafter ÓÁ-07). In the ÓÁ-07 paper a severe downslope windstorm that hit Freysnes, Southeast
15
Iceland, in the morning of 16 September 2004 was investigated. This was done by utilising the PSU/NCAR MM5 numerical weather prediction model (Grell et al.,1995) and by analysing available observations. In this study, four simulations are carried out and compared for the same event as studied in ÓÁ-07 by using two mesoscale mod-els: V3-7-3 of MM5 and the Advanced Research WRF model (Skamarock et al.,2005)
20
and two different PBL schemes, the current ETA/MYJ planetary boundary layer models (Mellor and Yamada,1982;Janjić,1994,2001) and a new two equation model2. To
in-1
Grubišić, V., Doyle, J. D., Kuttner, J., Mobbs, S., Smith, R. B., Whiteman, C. D., Dirks, R., Czyzyk, S., Cohn, S. A., Vosper, S., Weissman, M., Haimov, S., De Wekker, S., Pand, L., and Chow, F. K.: The Terrain–induced Rotor Experiment: An overview of the field campaign and some highlights of special observations, B. Am. Meteorol. Soc., submitted, 2007.
2
The two-equation model is governed by Eqs. (24) and (48) inMellor and Yamada(1982). The approach to the numerical implementation of the TKE equation introduced byJanjić(2001) to avoid singularity in numerical solutions was extended to the mixing-length equation when the
ACPD
8, 6437–6468, 2008 Downslope windstorm – WRF/MM5 comparison Ó. Rögnvaldsson et al. Title Page Abstract Introduction Conclusions References Tables Figures ◭ ◮ ◭ ◮ Back CloseFull Screen / Esc
Printer-friendly Version Interactive Discussion
vestigate the effects of cloud micro-physics on the simulated windstorm, five additional simulations are done using the WRF model utilising different micro-physics schemes in combination with the MYJ planetary boundary layer scheme. The output from the 3 km domain of the simulation presented in ÓÁ-07 is used to initialise and drive the two models on a grid of 1 km horizontal resolution and 39 vertical layers with the model
5
top at 100 hPa. Both the MM5 and WRF models are configured in as similar way as possible. The objective of this study is to investigate the differences in the simulated dy-namics of the downslope windstorm that are caused by the differences in the numerics of the two models. A further objective is to investigate the sensitivity of the simulated downslope windstorm to different micro-physics schemes available in the WRF model.
10
Comparisons of the simulations are made using observed surface winds, temperature and precipitation. This paper is structured as follows: In the next section we describe the synoptic overview and list the available observational data in the area. The results are presented in Sect. 3. Discussions are presented in Sect. 4, followed by concluding remarks.
15
2 Synoptic overview and available observational data
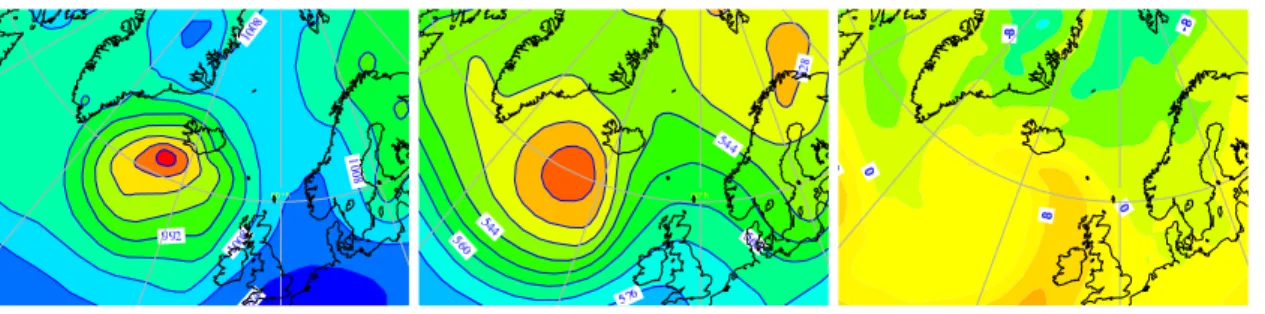
Figure1 shows the mean sea level pressure, the geopotential height at 500 hPa and the temperature at 850 hPa at the time when wind gusts greater than 50 ms−1 were
observed at the Skaftafell and Öræfi weather stations (see Fig.2for location of the sta-tions). At the surface, the geostrophic winds are from the ESE, while over land the
sur-20
face winds are from the ENE or NE. At 500 hPa, the flow is relatively weak (20–25 ms−1)
and the wind direction is from the SSE. There is a sector of warm air at 850 hPa stretch-ing from Ireland towards S-Iceland. In the early mornstretch-ing of 16 September 2004, the observed 2-m temperature at Skaftafell exceeds 15◦C which is about 7◦C above the
seasonal average. The geostrophic wind at the surface is greater than 30 ms−1 and
25
there is a directional and a reverse (negative) vertical wind shear in the lower part of
ACPD
8, 6437–6468, 2008 Downslope windstorm – WRF/MM5 comparison Ó. Rögnvaldsson et al. Title Page Abstract Introduction Conclusions References Tables Figures ◭ ◮ ◭ ◮ Back CloseFull Screen / Esc
Printer-friendly Version Interactive Discussion
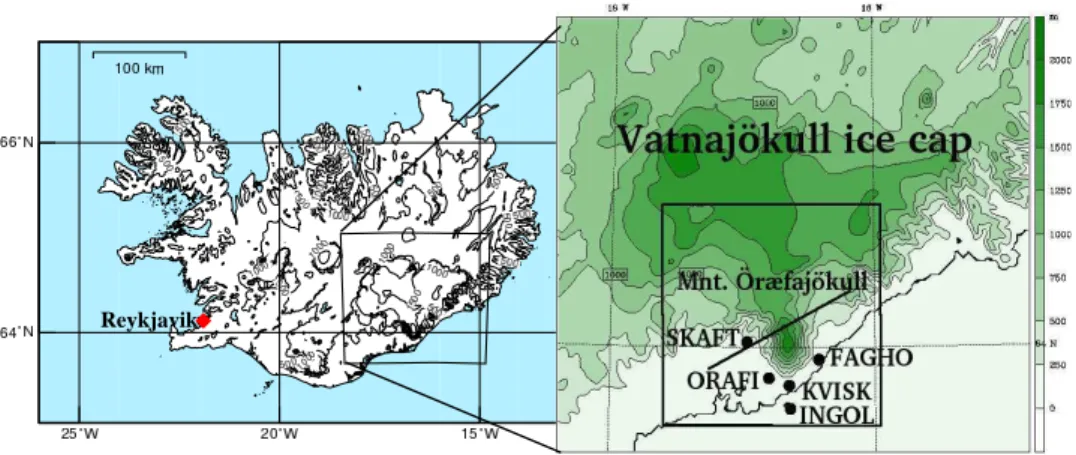
the troposphere. Figure2shows the domain setup of the MM5 and WRF simulations as well as local orography and the location of automatic meteorological stations. These are Skaftafell (SKAFT), Öræfi (ORAFI), Ingólfshöfði (INGOL), Fagurhólsm´yri (FAGHO) and Kvísker (KVISK). Surface wind speed and direction, gusts and temperature are all measured at these stations. At stations SKAFT, FAGHO and KVISK, accumulated
pre-5
cipitation is measured once to twice daily. The straight line crossing Mnt. Öræfajökull shows the location of the cross sections shown in Figs.5,8,9,10. Hvannadalshnjúkur, the highest peak of Mnt. Öræfajökull, exceeds 2100 m above sea level while the altitude of the Öræfajökull plateau is between 1900 and 2000 m a.s.l.
3 Results
10
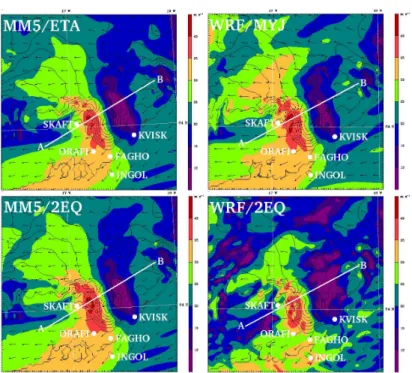
Both MM5 and WRF simulations capture strong winds over the Vatnajökull ice cap (Fig. 3) as well as over the lowlands. In all simulations the flow is decelerated up-stream of Mnt. Öræfajökull. The simulated near surface wind speed has a maximum immediately downstream of the highest mountain (Mnt. Öræfajökull). This maximum does not extend far downstream. There is also a secondary maximum of wind speed
15
emanating from the edge of the same mountain. This secondary maximum extends far downstream. Accumulated precipitation measured at stations SKAFT, FAGHO and KVISK is compared with simulated precipitation in Table1. Both models correctly sim-ulate the dry area downstream of Mnt. Öræfajökull but tend to overestimate the pre-cipitation on the windward side with the exception of WRF/2EQ. This overestimation
20
can, to some extent, be explained by under catchment of the rain gauges due to strong winds. The precipitation gradient reproduced in the WRF simulations (i.e., more pre-cipitation at KVISK than at FAGHO) is better than in the MM5 simulation. However, the precipitation values in the MM5 simulation are closer to the observed values. With regard to wind speed, there exists a noticeable quantitative difference between the four
25
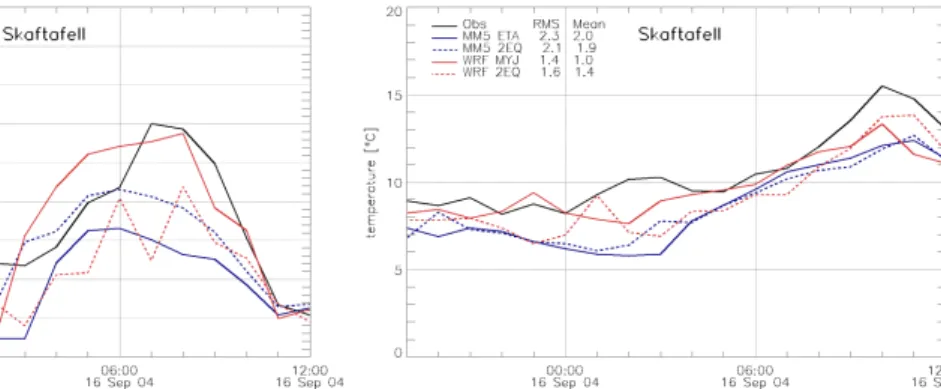
simulations. Figure4shows observed and simulated surface wind speed and tempera-ture at SKAFT. The WRF simulated downslope winds, using the MYJ PBL scheme, are
ACPD
8, 6437–6468, 2008 Downslope windstorm – WRF/MM5 comparison Ó. Rögnvaldsson et al. Title Page Abstract Introduction Conclusions References Tables Figures ◭ ◮ ◭ ◮ Back CloseFull Screen / Esc
Printer-friendly Version Interactive Discussion
in good agreement with the strength of the observed downslope windstorm, with the maximum wind speed as great as 29 ms−1, whilst using the new two equation scheme
surface winds only reach about 22 ms−1. The MM5 simulated surface winds, with the
new two equation model, are in better agreement with observations than when using the ETA scheme. Surface winds reach 22 ms−1 when using the two equation model
5
whilst the winds in the MM5/ETA simulation only reach about 17 ms−1. Further, the
2-m temperature is captured considerably better by the WRF model than by MM5. On average, the MM5 simulated 2-m temperature is 2–3◦C colder than measured while
the 2-m temperature in WRF is very close to the observed surface temperature. How-ever, at other stations (ORAFI, KVISK, FAGHO and INGOL) away from the wind
max-10
imum, the difference in temperature and wind direction between the four simulations are small (not shown). At station ORAFI the WRF/MYJ model overestimates the mean wind by approximately 5 ms−1 while MM5/ETA captures the wind field correctly. Both
two equation simulations (MM5/2EQ and WRF/2EQ) show similar results, the wind speed being 2–3 ms−1 greater than observed values. At KVISK both models perform
15
similarly, the MM5 underestimates the winds slightly while WRF slightly overestimates them. At station FAGHO the MM5 simulations are very similar, both simulations con-sistently underestimate the corner wind and fail to capture the maximum wind strength by 7–8 ms−1. The WRF simulations are considerably better, but still underestimate the
observed maximum winds (30 ms−1) by 4 ms−1. With the current model configuration,
20
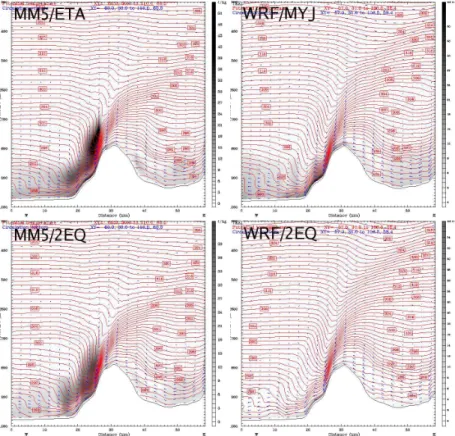
station INGOL is off-shore in both models. Hence, observed and simulated fields can not be compared in a logical manner. Figure5shows a cross section along line AB (cf. Fig.3) from the four simulations. In both the MM5 simulations, the distribution of tur-bulence kinetic energy (TKE) shows that there is very strong mountain wave breaking between approximately 800 and 650 hPa and very little wave activity above 500 hPa.
25
There is intense turbulence below 700 hPa associated with the wave breaking. At the surface, there is also a layer of high TKE. In spite of common features the MM5/ETA and MM5/2EQ simulations reveal important differences in the wave and TKE structure. Between 18:00 UTC and 23:59 UTC on 15 September, there is stronger TKE between
ACPD
8, 6437–6468, 2008 Downslope windstorm – WRF/MM5 comparison Ó. Rögnvaldsson et al. Title Page Abstract Introduction Conclusions References Tables Figures ◭ ◮ ◭ ◮ Back CloseFull Screen / Esc
Printer-friendly Version Interactive Discussion
900 and 700 hPa in the MM5/ETA simulation downslope of the mountain than in the MM5/2EQ simulation. The wave structure is however very similar. Few hours later, be-tween 01:00 UTC and 03:00 UTC on 16 September, the wave penetrates considerably deeper in the ETA/2EQ simulation. Surface wind speed at location SKAFT increases sharply from 3 ms−1 to 15 ms−1 whilst staying calm in the MM5/ETA simulation. The
5
TKE is confined below the Tpot=286 K isoline in the MM5/2EQ simulation but below the
Tpot=289 K isoline in the MM5/ETA simulation. During the peak of the windstorm, be-tween 06:00 UTC and 09:00 UTC on 16 September, there is stronger TKE aloft in the lee of the mountain in the MM5/2EQ simulation but the wave structure is now very sim-ilar. After 09:00 UTC there is very little difference between the two MM5 simulations.
10
The wave breaking, simulated by the WRF model, on other hand, differs from the wave breaking simulated by MM5. Particularly, the WRF simulated wave breaking is much weaker than that in the MM5 simulation. Interestingly, there is high TKE production at the surface in the WRF simulation as in the MM5 simulation. The cross-sections reveal greater differences between the two WRF simulations (WRF/MYJ and WRF/2EQ) than
15
there appear to be between the two MM5 simulations. Firstly, there is very little TKE aloft (900–700 hPa) in the WRF/2EQ simulation between 21:00 UTC and 03:00 UTC on 15–16 September. Both simulations show similar characteristics between 03:00 UTC and 06:00 UTC on 16 September but after that, between 07:00 UTC and 10:00 UTC there is considerably greater TKE aloft in the lee of the mountain in the WRF/2EQ
20
simulation.
3.1 Effects of micro-physics
The intensity of the simulated downslope windstorm is not only sensitive to the PBL schemes but also to the cloud micro-physics schemes.
ACPD
8, 6437–6468, 2008 Downslope windstorm – WRF/MM5 comparison Ó. Rögnvaldsson et al. Title Page Abstract Introduction Conclusions References Tables Figures ◭ ◮ ◭ ◮ Back CloseFull Screen / Esc
Printer-friendly Version Interactive Discussion
3.1.1 Overview of micro-physics schemes
The schemes range from the relatively simple two class (i.e. the number of water cat-egories considered beside water vapour), Kessler and WSM3 to the more complex WSM5 (a four class scheme without graupel) and the five class WSM6, Lin et al. and Thompson schemes. The Kessler scheme (Kessler,1969) is a simple warm-rain (i.e.
5
there is no ice) scheme often used in idealised cloud studies. The Lin et al. is a single momentum scheme that has six prognostic mixing ratios (including the one for water vapour) to describe the production and evolution of hydro-meteors in five categories; cloud water, rain, cloud ice, snow and graupel. All parameterisation production terms for these variables are based on Lin et al. (1983) and Rutledge and Hobbs (1984)
10
along with some modifications for saturation adjustment, following Tao et al. (1989), and ice sedimentation. The WRF Single-Moment 3-class (WSM3) scheme is based on the parameterisation described in Hong et al. (2004). There are a total of three prognostic variables in the scheme; water vapour, cloud water/ice, and rain/snow. A major difference between this scheme and other schemes available in WRF is that it
15
uses a diagnostic relation for ice number concentration, which is based on ice mass content rather than temperature. The WSM5 scheme is an extension to the WSM3 to include four categories of hydro-meteors; rain, snow, cloud ice, and cloud water. It allows supercooled water to exist and a gradual melting of snow as it falls below the melting point. A detailed description of this scheme can be found inHong et al.(2004).
20
The parameterisations of cloud micro-physics processes in the WSM6 (Hong and Lim,
2006) are in many ways similar to that of the Lin scheme. The main differences are in the accretion calculation. The freezing/melting processes are computed during the fall-term sub-steps to increase the accuracy in the vertical heating profile of these pro-cesses. The order of the processes is also optimised to decrease the sensitivity of
25
the scheme to the time step of the model. The saturation adjustment followsDudhia
(1989) andHong et al.(1989) and separately treats ice and water saturation processes. The Thompson scheme (Thompson et al.,2004) is developed from the bulk scheme
ACPD
8, 6437–6468, 2008 Downslope windstorm – WRF/MM5 comparison Ó. Rögnvaldsson et al. Title Page Abstract Introduction Conclusions References Tables Figures ◭ ◮ ◭ ◮ Back CloseFull Screen / Esc
Printer-friendly Version Interactive Discussion
ofReisner et al. (1998). The development emphasised on improving the prediction of freezing drizzle events. The scheme includes water vapour and five-category hydro-meteors plus number concentration for ice as prognostic variables. The lineage of the scheme includes primary ice nucleation as inCooper(1986) and auto-conversion as in Walko et al. (1995). A generalised gamma distribution for the graupel is used
5
in the scheme instead of the exponential distribution used in the other micro-physics schemes. Further, the scheme differs from the other in the following aspects:
1. The associated intercept parameter in the scheme depends on the mixing ratio instead of the remaining constant.
2. Riming growth of snow must exceed depositional growth of snow by a factor of
10
three before rimmed snow transfers into the graupel category.
3. The intercept parameter of the snow size distribution depends on temperature. 4. A different fall velocity is assigned to drizzle drops than to rain drops.
3.1.2 Sensitivity to micro-physics schemes
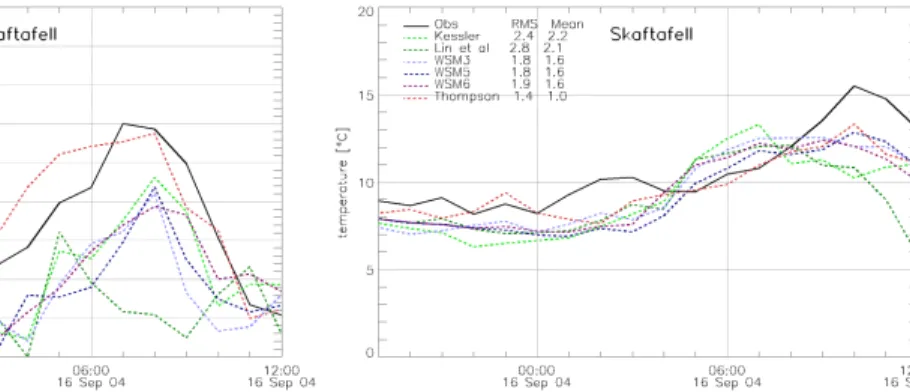
Figure6shows the variation of the WRF/MYJ simulated surface wind speed (left) and
15
temperature (right) at Skaftafell that is caused by using various options of the cloud micro-physics schemes. It is seen that there is a significant variation in the simu-lated maximum surface wind speed corresponding to the different cloud micro-physics schemes. The Thompson scheme produces results that are in best quantitative agree-ment with observed surface winds. The surface temperature is also best simulated with
20
the Thompson scheme, being very close to observed temperature during the peak of the storm (04:00 UTC to 08:00 UTC on 16 September). During this period the WRF model, using other micro-physic parameterisations, overestimates the surface temper-ature at Skaftafell by 1–3◦C. However, the model does not capture the observed
tem-perature maximum (15.5◦C) at 10:00 UTC, but the Thompson scheme produces results
ACPD
8, 6437–6468, 2008 Downslope windstorm – WRF/MM5 comparison Ó. Rögnvaldsson et al. Title Page Abstract Introduction Conclusions References Tables Figures ◭ ◮ ◭ ◮ Back CloseFull Screen / Esc
Printer-friendly Version Interactive Discussion
that are closest to the observed values. Accumulated precipitation as simulated using the various micro-physics schemes is shown in Fig.7.
The effects of increased complexity in the WSM schemes is clear. In the simulation using the simplest three class scheme the precipitation maximum is on the lee side of the mountain. As the effects of ice and snow hydro-meteors is taken into account in
5
WSM5 the upslope and lee side precipitation are of the same order of magnitude. In WSM6, where the effects of graupel are included, the maximum of simulated precipi-tation has shifted to the upwind slopes of the mountain. The downslope precipiprecipi-tation maximum is not seen in the relatively simple Kessler scheme. The precipitation pattern, using the Kessler scheme, is similar to that of the Lin et al., WSM6, and Thompson
10
schemes, although the simulated maximum is greater. Table 2 compares observed precipitation to simulated precipitation using the six micro-physics schemes. In gen-eral, all schemes overestimate the downslope precipitation at location SKAFT, with the exception of the Thompson scheme. At station FAGHO, the schemes overestimate the precipitation by a factor of 1.6 (WSM5) to 2.7 (Lin et al.). During the accumulation
15
period observed wind speed at FAGHO ranged from 10 ms−1at 18:00 UTC 15
Septem-ber to 30 ms−1 at 09:00 UTC 16 September. During such high wind speeds it can be
assumed that a considerable proportion of the precipitation will not be measured by a conventional rain gauge as that at FAGHO. The observed wind speed at KVISK is considerably lower during the accumulation period, ranging from 4 ms−1 to 15 ms−1.
20
As observed wind speed is less at KVISK than at FAGHO observations give a greater underestimation of true ground precipitation at FAGHO than at KVISK. Consequently, it can be expected that simulated precipitation at KVISK will be in better agreement with observed precipitation than at FAGHO.
There is a distinct difference between the Thompson scheme and the other
25
five schemes when it comes to simulated surface wind speeds in the wake of Mnt. Öræfajökull. The simulated wind speed is considerably less than observed wind speed at location SKAFT in all micro-physics schemes but the Thompson scheme. Figure8shows a cross section along line AB (cf. Fig.3) for the various micro-physics
ACPD
8, 6437–6468, 2008 Downslope windstorm – WRF/MM5 comparison Ó. Rögnvaldsson et al. Title Page Abstract Introduction Conclusions References Tables Figures ◭ ◮ ◭ ◮ Back CloseFull Screen / Esc
Printer-friendly Version Interactive Discussion
schemes. The six micro-physics schemes do not differ much in either distribution or quantity of the water vapour mixing ratio. All models reveal wet cores below 700 hPa height on both sides of Mnt. Öræfajökull. Above the mountain, where the air is de-scending, the water vapour mixing ratio is less than in the humid low level cores. The simple three class schemes (i.e. Kessler and WSM3) and the Lin et al. schemes
5
simulate distinctly less cloud water than the other three micro-physics schemes (i.e. WSM5, WSM6 and Thompson). In these schemes, the cloud water is confined to a shallow (below 700 hPa) layer on the upslope side of the mountain. In contrast, the WSM5 and WSM6 schemes further simulate cloud water at mountain height (approx-imately 800 hPa) in the lee of Mnt. Öræfajökull. The simulation done with the
Thomp-10
son scheme produces a humid high level (around 500 hPa) plume on the lee side of the mountain. There are considerable variations in the rain water mixing ratio, both in time and space, in all micro-physics schemes. Most noticeably, the Thompson scheme shows the least rain water in the lee of the mountain during the peak of the downslope wind storm. During the storm maximum no cloud ice was simulated with the five and
15
six class micro-physics schemes. In the simulation of this storm the WSM6 and Lin et al. schemes favoured the formation of graupel to that of snow. This is in contrast to the Thompson scheme which only simulated moderate amounts of graupel between 700 and 850 hPa height, upslope of the mountain. This can clearly be seen in Fig.9
(bottom left).
20
A possible explanation for this difference may be the different distribution function for graupel used in the Thompson scheme as well as differences in riming growth.
Yet another striking difference between the Thompson scheme and the other micro-physics schemes is the relatively low level (i.e. below 600 hPa) dryness in the lee of Mnt. Öræfajökull (cf. Fig. 10) during the hours of maximum downslope wind speed.
25
This is presumably connected to relatively strong ascending motion simulated in the lee of the mountain as found in all micro-physics schemes but the Thompson scheme. Furthermore, the wave activity is much stronger when simulated with the Thompson scheme than all the other micro-physics schemes. Figure11shows a skew-T diagram
ACPD
8, 6437–6468, 2008 Downslope windstorm – WRF/MM5 comparison Ó. Rögnvaldsson et al. Title Page Abstract Introduction Conclusions References Tables Figures ◭ ◮ ◭ ◮ Back CloseFull Screen / Esc
Printer-friendly Version Interactive Discussion
at location B (cf. Fig.3) for the Thompson (left) and the WSM6 (right) simulations. It can be seen that the temperature between 750 and 800 hPa in the Thompson scheme is less than in the WSM6 scheme by about 2.5◦C. The upstream static stability at, and
above, mountain height (i.e. between 750 and 800 hPa) is greater in the Thompson simulation than the WSM6 simulation. The same holds true for all the other five
micro-5
physics simulations. Table3shows the square of the Brunt-Väisälä frequency (N2) at, and above, mountain height at the end of cross-section AB (i.e. point B). The table also shows the stability term of the Scorer parameter, N2/u2, where u represents the mean upslope wind speed perpendicular to cross-section AB at location B. The upslope wind speed along cross-section AB is similar in all simulations, regardless of what
micro-10
physics scheme is used. The near surface wind speed is high (typically 25–30 ms−1)
but decreases with height. At mountain height (i.e. 800 hPa) the wind speed is between 8 and 10 ms−1and is reduced to zero between 650 and 700 hPa.
4 Discussions
The major difference between the MM5 and WRF simulations of this event, is in the
15
wave breaking. In the MM5 simulations, there is greater dissipation in the mountain wave associated with greater TKE production below 600 hPa at all times than there is in WRF/MYJ. In the WRF/MYJ simulation, the dissipation takes mainly place between 950 and 700 hPa. After 03:00 UTC, 16 September, it is confined between the surface and 800 hPa. The difference in the intensity of the simulated downslope winds can be
20
explained by less dissipation associated with turbulence in the WRF/MYJ simulation than in the WRF/2EQ and the MM5 simulations. Since upper air observations are not available to verify the simulated wave breaking, the accuracy of the simulated surface winds and temperature is the only measurable performance of both the MM5 and WRF models for this windstorm event.
25
Another major difference between the MM5 and WRF models is the different charac-teristics revealed when using the two equation PBL model. In the WRF/2EQ simulation
ACPD
8, 6437–6468, 2008 Downslope windstorm – WRF/MM5 comparison Ó. Rögnvaldsson et al. Title Page Abstract Introduction Conclusions References Tables Figures ◭ ◮ ◭ ◮ Back CloseFull Screen / Esc
Printer-friendly Version Interactive Discussion
surface wind speed in the lee of the mountain is greatly reduced compared to the WRF/MYJ simulation. This is in the opposite compared to the MM5 simulation where the two equation model gives rise to greater surface winds that are closer to observed values. The reason for this remains unclear and requires further study.
The difference in simulated precipitation between the WRF/MYJ and WRF/2EQ
sim-5
ulations upstream and at the tip of the mountain (stations KVISK and FAGHO) can to some extent be explained by different wind direction of the impinging flow. In the WRF/MYJ simulation the wind direction is more perpendicular to the coast than in the WRF/2EQ simulation. This leads to greater precipitation maximum near the coast in the WRF/MYJ simulation than in the WRF/2EQ run. Different micro-physics
10
schemes also affect the simulated precipitation. The simulated precipitation in the sim-ple Kessler scheme is similar to the simulated precipitation in the more comsim-plex WSM6, Lin et al. and Thompson schemes (cf. Fig. 7). This is in agreement with results in
Miglietta and Rotunno(2006). In this paper, Miglietta and Rotunna investigated moist, nearly neutral flow over a ridge in an idealistic framework. For a 700 m high narrow
15
ridge (i.e. with halfwidth of 10 km) the Kessler and Lin et al. schemes produced very different rain rates. The Kessler scheme had a lower rain rate and produced precipi-tation only on the upslope side of the ridge whilst the Lin et al. produced precipiprecipi-tation further upstream and had a distinct downslope maxima as well. The reason for this dif-ference lies in a lower threshold used for autovonverting cloud water to rain in the Lin et
20
al. scheme (7×10⁻⁴g kg−1
) to that of the Kessler shceme (1×10⁻³g kg−1). The lower
threshold values results in greater rainfall rate in the Lin et al. scheme and also in the upstream shift of the precipitation as the conversion of cloud water to rain occurs ear-lier. The downslope maxima in the Lin et al. scheme is generated by a downstream ice cloud and is the result of the ice microphysical processes that convert ice cloud to snow
25
and than convert the snow to graupel. However, for the case of a higher (2000 m) ridge, both schemes behave in a similar manner, the maximum precipitation is confined to the upstream side of the ridge with the Kessler scheme producing greater rainfall rate. The reason is that the more intense vertical motions due to a higher mountain results in
ACPD
8, 6437–6468, 2008 Downslope windstorm – WRF/MM5 comparison Ó. Rögnvaldsson et al. Title Page Abstract Introduction Conclusions References Tables Figures ◭ ◮ ◭ ◮ Back CloseFull Screen / Esc
Printer-friendly Version Interactive Discussion
much larger amounts of condensate than with a lower mountain. Consequently, the in-tensity and the location of the upwind precipitation maximum is less dependent on the differing thresholds for autoconversion. The accumulated 15 h precipitation simulated on the upslope hill of Mnt. Öræfajökull is in general of the same order as the maxi-mum 24 h precipitation values that have been observed on lowland in this area. The
5
maximum observed 24 h precipitation was at location KVISK on 9–10 January 2002 (293.3 mm). This is a clear indication that precipitation in the mountains can be much greater than at the foothills.
Simulations done with WRF/MYJ in combination with various cloud micro-physics schemes showed little variations in upslope wind-speed along cross-section AB (cf.
10
Fig.3). As the Froude3number is a function of the characteristic mountain height, the upslope wind-speed and upslope stability, this emphasises the importance of capturing the upslope stability correctly in order to determine whether the flow will be able to cross the obstacle and cause a downslope wind storm. The upstream low-level flow (i.e. below 750 hPa) in the Thompson scheme simulation (cf. Table3) is noticably more
15
stable than that in the other runs. According toSmith(1985) greater upstream stability tends to produce stronger down-slope winds.
The observed sensitivity to cloud micro-physics schemes can be explained by the fact that various schemes produce different upslope distributions of precipitation and hydro-meteors, resulting in variation in the upslope static stability. Since the intensity
20
of downslope wind is directly related to the intensity of the gravity-wave, which in turn is strongly dependent on the upslope static stability, this sensitivity is the manifestation of the great impact of the upslope precipitation on the downslope wind speed. The Thompson scheme proved superior to the other five schemes tested in simulating the downslope windstorm. A possible explanation for this difference may be the different
25
distribution function for graupel used in the Thompson scheme as well as differences in riming growth from the other micro-physics schemes. The greater formation of graupel
3
Traditionally, the Froude number is a measure of the ratio of inertial and buoyant forces, i.e. whether there is a flow-over or a flow-around an obstacle.
ACPD
8, 6437–6468, 2008 Downslope windstorm – WRF/MM5 comparison Ó. Rögnvaldsson et al. Title Page Abstract Introduction Conclusions References Tables Figures ◭ ◮ ◭ ◮ Back CloseFull Screen / Esc
Printer-friendly Version Interactive Discussion
in the Lin et al. and WSM6 schemes compared to that in the Thompson scheme (cf. Fig. 9) leads to more accretion (i.e. riming and/or depositional growth) which in turn leads to release of latent heat as liquid meteors are being turned into solid hydro-meteors. The Thompson scheme in contrast favours the formation of snow to that of graupel. Hence, there is less accretion and greater aggregation that takes place.
5
As a result there is less release of latent heat than in the other two simulations and the region between 750 and 850 hPa becomes colder (cf. Fig. 11) and more stable. Previous sensitivity tests, e.g. by Colle et al. (2005) have shown that orographically influenced precipitation is in fact greatly dependent on snowfall velocity and snow size distribution. Woods et al.(2007) investigated the sensitivity of the Thompson
micro-10
physics scheme to the representation of snow particle types. They demonstrated the defectiveness of the conventional assumption of snow particles as spheres of constant density. A more realistic empirical mass-diameter relationship resulted in an increased number of particles and a shift of the snow size distribution towards larger particles. This in turn led to increased depositional growth of snow and decreased cloud water
15
production.
5 Conclusions
A severe windstorm downstream of Mnt. Öræfajökull in Southeast Iceland is simulated on a grid of 1 km horizontal resolution by using the PSU/NCAR MM5 model and the Advanced Research WRF model. Both models are run with a new, two equation
plane-20
tary boundary layer (PBL) scheme as well as the ETA/MYJ PBL schemes. The storm is also simulated using six different micro-physics schemes in combination with the MYJ PBL scheme in WRF.
Both models capture gravity-wave formation over Mnt. Öræfajökull, while the vertical structure of the lee wave differs between the two models and the PBL schemes. The
25
simulated wave in the WRF model (using both the MYJ and the 2EQ schemes) is not as steep as in the MM5 simulations. The WRF simulated downslope winds, using the
ACPD
8, 6437–6468, 2008 Downslope windstorm – WRF/MM5 comparison Ó. Rögnvaldsson et al. Title Page Abstract Introduction Conclusions References Tables Figures ◭ ◮ ◭ ◮ Back CloseFull Screen / Esc
Printer-friendly Version Interactive Discussion
MYJ PBL scheme, are in good agreement with the strength of the observed downslope windstorm. When simulated using the new two equation scheme, surface winds are not as strong. In contrast, the MM5 simulated surface winds, with the new two equation model, are in better agreement to observations than when using the ETA scheme. The simulated surface temperature in the WRF simulations is closer to the observations
5
than simulated temperature in the MM5 simulations.
Micro-physics processes have been shown to play an important role in the forma-tion of downslope windstorms. The micro-physics schemes tested here give different downslope winds and all schemes, excluding the Thompson scheme, underestimate the downslope windstorm. This is caused by different simulated stability upstream
10
of the mountain. In the Thompson scheme, the lifting of the upslope isotherm layer from mountain height to about 1.3 times the mountain height leads to a significant in-crease in the downslope windstorm. This emphasises the importance of observing micro-physical properties in cases like this in order to improve our understanding of downslope windstorms, precipitation distribution, and the flow pattern in general and
15
our ability to predict them.
Given the lack of upper air observations for this downslope windstorm event and the limitation to a single-case study, our results are not conclusive. However, the results indicate that the advanced numerics in the WRF model make it better suitable than the MM5 model for high resolution simulations/forecasts of downslope windstorms in
20
Iceland.
Acknowledgements. This work is part of the ongoing RÁV-project which is funded in part by the
Icelandic Research Fund (Rannsóknasjóður Ïslands). The weather stations, from which data has been used in this study, belong to the Icelandic Meteorological Office, the Icelandic Road Administration and the Icelandic Maritime Administration. The authors thank S. Michelson for
25
ACPD
8, 6437–6468, 2008 Downslope windstorm – WRF/MM5 comparison Ó. Rögnvaldsson et al. Title Page Abstract Introduction Conclusions References Tables Figures ◭ ◮ ◭ ◮ Back CloseFull Screen / Esc
Printer-friendly Version Interactive Discussion
References
Ágústsson, H. and Ólafsson, H.: Simulating a severe windstorm in complex terrain, Meteorol. Z., 16, 99–110, 2007. 6439
Colle, B. A., Matthew F. Garwert, Justin B. Wolfe, Clifford F. Mass, and Christopher P. Woods: The 13–14 December 2001 IMPROVE–2 Event. Part III: Simulated Microphysical Budgets
5
and Sensitivity Studies, J. Atmos. Sci., 62, 3535–3558, 2005.6451
Cooper, W. A.: Ice initiation in natural clouds. Precipitation Enhancement – A Scientific Chal-lenge, Meteor. Monogr., 43, 29–32, Amer. Meteor. Soc., 1986.6445
Dudhia, J.: Numerical study of convection observed during the winter monsoon experiment using a mesoscale two–dimensional model, J. Atmos. Sci., 46, 3077–3107, 1989.6444
10
Durran, D. R.: Mountain Waves and Downslope Winds, in: Atmospheric Processes Over Com-plex Terrain, edited by Blumen, W., 59–81, American Meteorological Society, Boston, 1990.
6439
Grell, G. A., Dudhia, J., and Stauffer, D. R.: A Description of the Fifth–Generation Penn State/NCAR Mesoscale Model (MM5). NCAR/TN–398+STR, National Center for
Atmo-15
spheric Research, Boulder, CO, 107 pp., 1995.6439
Hong, S. Y. and Lim, J. O. J.: The WRF single–moment 6–class microphysics scheme (WSM6), J. Korean Meteor. Soc., 42, 129–151, 2006. 6444
Hong, S. Y., Huang, H. M. H., and Zhao, Q.: Implementation of prognostic cloud scheme for a regional spectral model, Mon. Weather Rev., 126, 2621–2639, 1989. 6444
20
Hong, S. Y., Dudhia, J., and Chen, S. H.: A revised approach to ice microphysical processes for the bulk parameterization of clouds and precipitation, Mon. Weather Rev., 132, 103–120, 2004. 6444
Janjić, Z. I.: The step–mountain eta coordinate model: Further developements of the convec-tion, viscous sublayer and turbulence closure schemes, Mon. Weather Rev., 122, 927–945,
25
1994. 6439
Janjić, Z. I.: Nonsingular Implementation of the Mellor–Yamada Level 2.5 Scheme in the NCEP Meso model. Office Note #437, National Center for Environmental Prediction, 2001. 6439
Kessler, E.: On the distribution and continuity of water substance in atmospheric circulations, Meteor. Monogr., 32, Amer. Meteor. Soc., 1969. 6444
30
Lin, Y. L., Farley, R. D., and Orville, H. D.: Bulk parameterization of the snow field in a cloud model, J. Appl. Meteorol., 22, 1065–1092, 1983.6444
ACPD
8, 6437–6468, 2008 Downslope windstorm – WRF/MM5 comparison Ó. Rögnvaldsson et al. Title Page Abstract Introduction Conclusions References Tables Figures ◭ ◮ ◭ ◮ Back CloseFull Screen / Esc
Printer-friendly Version Interactive Discussion
Mellor, G. L. and Yamada, T.: Development of a turbulence closure model for geophysical fluid problems, Rev. Geophys. Space GE, 20, 851–875, 1982. 6439
Miglietta, M. M. and Rotunno, R.: Furhter Results on Moist Neutral Flow over a Ridge, J. Atmos. Sci., 56, 2796–2810, 2006.6449
Ólafsson, H. and Ágústsson, H.: The Freysnes downslope windstorm, Meteorol. Z., 16, 123–
5
130, 2007.6439
Reisner, J., Rasmussen, R. M., and Bruintjes, R. T.: Explicit forecastin of supercooled liquid water in winter storms using the MM5 mesoscale model., Q. J. Roy. Meteor. Soc., 124B, 1071–1107, 1998. 6445
Rutledge, S. A. and Hobbs, P. V.: The Mesoscale and Macroscale Structure and Organization
10
of Clouds and Precipitation in Midlatitude Cyclones. XII: A Diagnostic Modeling Study of Precipitation Development in Narrow Cold–Frontal Rainbands, J. Atmos. Sci., 41, 2949– 2972, 1984. 6444
Skamarock, W. C., Klemp, J. B., Dudhia, J., Gill, D. O., Barker, D. M., Wang, W., and Powers, J. G.: A Description of the Advanced Research WRF Version 2. NCAR Technical Note,
15
NCAR/TN–468+(STR), National Center for Atmospheric Research, Boulder, CO, 88 pp., 2005. 6439
Smith, R. B.: On Severe Downslope Winds, J. Atmos. Sci., 42, 2597–2603, 1985. 6439,6450
Tao, W. K., Simpson, J., and McCumber, M.: An ice–water saturation adjustment, Mon. Weather Rev., 117, 231–235, 1989.6444
20
Thompson, G., Rasmussen, R. M., and Manning, K.: Explicit Forecasts of Winter Precipitation Using an Improved Bulk Microphysics Scheme. Part I: Description and Sensitivity Analysis, Mon. Weather Rev., 132, 519–542, 2004. 6444
Walko, R. L., Cotton, W. R., Meyers, M. P., and Harrington, J. Y.: New RAMS cloud microphysics parameterization. Part I: The single–moment scheme, Atmos. Res., 38, 29–62, 1995. 6445
25
Woods, C. P., Mark T. Stoelinga, and John D. Locatelli: The IMPROVE–1 Storm of 1–2 Febru-ary 2001. Part III: Sensitivity of a Mesoscale Model Simulation of the Representation of Snow Particle Types and Testing of a Bulk Microphysical Scheme with Snow Habit Prediction, J. Atmos. Sci., 64, 3927–3948, 2007. 6451
ACPD
8, 6437–6468, 2008 Downslope windstorm – WRF/MM5 comparison Ó. Rögnvaldsson et al. Title Page Abstract Introduction Conclusions References Tables Figures ◭ ◮ ◭ ◮ Back CloseFull Screen / Esc
Printer-friendly Version Interactive Discussion
Table 1. Observed and simulated accumulated precipitation (mm), between 15 September,
18:00 UTC and 16 September, 09:00 UTC, at stations Skaftafell (SKAFT), Fagurhólsm´yri (FAGHO) and Kvísker (KVISK).
Location Observed MM5 WRF ETA 2EQ MYJ 2EQ SKAFT 0.0 0.0 0.0 0.8 1.2 FAGHO 42.4 49.8 47.6 74.8 36.0 KVISK 59 55.5 45.9 95.0 71.2
ACPD
8, 6437–6468, 2008 Downslope windstorm – WRF/MM5 comparison Ó. Rögnvaldsson et al. Title Page Abstract Introduction Conclusions References Tables Figures ◭ ◮ ◭ ◮ Back CloseFull Screen / Esc
Printer-friendly Version Interactive Discussion
Table 2. Observed and simulated accumulated precipitation (mm), between 15 September,
18:00 UTC and 16 September, 09:00 UTC, at stations Skaftafell (SKAFT), Fagurhólsm´yri (FAGHO) and Kvísker (KVISK) using various micro-physics schemes in combination with the MYJ PBL scheme in WRF.
SKAFT FAGHO KVISK Observed 0.0 42.4 59 Kessler 30.4 126.5 149.4 WSM3 9.6 70.0 57.8 WSM5 19.9 63.5 52.9 Lin et al. 13.8 148.0 128.3 WSM6 8.7 110.7 93.2 Thompson 0.8 74.8 95.0
ACPD
8, 6437–6468, 2008 Downslope windstorm – WRF/MM5 comparison Ó. Rögnvaldsson et al. Title Page Abstract Introduction Conclusions References Tables Figures ◭ ◮ ◭ ◮ Back CloseFull Screen / Esc
Printer-friendly Version Interactive Discussion
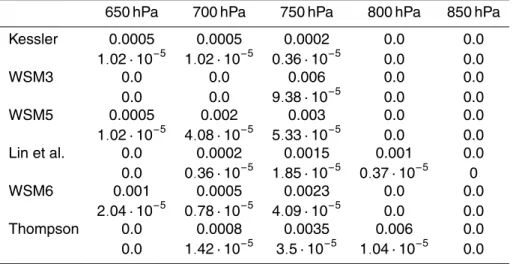
Table 3. The square of the simulated Brunt-Väisälä frequency (N2) (s−2) and N2/u2(m−2) (i.e.
the stability term of the Scorer parameter) at point B on 16 September, 09:00 UTC at various pressure levels for all six micro-physics schemes. Here, N is defined asqgθdθ
dz, where θ is
potential energy, g is the local acceleration of gravity, and z is geometric height.
650 hPa 700 hPa 750 hPa 800 hPa 850 hPa Kessler 0.0005 0.0005 0.0002 0.0 0.0 1.02 · 10−5 1.02 · 10−5 0.36 · 10−5 0.0 0.0 WSM3 0.0 0.0 0.006 0.0 0.0 0.0 0.0 9.38 · 10−5 0.0 0.0 WSM5 0.0005 0.002 0.003 0.0 0.0 1.02 · 10−5 4.08 · 10−5 5.33 · 10−5 0.0 0.0 Lin et al. 0.0 0.0002 0.0015 0.001 0.0 0.0 0.36 · 10−5 1.85 · 10−5 0.37 · 10−5 0 WSM6 0.001 0.0005 0.0023 0.0 0.0 2.04 · 10−5 0.78 · 10−5 4.09 · 10−5 0.0 0.0 Thompson 0.0 0.0008 0.0035 0.006 0.0 0.0 1.42 · 10−5 3.5 · 10−5 1.04 · 10−5 0.0
ACPD
8, 6437–6468, 2008 Downslope windstorm – WRF/MM5 comparison Ó. Rögnvaldsson et al. Title Page Abstract Introduction Conclusions References Tables Figures ◭ ◮ ◭ ◮ Back CloseFull Screen / Esc
Printer-friendly Version Interactive Discussion
Fig. 1. Mean sea level pressure (hPa) (left), geopotential height at 500 hPa (m) (middle) and
temperature at 850 hPa (◦C) (right) on 16 September 2004 at 06:00 UTC. Based on the
ACPD
8, 6437–6468, 2008 Downslope windstorm – WRF/MM5 comparison Ó. Rögnvaldsson et al. Title Page Abstract Introduction Conclusions References Tables Figures ◭ ◮ ◭ ◮ Back CloseFull Screen / Esc
Printer-friendly Version Interactive Discussion Reykjavik
Fig. 2. Domain setup and location of observational sites. The box on the right hand side shows
the region of interest around Mnt. Öræfajökull. The colour scale to the right represents the terrain height.
ACPD
8, 6437–6468, 2008 Downslope windstorm – WRF/MM5 comparison Ó. Rögnvaldsson et al. Title Page Abstract Introduction Conclusions References Tables Figures ◭ ◮ ◭ ◮ Back CloseFull Screen / Esc
Printer-friendly Version Interactive Discussion
Fig. 3. Simulated surface wind speed (ms−1) at lowest half-sigma level (approximately
40 m. a.g.l.) by MM5 (left panels) and WRF (right panels) at 16 September 2004, 06:00 UTC. Top panels show results from the ETA and MYJ boundary layer schemes and the bottom panel shows results using the new two equation PBL model.
ACPD
8, 6437–6468, 2008 Downslope windstorm – WRF/MM5 comparison Ó. Rögnvaldsson et al. Title Page Abstract Introduction Conclusions References Tables Figures ◭ ◮ ◭ ◮ Back CloseFull Screen / Esc
Printer-friendly Version Interactive Discussion
Fig. 4. Observed (solid black) and simulated (solid blue – MM5/ETA, blue dash – MM5/2EQ,
solid red – WRF/MYJ, red dash – WRF/2EQ) 10 m wind speed (ms−1) (left) and 2-m
ACPD
8, 6437–6468, 2008 Downslope windstorm – WRF/MM5 comparison Ó. Rögnvaldsson et al. Title Page Abstract Introduction Conclusions References Tables Figures ◭ ◮ ◭ ◮ Back CloseFull Screen / Esc
Printer-friendly Version Interactive Discussion
Fig. 5. Cross section along line AB (cf. Fig.3) showing potential temperature (K) (red lines), wind along the cross section (ms−1) (blue arrows) and turbulent kinetic energy (Jkg−1) (TKE,
grayscale) for MM5 (left panels) and WRF (right panels) at 16 September 2004, 06:00 UTC. Top panels show results from the ETA and MYJ boundary layer schemes and the bottom panel shows results using the new two equation PBL model.
ACPD
8, 6437–6468, 2008 Downslope windstorm – WRF/MM5 comparison Ó. Rögnvaldsson et al. Title Page Abstract Introduction Conclusions References Tables Figures ◭ ◮ ◭ ◮ Back CloseFull Screen / Esc
Printer-friendly Version Interactive Discussion
Fig. 6. Observed (solid black) and simulated (dashed) 10 m wind speed (ms−1)(left) and 2-m
temperature (◦C) (right) at station Skaftafell (WMO# 4172 – SKAFT) in the lee of Mnt.
Öræfa-jökull. Various colours represent various micro-physic parameterisations within the WRF model: Light green – Kessler, dark green – Lin et al., light blue – WSM3, dark blue – WSM5, purple – WSM6 and red – Thompson scheme.
ACPD
8, 6437–6468, 2008 Downslope windstorm – WRF/MM5 comparison Ó. Rögnvaldsson et al. Title Page Abstract Introduction Conclusions References Tables Figures ◭ ◮ ◭ ◮ Back CloseFull Screen / Esc
Printer-friendly Version Interactive Discussion
Fig. 7. Accumulated precipitation (mm), between 18:00 UTC 15 September and 09:00 UTC 16
September 2004. Micro-physics schemes are, from top left to bottom right: Kessler, WSM3, WSM5, Lin et al., WSM6 and Thompson.
ACPD
8, 6437–6468, 2008 Downslope windstorm – WRF/MM5 comparison Ó. Rögnvaldsson et al. Title Page Abstract Introduction Conclusions References Tables Figures ◭ ◮ ◭ ◮ Back CloseFull Screen / Esc
Printer-friendly Version Interactive Discussion
Fig. 8. Cross section along line AB (cf. Fig.3), showing potential temperature (K) (red lines), wind along cross section (ms−1) (blue arrows) and cloud water mixing ratio (gkg−1) (grayscale)
ACPD
8, 6437–6468, 2008 Downslope windstorm – WRF/MM5 comparison Ó. Rögnvaldsson et al. Title Page Abstract Introduction Conclusions References Tables Figures ◭ ◮ ◭ ◮ Back CloseFull Screen / Esc
Printer-friendly Version Interactive Discussion
Fig. 9. Cross section along line AB (cf. Fig.3) showing potential temperature (K) (red lines), wind along cross section (ms−1) (blue arrows), graupel mixing ratio (gkg−1) (grayscale, left
columns) and snow mixing ratio (gkg−1) (grayscale, right column) at 09:00 UTC 16 September
ACPD
8, 6437–6468, 2008 Downslope windstorm – WRF/MM5 comparison Ó. Rögnvaldsson et al. Title Page Abstract Introduction Conclusions References Tables Figures ◭ ◮ ◭ ◮ Back CloseFull Screen / Esc
Printer-friendly Version Interactive Discussion
Fig. 10. Cross section along line AB (cf. Fig.3) showing potential temperature (K) (red lines), wind along cross section (ms−1) (blue arrows), and total precipitation mixing ratio (gkg−1)
(grayscale) at 09:00 UTC 16 September 2004. Micro-physics schemes are, from top left to bottom right: Kessler, WSM3, WSM5, Lin et al., WSM6 and Thompson.
ACPD
8, 6437–6468, 2008 Downslope windstorm – WRF/MM5 comparison Ó. Rögnvaldsson et al. Title Page Abstract Introduction Conclusions References Tables Figures ◭ ◮ ◭ ◮ Back CloseFull Screen / Esc
Printer-friendly Version Interactive Discussion T=2.5°C ∆ 600 hPa 700 hPa 800 hPa 900 hPa −10°C 0°C +10°C
Fig. 11. Skew-T diagram at location B (cf. Fig.3) at 06:00 UTC 16 September 2004, Thompson micro-physics scheme (blue and red lines) and the WSM6 scheme (black lines). The zoomed-in figure to the right shows that the maximum temperature difference (2.5◦C) between the two