HAL Id: hal-01380206
https://hal.sorbonne-universite.fr/hal-01380206
Submitted on 12 Oct 2016
HAL is a multi-disciplinary open access
archive for the deposit and dissemination of
sci-entific research documents, whether they are
pub-lished or not. The documents may come from
teaching and research institutions in France or
abroad, or from public or private research centers.
L’archive ouverte pluridisciplinaire HAL, est
destinée au dépôt et à la diffusion de documents
scientifiques de niveau recherche, publiés ou non,
émanant des établissements d’enseignement et de
recherche français ou étrangers, des laboratoires
publics ou privés.
Distributed under a Creative Commons Attribution| 4.0 International License
Membrane lipidomics in schizophrenia patients: a
correlational study with clinical and cognitive
manifestations
C Tessier, K Sweers, A Frajerman, H Bergaoui, F Ferreri, C Delva, N Lapidus,
A Lamaziere, P Roiser, M de Hert, et al.
To cite this version:
C Tessier, K Sweers, A Frajerman, H Bergaoui, F Ferreri, et al.. Membrane lipidomics in schizophrenia
patients: a correlational study with clinical and cognitive manifestations. Translational Psychiatry,
Nature Pub. Group, 2016, 6 (10), pp.e906. �10.1038/tp.2016.142�. �hal-01380206�
ORIGINAL ARTICLE
Membrane lipidomics in schizophrenia patients: a
correlational study with clinical and cognitive manifestations
C Tessier1,2, K Sweers3, A Frajerman2, H Bergaoui2, F Ferreri2, C Delva4, N Lapidus5,6, A Lamaziere1,7, JP Roiser8, M De Hert3and P Nuss1,2,7
Schizophrenia is a severe mental condition in which several lipid abnormalities—either structural or metabolic—have been described. We tested the hypothesis that an abnormality in membrane lipid composition may contribute to aberrant dopamine signaling, and thereby symptoms and cognitive impairment, in schizophrenia (SCZ) patients. Antipsychotic-medicated and clinically stable SCZ outpatients (n = 74) were compared with matched healthy subjects (HC, n = 40). A lipidomic analysis was performed in red blood cell (RBC) membranes examining the major phospholipid (PL) classes and their associated fatty acids (FAs). Clinical manifestations were examined using the positive and negative syndrome scale (PANSS). Cognitive function was assessed using the Continuous Performance Test, Salience Attribution Test and Wisconsin Card Sorting Test. Sphingomyelin (SM) percentage was the lipid abnormality most robustly associated with a schizophrenia diagnosis. Two groups of patients were defined. The first group (SCZ c/SM− ) is characterized by a low SM membrane content. In this group, all other PL classes, plasmalogen and key
polyunsaturated FAs known to be involved in brain function, were significantly modified, identifying a very specific membrane lipid cluster. The second patient group (SCZ c/SM+) was similar to HCs in terms of RBC membrane SM composition. Compared with SCZ c/SM+, SCZ c/SM− patients were characterized by significantly more severe PANSS total, positive, disorganized/cognitive and excited psychopathology. Cognitive performance was also significantly poorer in this subgroup. These data show that a specific RBC membrane lipid cluster is associated with clinical and cognitive manifestations of dopamine dysfunction in schizophrenia patients. We speculate that this membrane lipid abnormality influences presynaptic dopamine signaling.
Translational Psychiatry (2016)6, e906; doi:10.1038/tp.2016.142; published online 4 October 2016
INTRODUCTION
Schizophrenia is a chronic multifactorial disorder characterized by a number of symptom dimensions, cognitive abnormalities and functional impairment. These features are highly variable among individuals with schizophrenia, resulting in great heterogeneity in clinical presentation. Several explanatory models have been proposed to conceptualize the combination of these various characteristics. To date, none have accounted for the overall diversity of the observed manifestations, and most of the proposed models allow only a partial understanding of the disorder. The lipid hypothesis of schizophrenia of Horrobin1was conceived in this framework, proposing to reconcile apparently heterogeneous schizophrenia features and also suggesting a biological basis for disease vulnerability.
Today, advances in lipidomics such as high-performance liquid chromatography, electrospray ionization and mass spectrometry have contributed to a more in-depth understanding of lipid physiology and allowed further developments of the original phospholipid (PL) hypothesis of schizophrenia. Lipids are now understood as versatile and dynamic regulators of numerous cellular processes that encompass, among others, signaling, budding and fusion of vesicles.2 Lipids are also known to move rapidly in the plane as well as across the bilayer in a dynamic and
highly organized manner, particularly in red blood cell (RBC),3to control various cellular activities.4In this context, the lipid pattern abnormality in membranes is conceived as a trait or vulnerability marker associated with the disorder.
The new field of neurolipidomics seeks to understand how dynamic changes in membrane composition regulate brain cell function. The lipid composition of brain membranes is brain-region specific,5but is also governed by mechanisms that control the membrane composition in cells throughout the body. Brain signaling may thus be assessed indirectly via the study of the lipid composition of membrane in peripheral cells such as RBCs.6–8 Membrane abnormalities in schizophrenia patients were demon-strated via measurement of the membrane PL ratio,9,10turnover11
and inner/outer distribution,12 as well as quantification and identification of the polyunsaturated fatty acids (PUFAs) from PL.13
Here, we undertook a lipidomic study of the RBC membrane of chronic medicated schizophrenia patients to identify abnormal membrane lipid clusters associated with the disorder, and also to distinguish patient subgroups. On the basis of studies in lipid-deprived animals showing that abnormal lipid metabolism is associated with disrupted dopamine dysfunction,14we sought to examine whether specific membrane lipid clusters are associated
1
INSERM ERL 1157, CHU Saint-Antoine, Paris, France;2Service de psychiatrie et de psychologie médicale, Hôpital Saint-Antoine, AP-HP, UPMC Université Paris 06, Paris, France;
3
UPC KU Leuven, Kortenberg, Belgium;4
SYLIA-STAT, Bourg-la-Reine, France;5Institut Pierre Louis d’épidémiologie et de Santé Publique, UMRS 1136, INSERM, Sorbonne
Universités, UPMC Université Paris 06, Paris, France;6
Public Health Department, Saint-Antoine Hospital, AP-HP, Paris, France;7
UMR 7203, Laboratoire des biomolécules, Sorbonne
Universités-UPMC Université Paris 06, Paris, France and8
UCL Institute of Cognitive Neuroscience, London, UK. Correspondence: Dr P Nuss, UMR 7203, Laboratoire des biomolécules, Sorbonne Universités-UPMC Université Paris 06, CHU Antoine 27, rue de Chaligny. Service de psychiatrie et de psychologie médicale, 184 rue du Fg Saint-Antoine, 75012 Paris, France.
E-mail: nuss.philippe@gmail.com
Received 21 January 2016; revised 10 June 2016; accepted 14 June 2016
with dopamine-related symptomatology and cognition in patients with schizophrenia.
MATERIALS AND METHODS Study population
The study included 74 antipsychotic-medicated and clinically stable outpatients with schizophrenia (SCZ, DSM-IV-TR criteria) and not meeting criteria for another treated DSM-IV axis III disorder. The healthy control (HC) group was composed of 40 subjects matched for age and education level, recruited among hospital staff and students with no personal and family history of psychosis and/or bipolar disorder. In both the groups, exclusion criteria included cholesterol-lowering treatments and dietary supplemen-tation with PUFAs. The metabolic syndrome was not an exclusion criterion, except when it required a pharmacological treatment following a clinician’s opinion. Cholesterol-lowering medication was an exclusion criterion because membrane and circulating cholesterol can exchange to some points and cannot be considered independent compartments in terms of cholesterol content. Food intake was assessed in patients through a dietary questionnaire.15 The patients and controls provided written informed consent in a protocol approved by the Medical Ethics Committee of the University Psychiatric Centre (EC/UC/(2011-16), Katholieke Universi-teit Leuven, campus Kortenberg (Belgium)). The demographic and clinical characteristics of the study samples are summarized in Table 1. Antipsychotic medication consisted of either typical (haloperidol, chlor-promazine,flupentixol) or atypical compounds (amisulpride, aripiprazole, clozapine, olanzapine, quetiapine, sertindole and risperidone).
Clinical and cognitive measures
Patients’ psychopathology, general functioning and cognition were assessed by a trained nurse. The Positive and Negative Syndrome Scale (PANSS),16Global Assessment of Functioning and Clinical Global Impres-sion scales have been completed. The cognitive tasks were administrated using a computerized platform. Three tests have been used: AX Continuous Performance Test (CPT-AX), Salience Attribution Test (SAT) and Wisconsin Card Sorting Test (WCST).
The CPT-AX is a measure of sustained attention and working memory, consisting of a series of trials on which a single letter is presented briefly in the middle of the screen. This version of the test also included different colored (that is, visually salient) stimuli on 20% of the trials, adding a perceptual salience component to the test.17The task was programmed in PXLAB.18
The SAT is a test of reward learning and motivational responding, on which participants must respond to a target stimulus immediately preceded by a cue, which signals the probability of gaining a reward,
the magnitude of which is higher for quicker responses.19The task was
programmed in Cogent, a stimulus presentation toolbox for Matlab. The WCST is a test evaluating mentalflexibility and working memory,20
on which participants must sort cards according to different rules, which must be learned from feedback and change periodically. We used the WCST Research Edition Version 2 (http://www.parinc.com).
Biological measures
The lipid composition of the RBC membrane was studied to identify and measure all major lipid classes: phosphatidylcholine (PC), phosphatidylser-ine (PS), sphingomyelin (SM), phosphatidylethanolamphosphatidylser-ine (PE), PE plasmalo-gen and their molecular species. The number of the major molecular species studied was 45, 18, 23 and 42 for PC, PS, SM and PE, respectively. PE was further studied as a function of its location in the outer and inner membrane leaflet. Both diacyl phosphatidylethanolamine (DPE) and monoacyl phosphatidylethanolamine (LPE), which together comprise PE, were measured on each of the membrane leaflet.
The detailed presentation of the blood sample preparation and data acquisition of phospholipids with liquid chromatography-tandem mass spectromerty (LC-MS/MS) for complete lipid data analysis is provided in the Supplementary Methods (Lipid measures). In brief, total lipids were extracted from the RBC cell membranes based on the methods of Folch et al.21 Outer leaflet and total membrane PE labeling was made using trinitro-benzylsulfonic acid (Sigma-Aldrich, Saint-Quentin Fallavier, France). Separation of PL classes were obtained using high-performance liquid chromatography (HPLC) solvent gradient program and spectrometry identification parameters (Supplementary Tables S-A to D, Supplementary Methods). The application of HPLC solvent gradient and mass spectrometer scan functions were controlled by the Analyst Software (AB Sciex, Les Ulis, France) data system. The samples were analyzed using an electrospray ionization tandem mass spectrometry (ESI/MS/MS, API3000, TQ, Applied Biosystems-Sciex, Concord, ON, Canada) either with scan mode or multiple-reaction monitoring. A comprehensive description of the methodology can be found in Brugger et al.22 Multiple-reaction monitoring was used to
measure the distribution of DPE and LPE between the two RBC membrane leaflets. The complete lipid data were acquired using Analyst 4.2.2 software. To identify and quantify spectral peaks, LIMSA software was used.23
Statistical data analysis
The data were analyzed using SAS 9.3. The groups were compared using t-tests for continuous variables or a non-parametric Mann–Whitney Wilcoxon test when parametric assumptions were violated (normality tested with the Kolmogorov–Smirnov test). Categorical data were analyzed using chi-square tests. Correlations with RBC PLs were investigated using Table 1. Demographic and clinical data
Characteristics SCZ HC Chi-squareQ MWWZ P-value
Mean s.d. Mean s.d.
N 74 40
Gender: male (% of total population) 48 (64.8%) 24 (60%) 0.747 (1 d.o.f.) 0.387
Age (years) 43.8 9.3 42.6 13.2 0.462 0.644
Education level (in % of total) 3.329 (3 d.o.f.) 0.344
Lower High School 3 (4.1%) 1 (2.5%)
High School 39 (53.4%) 15 (37.5%)
College 17 (23.3%) 12 (30.0%)
University 14 (19.2%) 12 (30.0%)
Age of onset (year) 24.6 6.2 —
Duration of illness (years) 22.3 6.4 —
Number of hospitalizations 7.8 5.5 —
Chlorpromazine equivalent (mg) 480.2 383.4 —
CGI (mean) 3.03 0.74 —
GAF (mean) 66.7 8.5 —
PANSS (mean total score) 48.5 16.3 —
Abbreviations: CGI, Clinical Global Impression; d.o.f., degree of freedom; GAF, Global Assessment of Functioning; HC, healthy control; MWW, Mann–Whitney Wilcoxon test; PANSS, Positive and Negative Syndrome Scale; SCZ, schizophrenia. Comparisons were performed with chi-square tests for categorical data and Mann–Whitney Wilcoxon tests for quantitative data.
Clinical and cognitive measures in schizophrenia: a lipidomic study C Tessier et al
2
Spearman’s correlation tests. A step-wise logistic multivariate analysis including PS, SM, PC, PE, external DPE, external LPE and PE plasmalogen was performed to determine which lipid variables were most reliably associated with schizophrenia diagnosis. All the tests were two-sided with a statistical significance level set at P = 0.05. For cognitive and clinical data one-way and two-way analyses of variance with SM group and diagnosis group as fixed factors and the SM × diagnosis interaction term were estimated. Box-Cox power transformation of continuous variables was used to limit departures from normality assumptions. Results are given with the Fk statistic including the number of degrees of freedom, k.
Multimodality of the SM distribution was tested to assess whether the distribution was a mixture of normal laws, using a clustering analysis with bayesian information criterion for information criterion.24
RESULTS
As shown in Table 1, the SCZ and HC groups did not differ in terms of age, sex and education level.
Membrane lipid composition differs in patients and healthy controls As shown in Table 2a, a univariate analysis of the RBC lipids identified significantly lower SM percentage in the SCZ group compared with the HC group (27.38 vs 30.59%), along with a concomitant higher PS percentage (8.73 vs 6.64%).
Decreased membrane sphingomyelin percentage allowed distinguish four study populations
In a multiple logistic regression analysis using membrane PL values to predict schizophrenia diagnosis, only SM was selected (odds-ratio estimate of 0.833 with 95% Wald Confidence
Limits (0.744–0.933), P = 0.0003), confirming its strong association with diagnosis. The SM percentage appeared to follow a ‘bimodal’ distribution, that is a mixture of two normal laws with means 23.2 and 22.5% and same variance 5.4. A threshold value of SM percentage was then determined to classify individuals according to mean SM percentage value: (1) those in the range of HCs; and (2) those below this value. A receiver operating characteristic curve identified an SM cutoff of 28.58 (mean %) to maximize the Youden index. Only 22.5% of the HCs exhibited an‘abnormal’ SM percentage while this was identified in 55.4% of the schizophrenia patients (chi-square Q = 10.12, P = 0.0015).
Two clusters of membrane lipid constitutions can be described, identifying two population groups. The group named ‘cluster/ SM− ’ (c/SM − ) is constituted of individuals whose RBC membrane comprises a SM mean percentage below 28.58. By contrast, the c/ SM+ group has a mean SM percentage above 28.58 (in the range of the majority of HCs). Four populations can thus be distin-guished among the study participants: SCZ c/SM− (n = 41), SCZ c/ SM+ (n = 33), HC c/SM− (n = 9) and HC c/SM+ (n = 31). These four groups are represented on Figure 1.
For biophysical and biological reasons, an isolated decrease of a membrane PL is not possible without complex and compensatory changes in the ratio of the other membrane containing lipids. Thus, SM status cannot be conceived of in isolation, but considered as a marker of a broader membrane lipid dysfunction. Compared with their c/SM+ counterparts, each of the c/SM− patient and HC subgroups exhibit a different cluster of compen-satory lipids (Table 2b).
Table 2. Phospholipid data from schizophrenia patients and healthy controls
a Total population SCZ (n = 74) HC (n = 40) MWWZ P-value
Phospholipid Mean (%) s.d. Mean (%) s.d.
PE 22.40 7.15 19.81 8.38 1.59 0.112 PC 41.49 6.03 42.96 6.06 1.12 0.263 SM 27.38 4.51 30.59 3.76 3.35 0.001 PS 8.73 3.31 6.64 2.12 3.33 0.001 b SCZ (n= 74) P-value HC (n= 40) P-value Subgroups c/SM− (n = 41) c/SM+ (n = 33) c/SM− (n = 9) c/SM+ (n = 31)
Phospholipid Mean (%) s.d. Mean (%) s.d. Mean (%) s.d. Mean (%) s.d.
PE 27.12 4.23 16.53 5.48 o0.0001 28.61 8.86 31.51 5.74 0.2570
PC 38.64 5.07 45.04 5.24 o0.0001 36.27 3.63 44.90 5.18 0.0003
SM 23.92 2.69 31.66 1.76 o0.0001 23.92 2.69 31.66 1.76 o0.0001
PS 10.31 3.44 6.77 1.72 o0.0001 7.42 2.40 6.42 2.01 0.2065
Plasmalogen PE 5.34 0.76 6.53 0.17 o0.0001 5.76 0.72 6.89 1.30 0.0121
Outer/Inner leaflet PE
Outer PE (DPE+LPE) 6.62 2.17 6.57 2.28 0.9653 6.12 1.81 6.88 3.04 0.7955 DPE 4.94 1.36 4.18 1.32 0.0120 4.25 1.31 4.16 1.67 0.4761 LPE 1.68 1.47 2.39 1.20 0.0007 1.87 0.81 2.73 1.51 0.1450 Inner PE (DPE+LPE) 26.40 5.11 27.84 5.20 0.1919 24.30 5.74 26.38 6.82 0.4563 DPE 22.16 5.17 19.18 4.24 0.0322 19.57 5.35 20.43 5.67 0.9226 LPE 4.24 2.55 8.66 4.18 o0.0001 4.72 1.64 5.95 2.16 0.1363
Abbreviations: DPE, diacyl phosphatidylethanolamine; LPE, monoacyl phosphatidylethanolamine; PC phosphatidylcholine; PE, phosphatidylethanolamine; PS, phosphatidylserine; SM, sphingomyelin. The section (a) shows the mean ratio for the major phospholipid (PL) classes from RBC membranes in schizophrenia patients (SCZ) and healthy controls (HC). Section (b) indicates the PL mean percentage in schizophrenia and healthy controls for each SM subgroup. P-values are derived from the non-parametric Mann–Whitney Wilcoxon (MWW Z) test. Significant findings are in bold.
Membrane lipid composition and distribution differs between c/SM+ and c/SM− patient populations
As mentioned above, in the c/SM− patient subgroup, significant concomitant decreases in PC and PE plasmalogen, along with significant increases in PS and PE percentages, were observed (Table 2b). These results indicate a very different RBC membrane lipid composition in the c/SM− and c/SM+ patients. The PE percentages were further characterized as a function of the location of PE in the membrane leaflet (inner- vs outer-located PE). Compared with the c/SM+ subgroup, c/SM− patients also differed
in DPE/LPE distribution. The c/SM− subgroup exhibited a significant increase in DPE (both external and internal) and a decrease in LPE (both external and internal; Table 2b).
In addition, key PUFAs known to be modified in membranes in schizophrenia patients were compared between the c/SM− and c/SM+ patients. The molecular species comprising either one or two of the following PUFAs: linoleic acid (C18:2 n-6), arachidonic acid (C20:4 n-6), docosapentaenoic acid (C22:5, n-3) and docosahexaenoic acid (C22:6 n-3) were examined. A significant difference in these molecular species percentage was observed between the two patient subgroups (Supplementary Table S1, Supplementary Results). This difference was most pronounced for the PE molecular species. The PUFA molecular species profile for LPE and DPE also differed significantly in terms of their outer/inner membrane leaflet distribution.
Importantly, the c/SM+ and c/SM− SCZ subgroups did not differ in age, gender, education level, age of onset, type or disease duration (Table 4), or amount of antipsychotic medication (calculated using the chlorpromazine equivalence measure from Danivas et al.25).
The membrane lipid cluster is not identical in c/SM− patients and controls
The compensatory lipid changes associated with the low SM subgroups are population-specific with the c/SM − patients deprived in PE and enriched in PS relative to the c/SM− HCs. Further, the molecular species also differed among the c/SM− SCZ/ HC subgroups in terms of total membrane content and asymme-trical distribution (Supplementary Table S2, Supplementary Results). Cognitive measurements
As shown in Table 3, compared with the number of subjects for which lipid and clinical data were available, the number of
SM- (n=41) 40.00 35.00 30.00 25.00 20.00 15.00 SM+ (n=33) SM- (n=9) SM+ (n=31) SCZ HC
SM (in % of total membrane PLs)
Figure 1. Distribution of the schizophrenia (SCZ) and healthy control (HC) samples as a function of their mean SM percentage content in the RBC membrane. PL, phospholipid; RBC, red blood cell; SM, sphingomyelin.
Table 3. Cognitive data from schizophrenia and healthy control SM subgroups
SCZ F1 P-value HC F1 P-value
c/SM− c/SM+ c/SM− c/SM+
Mean s.d. Mean s.d. Mean s.d. Mean s.d.
CPT-AX (n = 36) (n = 28) (n = 7) (n = 29)
Hit rate 85.71 23.41 78.57 28.24 0.729 0.396 98.98 2.7 95.32 7.7 1.115 0.299
Reaction time mean 498.58 101.4 584.41 167.54 4.943 0.030 444.3 62.5 469.45 79.78 1.138 0.294
False alarm 9.08 12.86 6.73 13.85 4.59 0.036 5.49 3.06 5.36 8.63 0.653 0.425
SAT1 (n = 26) (n = 21) (n = 7) (n = 26)
Response time mean 350.8 88.3 349.43 94.89 0.01 0.922 313.61 29.5 299.23 58.45 1.32 0.259
Imp Adap Sal 8.83 42.63 1.83 58.55 0.224 0.638 28.58 20.12 13.11 32.82 1.393 0.247
Imp Aber Sal 31.17 22.56 22.06 21.19 2.787 0.102 29.71 20.82 22.31 17.86 1.573 0.455
Exp Adap Sal 1.25 28.86 28.33 31.79 10.02 0.003 46.07 28.68 35.1 29.03 0.798 0.379
Exp Aber Sal 6.83 7.47 7.86 14.02 1.758 0.192 8.21 7.03 6.63 8.48 0.487 0.490
Money 853.77 329.93 792.05 364.02 0.466 0.498 1004.7 287.22 909.19 313.7 0.546 0.466 WCST (n = 22) (n = 12) (n = 5) (n = 19) Trials 106.45 23.09 89.58 21.25 4.242 0.048 72.8 6.98 86.68 17.11 4.644 0.042 Correct responses 64.05 16.02 69.42 9.14 0.685 0.414 65.2 3.96 70.11 6.53 2.358 0.139 Errors 42.41 31.28 20.17 19.05 5.636 0.024 7.6 3.29 16.58 11.12 8.648 0.007 Pers responses 23.95 21.7 12.08 16.02 6.781 0.014 4.4 1.67 9.21 7.82 3.604 0.071 Pers errors 21 17.55 11.08 13.71 6.524 0.016 4.4 1.67 8.47 6.83 3.588 0.071
Non pers errors 21.41 18.39 9.08 6.08 4.86 0.035 3.2 2.17 8.11 5.32 11.28 0.003
Abbreviations: CPT-AX, Continuous Performance Task AX; Exp aber sal, explicit aberrant salience; Exp adap sal, explicit adaptive salience; HC, healthy control; Imp aber sal, implicit aberrant salience; Imp adap sal, implicit adaptive salience; Non pers errors, non-perseverative errors; Pers errors, perseverative errors; Pers responses, perseverative response; SAT, salience attribution test; SCZ, schizophrenia; SM, sphingomyelin; WCST, Wisconsin Card Sorting Test. P-values are derived from one-way analysis of variance model on power-transformed data. Significant findings are in bold.
Clinical and cognitive measures in schizophrenia: a lipidomic study C Tessier et al
4
individuals able to perform the cognitive tasks was lower and variable as a function of the specific test, thus reducing the statistical power of these comparisons. Despite this, highly significant results are observed for some cognitive tasks as a function of SM status.
CPT-AX test
The mean scores for hit rate and reaction time differed significantly between the SCZ and HC groups (Supplementary Table S3, Supplementary Results). As shown in Table 3, among the SCZ patients, the c/SM− subjects had shorter mean reaction times and higher false alarm scores relative to the c/SM+ subjects. However, the interactions between SM status and diagnostic group were nonsignificant for both of these variables.
SAT (first block data only)
The scores for mean response time and explicit adaptive salience differed significantly between the SCZ and HC groups (Supplementary Table S3, Supplementary Results). Among the SCZ patients, the c/SM− subjects had lower explicit adaptive salience scores relative to the c/SM+ subjects (Table 3), and the interaction between SM status and diagnostic group was significant.
Notably, only half (n = 12/26) of the c/SM− SCZ patients that completed thefirst SAT block were able to continue to the second block, whereas all of the c/SM+ subgroup (n = 21) completed both blocks, indicating a poorer capacity to be involved in extended cognitive testing for the c/SM− patient subgroup.
WCST test
The mean scores for trials, errors, perseverative responses, perseverative errors and non-perseverative errors were signi fi-cantly higher (worse) in SCZ compared with HC (Supplementary Table S3, Supplementary Results).
Among the SCZ patients, the c/SM− subjects had poorer performance with significantly more trials, errors, perseverative responses, perseverative errors and non-perseverative errors (Table 3). Interestingly, SM status was also associated with trials, errors and non-perseverative errors in the HC group, but in the opposite direction, with more errors in the c/SM+ group. There were significant interactions between SM status and diagnostic group for all these variables.
Summary
On all the three cognitive tests, the SCZ patients performed worse overall than the HCs, but this difference was largely driven by the c/SM− subgroup of patients. However, among the HCs, SM status was not associated with impaired cognitive performance. Supplementary Table S4 (Supplementary Results) shows that most of the cognitive scores were worse in the c/SM− patients compared with the c/SM− HC, whereas the c/SM+ HC and SCZ subgroups scored similarly on many of the variables (data presented in Table 3, analyses not shown).
Clinical measures
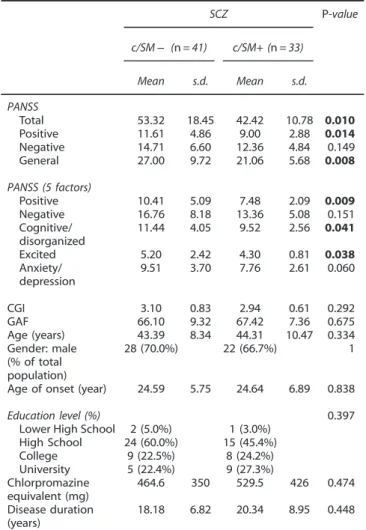
The PANSS scale scores were compared between the c/SM− and c/SM+ patients (Table 4). PANSS total, positive and general psychopathology scores were significantly higher in the c/SM − compared with the c/SM+ subgroup. The c/SM− patients scored also significantly higher on the positive, disorganized/cognitive and excited subscales of thefive dimensional segmentation of the PANSS, with a trend on the anxiety/depression subscale.26 No differences were observed between the c/SM subgroups for the PANSS negative subscale. Of interest, there were twice as many severe patients (assessed by a PANSS total cutoff of 45) in the c/SM− group compared with the c/SM+ group.
The more severe WCST impairment in the c/SM− sample is unlikely to be explained by higher PANSS scores: after adjusting for the PANSS total score (Supplementary Table S5, Supplementary Results), SM status remained associated with trials, errors, perseverative responses, perseverative errors and non-perseverative errors.
DISCUSSION
Consistent with the existing literature, the present study demon-strated that the RBC membrane PL composition differs between stabilized medicated schizophrenia individuals and matched HCs. Two membrane lipid clusters that aggregate with either low (c/ SM− ) or normal (c/SM+) membrane SM content allowed the identification of two groups of patients distinguishable by the ratio of all membrane PLs, inner/outer PE distribution and fatty-acid composition. Compared with the c/SM+ patients, the c/SM− SCZ subjects are characterized by significantly more severe psychopathology and impaired cognitive performance.
Table 4. Psychopathology scores in both schizophrenia SM subgroups SCZ P-value c/SM− (n = 41) c/SM+ (n = 33) Mean s.d. Mean s.d. PANSS Total 53.32 18.45 42.42 10.78 0.010 Positive 11.61 4.86 9.00 2.88 0.014 Negative 14.71 6.60 12.36 4.84 0.149 General 27.00 9.72 21.06 5.68 0.008 PANSS (5 factors) Positive 10.41 5.09 7.48 2.09 0.009 Negative 16.76 8.18 13.36 5.08 0.151 Cognitive/ disorganized 11.44 4.05 9.52 2.56 0.041 Excited 5.20 2.42 4.30 0.81 0.038 Anxiety/ depression 9.51 3.70 7.76 2.61 0.060 CGI 3.10 0.83 2.94 0.61 0.292 GAF 66.10 9.32 67.42 7.36 0.675 Age (years) 43.39 8.34 44.31 10.47 0.334 Gender: male (% of total population) 28 (70.0%) 22 (66.7%) 1
Age of onset (year) 24.59 5.75 24.64 6.89 0.838
Education level (%) 0.397
Lower High School 2 (5.0%) 1 (3.0%)
High School 24 (60.0%) 15 (45.4%) College 9 (22.5%) 8 (24.2%) University 5 (22.4%) 9 (27.3%) Chlorpromazine equivalent (mg) 464.6 350 529.5 426 0.474 Disease duration (years) 18.18 6.82 20.34 8.95 0.448
Abbreviations: CGI, Clinical Global Impression; GAF, Global Assessment of Functioning; PANSS, Positive and Negative Syndrome Scale; SCZ, schizo-phrenia; SM, sphingomyelin. P-values are derived from one-way analysis of variance model the non-parametric Mann–Whitney Wilcoxon (MWW Z) test. Significant findings are in bold.
Lipid data
As far as we know, our study isfirst in identifying the four most important PL classes using LC-MS/MS. In addition, while in other studies, the total fatty-acid content was measured irrespective of their PL origin, here the PL molecular species could be identified in an individualized basis for each of them. The pattern of membrane PL alteration in schizophrenia noted in previous studies is comparable with the data presented here. Significantly lower quantities of PE and PC,27 as well as SM28 were found in post-mortem brain tissues from patients with schizophrenia. In the present study, an overall increase of PE was observed. However, our results showing a significant decrease in RBC membrane mean SM percentage are in agreement with another post-mortem study showing a decreased SM and increased PS.28 In particular, the decreased SM percentage observed in the c/SM− patients is consistent with data showing a myelin sheath alteration in schizophrenia as evidenced by imaging and post-mortem studies.29,30
Like many other lipids, SM participates in signaling via its transmutation into bioactive molecules or indirectly by biophysical changes in the synapse. At the plasma membrane level, the concentration of SM can be regulated by multiple enzymes. In particular, a sphingomyelinase/sphingomyelin synthase system is involved that controls the membrane levels of both SM and ceramide. These lipids can also be metabolized to other bioactive sphingolipids.31 SM is a key PL involved in membrane
micro-domain formation via its aggregation with cholesterol allowing membrane lipid partition.32 These SM-enriched domains, called rafts, are involved in the compartmentalization of cellular processes and also serve as platforms for many cellular signaling activities33in which budding and fusion of vesicles are involved.34 The total membrane FA content in schizophrenia patients has also been investigated previously. In particular, Bentsen et al.35 were able to demonstrate a very highly significant bimodal distribution of PUFA among patients, mirroring the present results but on total membrane PUFAs. In line with most prior results,13 our study identified significant differences in PUFA content in the molecular species of PC, PS and PE known to be key for PUFA content.36 Compared with the c/SM+ subgroup, the c/SM− patients significantly differed in the content of PUFA molecular species. The specific inner/outer distribution and FA composition of DPE and LPE observed for each of the SM groups is in accordance with the assumption that the membrane homeostasis of these two populations differs not only in composition but also distribution. This also confirms our previous finding showing an abnormal inner/outer distribution of PE in a subgroup of schizophrenia patients.12
A dysfunctional plasmalogen dynamic in the plasma and platelets of schizophrenia patients has been described for the PE plasmalogens37 and was interpreted as an indirect marker of
increased oxidative stress in these patients.38 In line with these results, we identified a significant decrease in PE plasmalogen in the c/SM− subgroup, which was also characterized by more severe clinical and cognitive features. In this subgroup, the plasmalogen decrease was associated with a PE increase. This modification is in agreement with a plasmalogen-deprived animal model, in which a compensatory increase in PE was described, which presumably occurs to maintain the total membrane amount of PE/PE plasmalogens.39
Several human studies in schizophrenia and animal models40 have emphasized the role of antipsychotic medication in relation to the membrane PL abnormalities observed in schizophrenia patients. A correcting effect of antipsychotic compounds on the membrane lipid composition has been described41 involving several mechanisms.42,43In the present study, all patients were
chronically treated by antipsychotics with no differences in between SM subgroups in terms of typical/atypical ratio and
medication daily dosage. The difference of membrane lipid composition observed between the SM subgroups is thus unlikely to be related to the type or dose of the prescribed antipsychotic treatment.
Membrane lipid composition, psychopathology and cognitive performance
PANSS scores. Total, positive, disorganized/cognitive as well as excited PANSS scores were significantly higher in the c/SM − compared with the c/SM+ patients. Such an effect of PL composition in the RBC membrane has been previously examined in few studies taking into account the PL12and PUFA44content in the RBC membrane of patients. Low concentrations of arachidonic acid and docosahexaenoic acid have been described in patients with predominantly negative symptoms.45,46 In our study, no
differences in the negative subscale scores were observed between the SM subgroups.
WCST test. In the present study, the membrane lipid content has been examined in relation to cognitive performance and compared with data from ultra-high risk individuals,47 as well as
treated and stabilized patients.48The observedfindings in the c/ SM− patient subgroup, potentially indicate a more severe impairment of prefrontal cortex function relative to the c/SM+ patient subgroup. Interestingly, a reverse pattern was observed in HCs, with SM− status being associated with better performance relative to c/SM+ (Table 3). Animal studies of chronic deficiency in n-3 PUFA support the hypothesis that cognitive impairment associated with PL/FA membrane changes is caused by a more active mesolimbic dopamine pathway and a less active mesocor-tical pathway.49,50In line with thisfinding, we found that the c/
SM− patients, who exhibited a more pronounced PUFA dysfunc-tion, manifested both more positive symptoms and WCST deficits relative to the c/SM+ patients.
SAT test
The dopamine dysregulation described in patients with schizo-phrenia is thought to be reflected in aberrant reward processing.51 In the present study, SAT scores differed between the SM patient subgroups, with the c/SM− patients having lower explicit adaptive salience. Consistent with our results, a study aiming to examine the extent to which some psychotic symptoms reflect aberrant salience, Roiser et al.19demonstrated that patients with
first episode psychosis exhibited reduced explicit adaptive salience relative to controls, which has been replicated independently.52 The results presented here suggest that PL abnormalities may contribute to this disrupted reward learning. However, implicit aberrant salience scores were not different between the SM patient subgroups in the present study. CPT-AX test
Intact prefrontal processing is needed to perform the CPT-AX test.53,54In the present study, surprisingly, the c/SM− patients had
shorter reaction times compared with the c/SM+ patients. One interpretation is that in the c/SM− patients, a more potent effect of the salient stimuli enabled them to perform the task better compared with the c/SM+ subgroup. Another explanation is that the c/SM− group responded faster because they were less concerned about making errors, in other words adopting a more impulsive response style (a speed-accuracy trade-off). This latter interpretation is supported by a concomitant increase in the number of false alarms committed compared with the c/SM+ patients, also indicative of poorer prefrontal function. That said, it should be noted that the diagnostic group-by-SM status interac-tions were nonsignificant for these variables, which lessens support for these interpretations
Clinical and cognitive measures in schizophrenia: a lipidomic study C Tessier et al
6
More pronounced dopamine dysfunction in c/SM− schizophrenia individuals?
The differences between patients and HCs on all the three cognitive tests were largely driven by the c/SM− subgroup. In addition, c/SM− status was associated with more severe PANSS total and positive scores. We speculate that these results have some connection with dopamine dysfunction in c/SM− relative to c/SM+ patients. Indeed more severe positive symptoms,55 disorganization56and cognitive impairment57,58have been shown to be associated with dopamine dysregulation. Our data also consistent with animal models of chronic dietary n-3 PUFA deficiency59
suggest that the c/SM− patients exhibit more severe dopamine dysfunction in both the striatum and the prefrontal cortex compared with the c/SM+ individuals.
CONCLUSION
We found evidence that a specific RBC membrane lipid cluster was associated with differences in dopamine-related clinical and cognitive manifestations in schizophrenia patients. No other studied clinical or treatment variables could account for these differences. We hypothesize that the difference in clinical and cognitive manifestations between the two SM patient groups can, in part, be explained by differences in presynaptic dopamine release as converging evidence indicates such dysfunction in schizophrenia.60–62
Nonetheless, this study does have some limitations. In particular, fewer patients underwent the cognitive tests compared with the number of those included in the membrane lipid study, and the cognitive tests we used are only indirectly related to dopamine dysfunction. A direct measure of dopamine release would provide more convincing evidence that membrane lipid content affects dopamine bioavailability in schizophrenia patients. In addition, ourfinding cannot be generalized to acute and/or low functioning patients. Furthermore, general conditions that parti-cipate in the lipid bioavailability such as gut malabsorption, in particular inflammatory bowel status, biliary acid turnover, and non-celiac and celiac gluten sensitivity have not been addressed in the present study.
Structural lipid biomarkers are a rapidly evolving field, in particular for neuropsychiatric disorders where even subtle perturbations in the lipid content of neurons and myelin can disrupt their function. Considerable further investigation is needed, including the validation of thesefindings in other patient populations with brain imaging to appraise dopamine dysfunc-tion. Further questions such as the therapeutic effect of a membrane lipid content-adjusted PUFA supplementation or the identification of genetic and morphologic differences between various membrane lipid endophenotypes also represent exciting areas for further research.
CONFLICT OF INTEREST
The authors declare no conflict of interest.
REFERENCES
1 Horrobin DF, Glen AI, Vaddadi K. The membrane hypothesis of schizophrenia.
Schizophr Res 1994;13: 195–207.
2 Holthuis JC, Levine TP. Lipid traffic: floppy drives and a superhighway. Nat Rev Mol
Cell Biol 2005;6: 209–220.
3 Devaux PF, Morris R. Transmembrane asymmetry and lateral domains in
biolo-gical membranes. Traffic 2004; 5: 241–246.
4 van Meer G, Voelker DR, Feigenson GW. Membrane lipids: where they are and
how they behave. Nat Rev Mol Cell Biol 2008;9: 112–124.
5 Soderberg M, Edlund C, Kristensson K, Dallner G. Lipid compositions of different
regions of the human brain during aging. J Neurochem 1990;54: 415–423.
6 Yao J, Stanley JA, Reddy RD, Keshavan MS, Pettegrew JW. Correlations between peripheral polyunsaturated fatty acid content and in vivo membrane
phospholi-pid metabolites. Biol Psychiatry 2002;52: 823–830.
7 Peters BD, Machielsen MW, Hoen WP, Caan MW, Malhotra AK, Szeszko PR et al. Polyunsaturated fatty acid concentration predicts myelin integrity in early-phase
psychosis. Schizophr Bull 2013;39: 830–838.
8 Richardson AJ, Allen SJ, Hajnal JV, Cox IJ, Easton T, Puri BK. Associations between central and peripheral measures of phospholipid breakdown revealed by cerebral 31-phosphorus magnetic resonance spectroscopy and fatty acid composition of
erythrocyte membranes. Prog Neuropsychopharmacol Biol Psychiatry 2001;25:
1513–1521.
9 Ponizovsky AM, Modai I, Nechamkin Y, Barshtein G, Ritsner MS, Yedgar S et al. Phospholipid patterns of erythrocytes in schizophrenia: relationships to
sympto-matology. Schizophr Res 2001;52: 121–126.
10 Schmitt A, Maras A, Petroianu G, Braus DF, Scheuer L, Gattaz WF. Effects of antipsychotic treatment on membrane phospholipid metabolism in
schizo-phrenia. J Neural Transm (Vienna) 2001;108: 1081–1091.
11 Jensen JE, Miller J, Williamson PC, Neufeld RW, Menon RS, Malla A et al. Grey and
white matter differences in brain energy metabolism infirst episode
schizo-phrenia: 31 P-MRS chemical shift imaging at 4 Tesla. Psychiatry Res 2006;146:
127–135.
12 Nuss P, Tessier C, Ferreri F, De Hert M, Peuskens J, Trugnan G et al. Abnormal transbilayer distribution of phospholipids in red blood cell membranes in
schi-zophrenia. Psychiatry Res 2009;169: 91–96.
13 Hoen WP, Lijmer JG, Duran M, Wanders RJ, van Beveren NJ, de Haan L. Red blood cell polyunsaturated fatty acids measured in red blood cells and schizophrenia: a
meta-analysis. Psychiatry Res 2013;207: 1–12.
14 Ohara K. The n-3 polyunsaturated fatty acid/dopamine hypothesis of
schizo-phrenia. Prog Neuropsychopharmacol Biol Psychiatry 2007;31: 469–474.
15 Garner DM. EDI-2. Eating Disorder Inventory-2. Psychological Assessment Resour-ces: Odessa, FL, USA, 1991.
16 Kay SR, Fiszbein A, Opler LA. The positive and negative syndrome scale (PANSS)
for schizophrenia. Schizophr Bull 1987;13: 261–276.
17 Lee J, Park S. The role of stimulus salience in CPT-AX performance of
schizo-phrenia patients. Schizophr Res 2006;81: 191–197.
18 Irtel H. PXLab: The Psychological Experiments Laboratory. University of
Man-nheim: Mannheim, Germany, 2007. Available fromohttp://www.pxlab.de4.
19 Roiser JP, Stephan KE, den Ouden HE, Barnes TR, Friston KJ, Joyce EM. Do patients
with schizophrenia exhibit aberrant salience? Psychol Med 2009;39: 199–209.
20 Nelson HE. A modified card sorting test sensitive to frontal lobe defects. Cortex
1976;12: 313–324.
21 Folch J, Lees M, Sloane Stanley GH. A simple method for the isolation and pur-ification of total lipides from animal tissues. J Biol Chem 1957; 226: 497–509. 22 Brugger B. Lipidomics: analysis of the lipid composition of cells and subcellular
organelles by electrospray ionization mass spectrometry. Annu Rev Biochem 2014; 83: 79–98.
23 Haimi P, Uphoff A, Hermansson M, Somerharju P. Software tools for analysis of
mass spectrometric lipidome data. Anal Chem 2006;78: 8324–8331.
24 Fraley C, Raftery AE. Bayesian regularization for normal mixture estimation and
model-based clustering. J Classif 2007;24: 155–181.
25 Danivas V, Venkatasubramanian G. Current perspectives on chlorpromazine
equivalents: comparing apples and oranges!. Indian J Psychiatry 2013; 55:
207–208.
26 Emsley R, Rabinowitz J, Torreman M, GroupR-I-EPGW. The factor structure for the Positive and Negative Syndrome Scale (PANSS) in recent-onset psychosis.
Schi-zophr Res 2003;61: 47–57.
27 Yao JK, Leonard S, Reddy RD. Membrane phospholipid abnormalities in
post-mortem brains from schizophrenic patients. Schizophr Res 2000;42: 7–17.
28 Schmitt A, Wilczek K, Blennow K, Maras A, Jatzko A, Petroianu G et al. Altered thalamic membrane phospholipids in schizophrenia: a postmortem study. Biol
Psychiatry 2004;56: 41–45.
29 Davis KL, Stewart DG, Friedman JI, Buchsbaum M, Harvey PD, Hof PR et al. White matter changes in schizophrenia: evidence for myelin-related dysfunction. Arch
Gen Psychiatry 2003;60: 443–456.
30 Flynn SW, Lang DJ, Mackay AL, Goghari V, Vavasour IM, Whittall KP et al. Abnormalities of myelination in schizophrenia detected in vivo with MRI, and
post-mortem with analysis of oligodendrocyte proteins. Mol Psychiatry 2003;8:
811–820.
31 Milhas D, Clarke CJ, Hannun YA. Sphingomyelin metabolism at the plasma
membrane: implications for bioactive sphingolipids. FEBS Lett 2010; 584:
1887–1894.
32 Lingwood D, Simons K. Lipid rafts as a membrane-organizing principle. Science
2010;327: 46–50.
33 Jacobson K, Mouritsen OG, Anderson RG. Lipid rafts: at a crossroad between cell
biology and physics. Nat Cell Biol 2007;9: 7–14.
34 Georgieva R, Mircheva K, Vitkova V, Balashev K, Ivanova T, Tessier C et al. Phos-pholipase A2-induced remodeling processes on liquid-ordered/liquid-disordered membranes containing docosahexaenoic or oleic acid: a comparison study.
Langmuir 2016;32: 1756–1770.
35 Bentsen H, Solberg DK, Refsum H, Gran JM, Bohmer T, Torjesen PA et al. Bimodal distribution of polyunsaturated fatty acids in schizophrenia suggests two
endo-phenotypes of the disorder. Biol Psychiatry 2011;70: 97–105.
36 Bazinet RP, Laye S. Polyunsaturated fatty acids and their metabolites in brain
function and disease. Nat Rev Neurosci 2014;15: 771–785.
37 Wood PL, Unfried G, Whitehead W, Phillipps A, Wood JA. Dysfunctional plasma-logen dynamics in the plasma and platelets of patients with schizophrenia.
Schizophr Res 2014;161: 506–510.
38 Kaddurah-Daouk R, McEvoy J, Baillie R, Zhu H, KY J, Nimgaonkar VL et al. Impaired
plasmalogens in patients with schizophrenia. Psychiatry Res 2012;198: 347–352.
39 Dorninger F, Brodde A, Braverman NE, Moser AB, Just WW, Forss-Petter S et al. Homeostasis of phospholipids - The level of phosphatidylethanolamine tightly adapts to changes in ethanolamine plasmalogens. Biochim Biophys Acta 2014; 1851: 117–128.
40 Thomas EA, George RC, Danielson PE, Nelson PA, Warren AJ, Lo D et al. Anti-psychotic drug treatment alters expression of mRNAs encoding lipid
metabolism-related proteins. Mol Psychiatry 2003;8: 983–993, 950.
41 McEvoy J, Baillie RA, Zhu H, Buckley P, Keshavan MS, Nasrallah HA et al. Lipidomics reveals early metabolic changes in subjects with schizophrenia: effects of atypical
antipsychotics. PLoS One 2013;8: e68717.
42 Fukuzako H, Fukuzako T, Kodama S, Hashiguchi T, Takigawa M, Fujimoto T. Haloperidol improves membrane phospholipid abnormalities in temporal lobes of
schizophrenic patients. Neuropsychopharmacology 1999;21: 542–549.
43 Alves I, Staneva G, Tessier C, Salgado GF, Nuss P. The interaction of antipsychotic drugs with lipids and subsequent lipid reorganization investigated using
bio-physical methods. Biochim Biophys Acta 2011;1808: 2009–2018.
44 Solberg DK, Bentsen H, Refsum H, Andreassen OA. Association between serum lipids and membrane fatty acids and clinical characteristics in patients with
schizophrenia. Acta Psychiatr Scand 2015;132: 293–300.
45 Glen AI, Glen EM, Horrobin DF, Vaddadi KS, Spellman M, Morse-Fisher N et al. A red cell membrane abnormality in a subgroup of schizophrenic patients: evidence
for two diseases. Schizophr Res 1994;12: 53–61.
46 Sethom MM, Fares S, Bouaziz N, Melki W, Jemaa R, Feki M et al. Polyunsaturated
fatty acids deficits are associated with psychotic state and negative symptoms in
patients with schizophrenia. Prostaglandins Leukot Essent Fatty Acids 2010;83:
131–136.
47 Kim SW, Schafer MR, Klier CM, Berk M, Rice S, Allott K et al. Relationship between membrane fatty acids and cognitive symptoms and information processing in
individuals at ultra-high risk for psychosis. Schizophr Res 2014;158: 39–44.
48 Reddy R, Fleet-Michaliszyn S, Condray R, Yao JK, Keshavan MS, Reddy R. Reduction in perseverative errors with adjunctive ethyl-eicosapentaenoic acid in patients with schizophrenia: preliminary study. Prostaglandins Leukot Essent Fatty Acids
2011;84: 79–83.
49 Zimmer L, Vancassel S, Cantagrel S, Breton P, Delamanche S, Guilloteau D et al. The dopamine mesocorticolimbic pathway is affected by deficiency in n-3
poly-unsaturated fatty acids. Am J Clin Nutr 2002;75: 662–667.
50 Chalon S. Omega-3 fatty acids and monoamine neurotransmission. Prostaglandins
Leukot Essent Fatty Acids 2006;75: 259–269.
51 Berridge KC. The debate over dopamine's role in reward: the case for incentive
salience. Psychopharmacology (Berl) 2007;191: 391–431.
52 Smieskova R, Roiser JP, Chaddock CA, Schmidt A, Harrisberger F, Bendfeldt K et al. Modulation of motivational salience processing during the early stages of
psy-chosis. Schizophr Res 2015;166: 17–23.
53 MacDonald AW 3rd, Carter CS. Event-related FMRI study of context processing in dorsolateral prefrontal cortex of patients with schizophrenia. J Abnorm Psychol
2003;112: 689–697.
54 Servan-Schreiber D, Cohen JD, Steingard S. Schizophrenic deficits in the
proces-sing of context. A test of a theoretical model. Arch Gen Psychiatry 1996;53:
1105–1112.
55 Laruelle M, Abi-Dargham A, van Dyck CH, Gil R, D'Souza CD, Erdos J et al. Single photon emission computerized tomography imaging of amphetamine-induced dopamine release in drug-free schizophrenic subjects. Proc Natl Acad Sci USA
1996;93: 9235–9240.
56 Krystal JH, Perry EB Jr., Gueorguieva R, Belger A, Madonick SH, Abi-Dargham A et al. Comparative and interactive human psychopharmacologic effects of ketamine and amphetamine: implications for glutamatergic and
dopa-minergic model psychoses and cognitive function. Arch Gen Psychiatry 2005;62:
985–994.
57 Howes OD, Kapur S. The dopamine hypothesis of schizophrenia: version III—the final common pathway. Schizophr Bull 2009; 35: 549–562.
58 Howes OD, Murray RM. Schizophrenia: an integrated
sociodevelopmental-cognitive model. Lancet 2014;383: 1677–1687.
59 Zimmer L, Delpal S, Guilloteau D, Aioun J, Durand G, Chalon S. Chronic n-3 polyunsaturated fatty acid deficiency alters dopamine vesicle density in the rat
frontal cortex. Neurosci Lett 2000;284: 25–28.
60 Kumakura Y, Cumming P, Vernaleken I, Buchholz HG, Siessmeier T, Heinz A et al.
Elevated [18 F]fluorodopamine turnover in brain of patients with schizophrenia:
an [18 F]fluorodopa/positron emission tomography study. J Neurosci 2007; 27: 8080–8087.
61 Howes OD, Kambeitz J, Kim E, Stahl D, Slifstein M, Abi-Dargham A et al. The nature of dopamine dysfunction in schizophrenia and what this means for treatment.
Arch Gen Psychiatry 2012;69: 776–786.
62 Lyon GJ, Abi-Dargham A, Moore H, Lieberman JA, Javitch JA, Sulzer D. Presynaptic
regulation of dopamine transmission in schizophrenia. Schizophr Bull 2011;37:
108–117.
63 van der Kemp WJ, Klomp DW, Kahn RS, Luijten PR, Hulshoff Pol HE. A meta-analysis of the polyunsaturated fatty acid composition of erythrocyte membranes
in schizophrenia. Schizophr Res 2012;141: 153–161.
64 McNamara RK, Jandacek R, Rider T, Tso P, Hahn CG, Richtand NM et al. Abnormalities in the fatty acid composition of the postmortem orbitofrontal cortex of schizophrenic patients: gender differences and partial normalization
with antipsychotic medications. Schizophr Res 2007;91: 37–50.
This work is licensed under a Creative Commons Attribution 4.0 International License. The images or other third party material in this
article are included in the article’s Creative Commons license, unless indicated
otherwise in the credit line; if the material is not included under the Creative Commons license, users will need to obtain permission from the license holder to reproduce the material. To view a copy of this license, visit http://creativecommons.org/licenses/ by/4.0/
© The Author(s) 2016
Supplementary Information accompanies the paper on the Translational Psychiatry website (http://www.nature.com/tp)
Clinical and cognitive measures in schizophrenia: a lipidomic study C Tessier et al
8