DOI 10.1007/s00410-014-1091-6 ORIGINAL PAPER
Settling and compaction of chromite cumulates employing a
centrifuging piston cylinder and application to layered mafic
intrusions
Shahrzad Manoochehri · Max W. Schmidt
Received: 23 January 2014 / Accepted: 13 November 2014 / Published online: 25 November 2014 © Springer-Verlag Berlin Heidelberg 2014
pressure integrated over time (Δρ · h · a · t) is best fit with a logarithmic function, in fact confirming that a (pressure) dissolution–reprecipitation process is the dominant mecha-nism of compaction. The experimentally derived equation allows calculating compaction times: 70–80 % chromite at the bottom of a 1-m-thick chromite layer are reached after 9–250 years, whereas equivalent compaction times are 0.2– 0.9 years for olivine (both for 2 mm grain size). The experi-ments allow to determine the bulk viscosities of chromite and olivine cumulates to be of magnitude 109 Pa s, much lower than previously reported. As long as melt escape from the compacting cumulate remains homogeneous, fluidization does not play any role; however, channelized melt flow may lead to suspension and upward movement of cumulate crystals. In LMIs, chromitite layers are typi-cally part of a sequence with layers of mafic minerals, com-paction occurs under the additional weight of the overlying layers and can be achieved in a few years to decades.
Keywords Chromitite layers · Layered mafic intrusions ·
Crystal settling · Compaction · Centrifuge
Introduction
Signatures of crystallization, differentiation and dynamic processes in magma chambers are best preserved in layered mafic intrusions (LMIs). Together with layering, extensive crystal concentrations in form of cumulates are the distin-guishing features of these large intrusions. Cumulates are traditionally considered as a mixture of accumulated grains and interstitial melt that crystallizes in pore spaces (e.g., Wager and Brown 1968; Wager et al. 1960). Orthocumu-lates, with 50–75 % interstitial liquid (e.g., Campbell 1978; Irvine 1982; Naslund and McBirney 1996; Philpotts et al.
Abstract The time scales and mechanics of
gravitation-ally driven crystal settling and compaction is investigated through high temperature (1,280–1,500 °C) centrifuge-assisted experiments on a chromite-basalt melt system at 100–1,500g (0.5 GPa). Subsequently, the feasibility of this process for the formation of dense chromite cumulate lay-ers in large layered mafic intrusions (LMIs) is assessed. Centrifugation leads to a single cumulate layer formed at the gravitational bottom of the capsule. The experimentally observed mechanical settling velocity of a suspension of ~24 vol% chromite is calculated to be about half (~0.53) of the Stokes settling velocity, with a sedimentation exponent
n of 2.35 (3). Gravitational settling leads to an orthocu-mulate layer with a porosity of 0.52 (all porosities as frac-tion). Formation times for such a layer from a magma with initial chromite contents of 0.1–1 vol% are 140–3.5 days, equal to a growth rate of 0.007–0.3 m/day for grain sizes of 1–2 mm. More compacted chromite layers form with increasing centrifugation time and acceleration through chemical compaction: An increase of grain contact areas and grain sizes together with a decrease in porosity is best explained by pressure dissolution at grain contacts, repre-cipitation and grain growth into the intergranular space and a concomitant expulsion of intergranular melt. The rela-tion between the porosity in the cumulate pile and effective
Communicated by T. L. Grove.
Electronic supplementary material The online version of this
article (doi:10.1007/s00410-014-1091-6) contains supplementary material, which is available to authorized users.
S. Manoochehri (*) · M. W. Schmidt
Institute of Geochemistry and Petrology, ETH Zurich, 8092 Zurich, Switzerland
1996; Tegner et al. 2009), are considered as the result of initial accumulation of crystals (crystal mush) and rela-tively rapid crystallization of the interstitial melt (e.g., Hunter 1996b; Wager and Brown 1968; Wager et al. 1960). Different processes such as gravity settling (Wager et al.
1960), in situ crystallization at the boundary layers (Jack-son 1967; McBirney and Noyes 1979) or dynamic mag-matic processes (e.g., density currents) (e.g., Irvine 1987; McBirney and Nicolas 1997) might be responsible for the early accumulation of crystals. However, pure orthocumu-lates are rare in nature because the initial crystal mushes evolve due to secondary or postcumulus processes (e.g., Campbell 1996; Hunter 1996b; McBirney et al. 2009; Sparks et al. 1985) toward mesocumulates (7–25 % inter-stitial melt) or adcumulates (0–7 % interinter-stitial melt) (Irvine
1982; Wager et al. 1960). Compaction is considered as one of the most effective postcumulus processes leading to the expulsion of interstitial melt out of the cumulate frame-work (e.g., Boorman et al. 2004; Boudreau and Philpotts
2002; Mathez et al. 1997; McBirney 1995; McKenzie
1984, 2011; Meurer and Boudreau 1998; Namur and Char-lier 2012; Philpotts et al. 1996; Shirley 1987; Sparks et al.
1985; Tegner et al. 2009). This process may initiate with a purely mechanical reorganization of crystals (slippage, rotation or bending) and continues with viscous deforma-tion or creep of grains in the solid state which results in pressure dissolution/reprecipitation at the grain contacts and boundaries (i.e., viscous or chemical compaction) (e.g., Fowler and Yang 1999; Hunter 1996b).
Among different cumulates in large Layered Mafic Intrusions, stratiform chromitites are of special interest. These are typically 0.05–1 m thick layers composed of 75– 90 % modal chromite which can be traced for distances of tens to hundreds of kilometers in large intrusions. A classic example of such layers is the UG2 chromitite in the Bush-veld Complex, South Africa (e.g., Mathez and Mey 2005; Mondal and Mathez 2007). Several mechanisms have been proposed for the formation of the UG2 chromitite, a summary can be found in Mondal and Mathez (2007) and Naldrett et al. (2012). Among proposed mechanisms lead-ing to the formation of such massive layers is a model that starts with an initial stage of accumulation of suspended chromite grains in the parent magma (e.g., Eales 2000; Mondal and Mathez 2007) followed by further postcumu-lus modifications such as crystal growth and compaction (Hatton and von Gruenewaldt 1987; Higgins 2010; Hulbert and Von Gruenewaldt 1985; Waters and Boudreau 1996).
Despite many years of study, cumulate forming pro-cesses in nature are still poorly understood and remain one of the main challenges in petrology (Maier et al. 2013 and references therein). This is mainly because large magma chambers have a long cooling history and traces of ini-tial processes might be modified or even covered by the
development of secondary processes (Higgins 2010; e.g., Mathez et al. 1997; Sparks et al. 1985). Furthermore, many proposed cumulate forming mechanisms are not mutually exclusive and can act in concert or in sequence toward the formation of meso- to adcumulates (e.g., Lesher and Walker
1988; Meurer and Boudreau 1998). Accordingly, conduct-ing experiments to investigate the feasibility of individual processes or their combination leads to a better understand-ing of cumulate formation (e.g., Lesher and Walker 1988; Schmidt et al. 2012; Walker et al. 1985, 1988).
In this study, the time scales and mechanics of gravitation-ally driven crystal settling and compaction and the feasibil-ity of these processes for the formation of chromitite layers is investigated. This goal is achieved through experimen-tally centrifuging chromite from a crystal-melt suspension. Schmidt et al. (2012) have evaluated these processes for oli-vine. However, compaction strongly depends on the minerals involved and different parameters apply when confronting different rock types (Bachrach 2011). Comparison between the chromite and olivine cumulate formation parameters allows to evaluate the formation times of a cumulate pile, composed of a sequence of different mineralogical layers.
Experimental and analytical techniques
Starting material
A natural chromite ore from the Rustenburg area, Bushveld Complex (Table 1) was crushed and slightly milled. Chro-mite has been separated from the accompanying minerals by suspension in heavy liquids (methyl iodine, ρ = 3.32 g/ cm3) followed by separation with a Frantz isodynamic magnetic separator using an extraction range of 25 Å. A chromite separate purity of ~80 % was achieved and hand picking allowed to remove the remaining 20 % impurities (mostly orthopyroxene and plagioclase).
Chromites were then divided into batches of different grain size by repeatedly dry milling in an agate mortar and wet sieving under ethanol. The average grain size of the dispersed chromite grains were measured by laser diffrac-tometry (“Mastersizer 2000” instrument, Malvern Instru-ments Ltd.). One batch was prepared with a mean grain size of 6.2 (3.5) μm (1σ). For defining the effect of grain size on the compaction process, three other batches with mean grain sizes of 5, 28 and 39 μm were separated.
A synthetic glass was prepared to be used as melt in the experiments. The composition of this glass was based on the experimental results of Cawthorn and Davies (1983) (sample no. 4) on the parental magma to the layered series of the Bushveld Complex. This composition is very similar to the B-1 magma suggested by, e.g., Sharpe (1981), Sharpe and Hulbert (1985) and Barnes et al. (2010) as the parental
magma to the Lower and Lower Critical Zone of the Bush-veld Complex. With some modifications in the amount of Fe and Cr (Table 1), the mixture was prepared from high purity oxides and carbonates which were ground and mixed in an agate mortar under ethanol. This was then melted in a Pt crucible at 1,400 °C under a controlled oxygen fugac-ity of log (fO2) = −7.25 which leads to a Fe3+/Fe2+ ratio
corresponding to QFM. This process was repeated several times (disposing of the glass resulting from the first runs) in order to equilibrate the Pt crucible with the Cr and Fe con-tent of the mixture. The final glass was crushed, milled and fused two more times to obtain maximum homogeneity. The homogeneity and final composition of the glass was determined by electron microprobe analysis (EPMA). The powdered glass was then mixed with chromite at a ratio of 60:40 vol% for compaction experiments and 80:20 vol% for crystal settling experiments.
Experimental techniques
To obtain texturally equilibrated grains and a homogenous initial crystal distribution each experimental charge was first statically equilibrated in a standard end-loaded, solid-media piston cylinder apparatus with a 14 mm bore. Start-ing materials were packed into graphite capsules with an outer diameter of 4.0 mm and an inner diameter and sample length of 2.5 mm. The bottom of the capsules was made extra thick (2.5 mm) for mechanical stability. The graph-ite capsules without outer welded noble metal capsule have proven to work properly in this study, neither melt was lost nor could any evidence of chemical reaction with the
surroundings be observed (Fig. 1). Not using an outer Pt capsule led to a better preservation of the inner geometry and an absence of fractures in the graphite capsule. The usage of graphite capsules limits the oxygen fugacity of the experiments to relatively reduced conditions at or below the equivalent of the graphite–C–O buffer in the experiments (Taylor and Green 1988; Ulmer and Luth 1991). Experi-ments at ≥1,500 °C with graphite capsule resulted in the formation of iron melt droplets together with CO2 bubbles in the experimental charges (Fig. 2a). This is interpreted to result from the crossover of the graphite–CO2 and the iron metal–FeOmelt buffers in the experiments at high tem-perature. The reference buffers CCO (graphite–CO–CO2) and IW (iron–wüstite) only approach at high temperatures and low pressures but do not cross, nevertheless, relatively moderate changes in the activities of CO2 in the bubbles and of Fe in the metal and FeO in the melt allow for such a crossover. To overcome the problem of metal droplets and gas bubbles that effect the settling process, unwelded irid-ium capsules have been used for experiments at 1,500 °C (Fig. 2b). In this carbon-free setup, neither melt nor gas bubbles, nor substantial Fe-loss to the capsule have been observed (Fig. 2c). This demonstrates that the bubble form-ing fluid-phase and the metal droplets result from redox reaction between carbon and iron. Iridium capsules had an outer diameter of 3.0 mm, inner diameter of 2.0 mm and sample length of 4.83 mm.
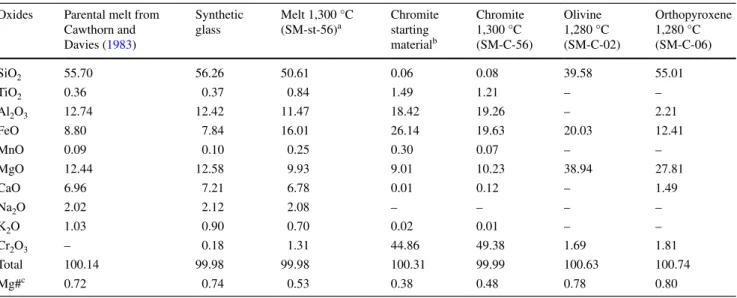
The graphite capsule and mullite thermocouple ceramics were fitted into MgO cylinders serving as pressure medium. Talk–Pyrex sleeves and a 36 mm long straight graph-ite furnace with 6.0 mm inner diameter were used in all Table 1 Starting material and equilibrium phase compositions at 0.5 GPa (in wt%)
a Melt and chromite compositions at different temperatures are given in Table S1 (Supplementary Data) b Chromitite sample from Rustenburg area, Bushveld complex, exact location unknown
c Mg#: 100 Mg/(Mg + Fe2+) Oxides Parental melt from
Cawthorn and Davies (1983) Synthetic glass Melt 1,300 °C (SM-st-56)a Chromite starting materialb Chromite 1,300 °C (SM-C-56) Olivine 1,280 °C (SM-C-02) Orthopyroxene 1,280 °C (SM-C-06) SiO2 55.70 56.26 50.61 0.06 0.08 39.58 55.01 TiO2 0.36 0.37 0.84 1.49 1.21 – – Al2O3 12.74 12.42 11.47 18.42 19.26 – 2.21 FeO 8.80 7.84 16.01 26.14 19.63 20.03 12.41 MnO 0.09 0.10 0.25 0.30 0.07 – – MgO 12.44 12.58 9.93 9.01 10.23 38.94 27.81 CaO 6.96 7.21 6.78 0.01 0.12 – 1.49 Na2O 2.02 2.12 2.08 – – – – K2O 1.03 0.90 0.70 0.02 0.01 – – Cr2O3 – 0.18 1.31 44.86 49.38 1.69 1.81 Total 100.14 99.98 99.98 100.31 99.99 100.63 100.74 Mg#c 0.72 0.74 0.53 0.38 0.48 0.78 0.80
assemblies. In high temperature experiments (≥1,500 °C), Pyrex was replaced by silica glass and mullite by alumina ceramics. Temperature was measured and controlled (with a nominal accuracy of ±1 °C) using a B-type Pt–Rh ther-mocouple. A 0.63-mm-thick corundum disc separated the thermocouple from the capsule. Pressure calibration was
done against fayalite + quartz = orthoferrosilite (Bohlen et al. 1980) and the quartz–coesite transition (Bose and Ganguly 1995). To the nominal pressure, a friction cor-rection of 10 % was added. Static experimental conditions were at temperatures between 1,280 and 1,500 °C, 0.5 GPa and 24 h for fine chromite grains; experimental durations were increased to 144 h for coarser grain sizes (Table 2).
Statically equilibrated charges were re-loaded into a centrifuging piston cylinder with the same bore diameter and assembly as the conventional piston cylinder used for static runs. The centrifuge has a 42-kg single stage piston cylinder and a counterweight mounted into a 1.38 m diam-eter rotating table (for details see Schmidt et al. 2012). The arrangement is such that the assembly axis is radial, ther-mocouple wires are positioned toward the center and accel-eration is directed toward the capsules bottom. Oil pressure cannot be adjusted during centrifugation, hence pressuriza-tion is done in two steps: Pyrex softening at 800 °C and low accelerations followed by a centrifuge (and heating) stop and a second step of oil pressure adjustments to the desired pressure. Centrifuge experiments were carried out at P–T conditions identical to the static equilibrium experi-ments with an additional centrifugal acceleration between 100 and 1,500g for a maximum of 10 h (Table 2).
Analytical techniques
Chemical analyses of the starting material (glass and chro-mite) were performed with wavelength dispersive spectros-copy (WDS) employing a JEOL JXA-8200 electron micro-probe. For this purpose, glass and chromite samples were mounted in epoxy, the surface polished with diamond paste and coated with 20 nm carbon. Chromite grains were ana-lyzed with an acceleration voltage of 15 kV, a beam current of 20 nA and a focused beam. Glasses were analyzed with an acceleration voltage of 15 kV, a beam current of 4 nA and a beam size of 20 μm.
Capsules were mounted along their symmetry axis in epoxy, polished and coated for acquiring backscattered electron (BSE) image mosaics with a scanning electron microscope (SEM and JEOL). In each capsule, the meas-ured area was limited to the central portion of the crystal Fig. 1 Backscattered electron images of experimental charges using
graphite capsules (black). In these experiments, chromite grains (light gray) with initial grain sizes of 6.2 μm were used, conditions were 1,300 °C and 0.5 GPa. a Static experiment resulting in a homogenous spatial distribution of chromite crystals in the silicate melt (dark gray). Centrifugation at b 100g for 20 min, c 200g for 10 h, and d 700g for 10 h. With increasing centrifugal acceleration and run dura-tion, a crystal pile was formed, leaving a crystal-free melt zone at the top. In this crystal pile, porosities in eight layers perpendicular to the capsule’s long axis have been defined for the central 50–60 % of the capsule and plotted in Fig. 3
layer. The reason is that in non-Newtonian fluids with vis-coelastic properties (such as most crystallizing silicate liq-uids, McBirney and Noyes 1979) dropping spheres tend to move toward the vertical walls surrounding the fluid (Singh and Joseph 2000). The walls have a significant effect on the velocity fields of the fluids surrounding the spheres (in both Newtonian and non-Newtonian fluids). To avoid these effects, image analysis was limited to 50–60 % of the cap-sule diameter (Botto et al. 2005; Tatum et al. 2005). The crystal layer accumulated in each capsule was then seg-mented into eight layers perpendicular to the capsule axes and each layer was analyzed separately for crystal size and crystal and melt content (porosity). Furthermore to estimate the errors, several areas were analyzed within one single layer.
The edited images were converted to binary images using ImageJ software, a Java-based image analysis soft-ware, developed at the National Institutes of Health (NIH), United States. The image scale was set, and the propor-tion of crystals to melt measured and used to estimate the porosity of each layer. Crystal sizes were calculated based on the length of the major axis of the best fitted ellipsoid. This ellipsoid has the same value and moment of inertia as the grain (Higgins 2006).
The data collected from polished sections are 2D rep-resentations of 3D populations. 2D sections of grains of
various sizes show grain sizes usually smaller than true sizes, unless the section passes through the center of the particle. Another limitation of 2D sectioning is that smaller grains are less likely to be sampled than larger ones (Hig-gins 1994; Hoshide et al. 2006). To overcome this prob-lem, two strategies have been applied in this study. First, the initial powder was also mounted in epoxy and the size was measured as 2D mean grain sizes. For CSD analy-sis (Marsh 1988), a stereological correction was applied using “CSD Correction 1.4” program (Higgins 2000). For this correction, an accurate estimate of the 3D crystal habit from the 2D measurements is a key element and was obtained by applying “CSDslice” spreadsheet. This is a database which compares raw data with information con-cerning known sections, and it outputs the five best match-ing crystal shapes for the input crystal population (Morgan and Jerram 2006).
Results
Crystal distribution after static experiments
Purely static equilibrium experiments were conducted at 1,280–1,500 °C, a pressure of 0.5 GPa and a duration of 24 h. The starting material was a mixture of 60 vol% glass Fig. 2 Backscattered
elec-tron images of experimental charges at 1,500 °C. a At this temperature, graphite capsules yield iron melt droplets (white droplets) and bubbles (black vesicles) interpreted as CO2 resulting from a redox reaction FeOmelt + Ccapsule =
Femetal + CO 2
bubble. To test and avoid this, b an iridium capsule was used. c In the IR capsules neither iron metal nor gas bub-bles nor a substantial Fe-loss to the capsule have been observed
A B C iridium capsule 100 µm 50 µm SM-C-32 1000g-1500 ºC SM-C-26 graphite capsule 1000g-1500 ºC iron melt droplets
bubbles 500 µm SM-C-32 1000g-1500 ºC iridium capsule iridium capsul e silicate melt chr
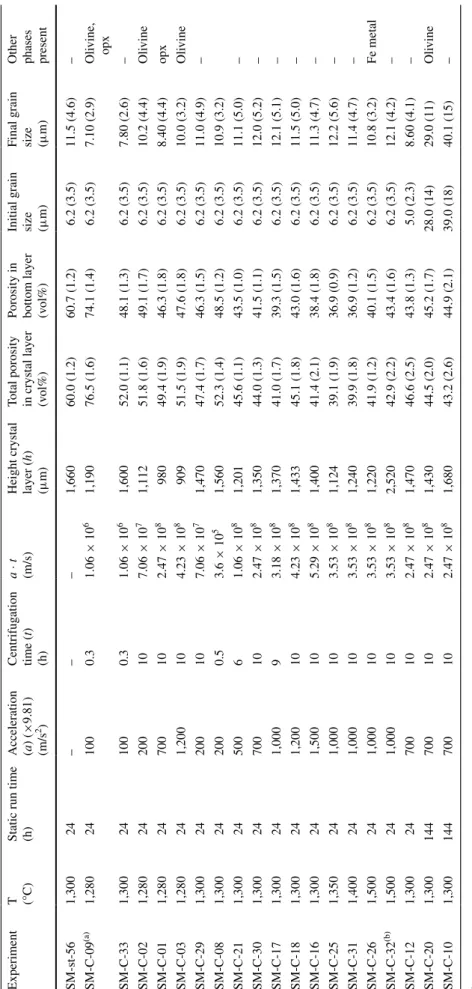
Table
2
Run conditions; all e
xperiments at 0.5
GP
a
a Chromite: glass ratio in the starting material w
as 20:80
v
ol%
b Experiment with Ir capsule, all others in graphite
Experiment
T (°C) Static run time (h) Acceleration (a) ( × 9.81) (m/s 2) Centrifug ation time ( t) (h) a · t (m/s)
Height crystal layer (
h)
(μ
m)
Total porosity in crystal layer (vol%) Porosity in bottom layer (vol%) Initial grain size (μm) Final grain size (μm) Other phases present
SM-st-56 1,300 24 – – – 1,660 60.0 (1.2) 60.7 (1.2) 6.2 (3.5) 11.5 (4.6) – SM-C-09 (a) 1,280 24 100 0.3 1.06 × 10 6 1,190 76.5 (1.6) 74.1 (1.4) 6.2 (3.5) 7.10 (2.9) Oli vine, opx SM-C-33 1,300 24 100 0.3 1.06 × 10 6 1,600 52.0 (1.1) 48.1 (1.3) 6.2 (3.5) 7.80 (2.6) – SM-C-02 1,280 24 200 10 7.06 × 10 7 1,112 51.8 (1.6) 49.1 (1.7) 6.2 (3.5) 10.2 (4.4) Oli vine SM-C-01 1,280 24 700 10 2.47 × 10 8 980 49.4 (1.9) 46.3 (1.8) 6.2 (3.5) 8.40 (4.4) opx SM-C-03 1,280 24 1,200 10 4.23 × 10 8 909 51.5 (1.9) 47.6 (1.8) 6.2 (3.5) 10.0 (3.2) Oli vine SM-C-29 1,300 24 200 10 7.06 × 10 7 1,470 47.4 (1.7) 46.3 (1.5) 6.2 (3.5) 11.0 (4.9) – SM-C-08 1,300 24 200 0.5 3.6 × 10 5 1,560 52.3 (1.4) 48.5 (1.2) 6.2 (3.5) 10.9 (3.2) SM-C-21 1,300 24 500 6 1.06 × 10 8 1,201 45.6 (1.1) 43.5 (1.0) 6.2 (3.5) 11.1 (5.0) – SM-C-30 1,300 24 700 10 2.47 × 10 8 1,350 44.0 (1.3) 41.5 (1.1) 6.2 (3.5) 12.0 (5.2) – SM-C-17 1,300 24 1,000 9 3.18 × 10 8 1,370 41.0 (1.7) 39.3 (1.5) 6.2 (3.5) 12.1 (5.1) – SM-C-18 1,300 24 1,200 10 4.23 × 10 8 1,433 45.1 (1.8) 43.0 (1.6) 6.2 (3.5) 11.5 (5.0) – SM-C-16 1,300 24 1,500 10 5.29 × 10 8 1,400 41.4 (2.1) 38.4 (1.8) 6.2 (3.5) 11.3 (4.7) – SM-C-25 1,350 24 1,000 10 3.53 × 10 8 1,124 39.1 (1.9) 36.9 (0.9) 6.2 (3.5) 12.2 (5.6) – SM-C-31 1,400 24 1,000 10 3.53 × 10 8 1,240 39.9 (1.8) 36.9 (1.2) 6.2 (3.5) 11.4 (4.7) – SM-C-26 1,500 24 1,000 10 3.53 × 10 8 1,220 41.9 (1.2) 40.1 (1.5) 6.2 (3.5) 10.8 (3.2) Fe metal SM-C-32 (b) 1,500 24 1,000 10 3.53 × 10 8 2,520 42.9 (2.2) 43.4 (1.6) 6.2 (3.5) 12.1 (4.2) – SM-C-12 1,300 24 700 10 2.47 × 10 8 1,470 46.6 (2.5) 43.8 (1.3) 5.0 (2.3) 8.60 (4.1) – SM-C-20 1,300 144 700 10 2.47 × 10 8 1,430 44.5 (2.0) 45.2 (1.7) 28.0 (14) 29.0 (11) Oli vine SM-C-10 1,300 144 700 10 2.47 × 10 8 1,680 43.2 (2.6) 44.9 (2.1) 39.0 (18) 40.1 (15) –
and 40 vol% chromite with an initial grain size of 6.2 (3.5)
μm. These experiments resulted in a homogenous spatial
distribution of chromite crystals in the melt (Fig. 1a). The equilibrium average melt content is 60.0 ± 1.2 vol% in good agreement with the amount of glass powder initially admixed. After equilibration at 1,300 °C, chromite grains have a higher Mg# with respect to the starting material, causing an equilibrium melt composition with higher iron content in comparison to the original glass composition (Table 1). Crystal contents in 8 layers perpendicular to the capsules long axis were measured, the results are reported as porosity profiles in Fig. 3.
Stokes crystal settling
To experimentally determine the settling velocity of a dense suspension of chromite grains, we measured the travel dis-tance of the uppermost crystals of the cumulate layer along the length of the capsule. If the uppermost layer of the chromite pile has the same porosity as the bulk porosity, one can assume that these grains remain effectively in sus-pension and do not pile up along grain contacts. To achieve this goal, several trials at different accelerations and run times have been undertaken. The optimum setting maxi-mizes the travel distance of the top crystals still maintain-ing a layer of crystals with startmaintain-ing porosity and was found to be 100 g for 20 min. To obtain a statistically acceptable traveling distance of the top crystals, a starting material with less chromite (20 vol% instead of 40 vol%) had to be prepared. The observed settling velocity of such a suspen-sion, recalculated to 1 g is approximately 10.1 μm/h or 2.8 × 10⁻⁹ m/s. The same centrifugal force and time was
applied to a second capsule (Fig. 1b) containing the crystal: melt ratio (40:60 vol%) of the compaction experiments to define the average porosity after crystal settling, this value is referred to as ϕ0 (i.e., 0.52) in the following sections.
Porosity profiles after centrifugation
After static equilibration, the homogeneous and textur-ally equilibrated samples were centrifuged at accelerations
0.3 0.4 0.5 0.6
Normalized height of the cumulate layer
0 0.2 0.4 0.6 0.8 1.0 1.2 static, 24h 200g,10h 500g, 5h 700g,10h 1000g, 9h 1200g,10h 1500g,10h 0.3 0.4 0.5 0.6 0.7 0 0.2 0.4 0.6 0.8 1.0 1.2
Normalized height of the cumulate laye
r
Normalized height of the cumulate layer
0.3 0.4 0.5 0.6 0.7 0 0.2 0.4 0.6 0.8 1.0 1.2 1300°C 1300°C 1350°C 1400°C 1500°C A B C d=11.5 µm, T=1300 °C d=11.5 µm, a=1000g, 10h T=1300°C, a=700g, 10h static,11.5 µm8.6 µm 12.0 µm 29.0 µm 40.1 µm graphite Ir
Porosity (residual melt)
0.7
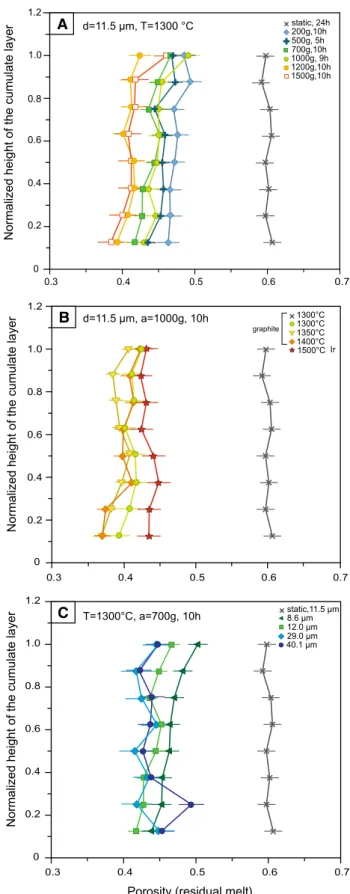
Fig. 3 Porosity profiles through the chromite cumulate layer formed
in the capsules. Crystal distribution after the static experiment is shown as a gray line in all diagrams. a Experiments at identical T, P and initial grain size (1,300 °C, 0.5 GPa, and 6.2 μm, respectively) but different centrifugal acceleration and duration shown as colored lines and symbols. In centrifuged experiments, within each profile, porosity decreases downwards and the lowermost layer is the most compacted one. In the most compacted experiment (orange squares), a porosity of 0.38 was achieved after 10 h centrifugation at 1,500g. b Experi-ments at different temperatures, but identical pressure, acceleration and initial grain size, show an increase of ~3 % crystals in the bot-tom layer with an increase in temperature from 1,300 to 1,400 °C. The experiment at 1,500 °C does not follow this trend but was conducted with an IR capsule with a different aspect ratio than the graphite cap-sules. c Experiments with different initial and final chromite grain sizes. Grain size reported on the plot is the final grain sizes measured after the centrifuge experiments. Using coarse grains with large size distributions (Table 2) leads to a more noisy profile, the most com-pacted layer is not always the lowermost layer. Error bars are 1σ
between 200 and 1,500g for 6–10 h (Table 2) at identical P–T conditions and initial chromite grain size. In these experiments, a crystal pile formed at the bottom of the cap-sule (Fig. 1c, d). Porosity profiles through this crystal pile are defined by the melt contents in 8 layers perpendicular to the capsule’s long axis (Fig. 3a). Porosities determined through image analysis have analytical errors of ±0.9– 2.6 % (1σ) as determined by repeated porosity measure-ments on different parts of a single layer.
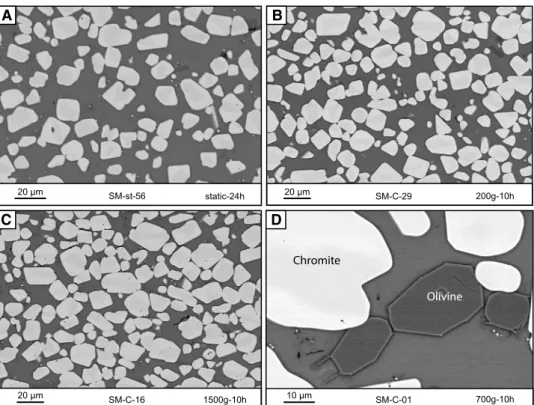
In comparison with the Stokes crystal settling experi-ment which led to a porosity of ~0.52, the most compacted crystal pile has a bottom layer porosity of ~0.38, formed after centrifugation at 1,500g. Within each profile, poros-ity increases upwards, the lowermost layer being the most compacted one. This change in crystal content is accompa-nied by a textural change, centrifuged experiments yield-ing much more grain–grain contacts than static experi-ments and therefore less residual melt between the crystals (Fig. 4a–c). In experiments at 1,280 °C olivine or orthopy-roxene crystallized together with chromite grains (Fig. 4d) resulting in a less compacted cumulate pile (see below for more details), thus a second series of experiments was con-ducted at 1,300 °C, resulting in chromite only.
To investigate the effect of temperature on chromite compaction, a third series of experiments with tempera-tures of 1,300–1,500 °C was conducted, this series had identical grain size, acceleration and pressure (composi-tion of melt and chromite in these experiments are given in Table S1, Supplementary Data). Porosity profiles through
the cumulate pile formed in this series (Fig. 3b) show an increase of almost 3 % crystal content in the bottom layer with a 100 °C increase in temperature from 1,300 to 1,400 °C. The experiment at 1,500 °C does not follow this trend but this experiment was conducted in IR capsule and had a different aspect ratio than the graphite capsules. The height of the cumulate pile in the IR capsule is almost twice that of the graphite capsule (2.5 vs. 1.2 mm) in contrast to a width of the crystal pile only 0.6 times that in graphite cap-sules (0.8 vs. 1.3 mm) (Figs. 1, 2b). As the effect of tem-perature on compaction appears to be relatively minor in this data set, we did not further pursue this issue.
Compaction of chromite cumulates
In centrifuge experiments, the effective stress integrated over time that acts under the weight of the cumulate pile of height h can be considered as proportional to the amount of compaction as it integrates the driving force for compaction over time. This can be expressed as (Schmidt et al. 2012):
where �ρ(chromite−melt) is the density contrast between chromite and melt (in kg/m3), h in this case the thickness of the chromite layer above the center of the lowermost segment (in m), a the experimental acceleration (in m/s2), and t the centrifugation time (in s) (Table 2). Densities of our chromite grains (Deer et al. 1992) and melt (Stolper (1)
t
0
Pedt = �ρ(chromite−melt)·h · a · t Fig. 4 Backscattered electron
images of the bottom part of
a static and b, c centrifuged
experiments at 200g and 1,500g, respectively. There are less grains/unit area (light gray) sus-pended in the melt (dark gray) after static experiments when compared to the centrifuged and compacted experiments. Also, with increasing centrifugation, the number of grain contacts and the grain contact area increases. d Crystallization of olivine grains in experiments at 1,280 °C which hinders the compaction process (see text for more details) 20 µm 20 µm m µ 0 1 m µ 0 2 SM-st-56 SM-C-29 SM-C-16 SM-C-01 200g-10h 700g-10h 1500g-10h static-24h Olivine Chromite A B C D
and Walker 1980) are calculated to 4,600 and 2,720 kg/m3, respectively, and thus �ρ(chromite−melt) is 1,880 kg/m3.
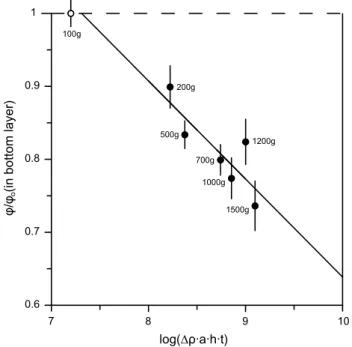
The relation between the porosity in the bottom layer of each experiment with effective pressure integrated over time expressed here as “applied pressure time” (Schmidt et al. 2012) is shown in Fig. 5. The experiments at 1,300 °C can be fit within error with a logarithmic function:
where ϕm is the porosity or melt fraction in the bottom
layer after centrifugation between 200 and 1,500g, ϕ0 the
porosity after crystal settling experiment (0.52 ± 0.01). The fit quality is r2 = 0.70.
With increasing effective pressure integrated over time, an increase in packing density of crystals is achieved through reorganization of crystals in early stages, and vis-cous or chemical compaction in a second stage (Hunter
1996a). Porosity reduction (as a measure for compaction) being proportional to effective pressure integrated over time, together with an increase in grain–grain contacts in centrifuged experiments (Fig. 4) indicates that compac-tion is dominated by a process of pressure dissolucompac-tion– reprecipitation at grain scales (e.g., Connolly and Pod-ladchikov 2000; Hunter 1996a; Yang 2001). During this process, grains dissolve at high stress granular contacts (2)
ϕm/ϕ0= −0.134(4) log (�ρ · h · a · t) + 1.98(38)
and reprecipitate the same material in regions of lower stress where they are in contact with interstitial liquid (e.g., Shimizu 1995). Because of the chemical reaction involved, this is termed chemical compaction. Detailed tex-tural observations by high-resolution electron microscopy (HREM) at the boundaries between olivine grains in simi-lar centrifuged experiments (Schmidt et al. 2012), yield further evidence for a dissolution–reprecipitation process at microscales.
In experiments with identical initial grain size and pres-sure but slightly lower temperature (1,280 °C), the cumu-late pile is less compacted compared to the experiments at 1,300 °C. In the 1,280 °C set of experiments, olivine and/or orthopyroxene crystallized with chromite (Fig. 4d) and the lower compaction rate resulted in an intercept of 1.32 and a slope of −0.05 (in Eq. 2). In a system in chemical equilib-rium, the presence of a second phase can either slow down the velocities of moving grain boundaries or may cause complete immobilization (Herwegh et al. 2011). In these experiments, the compaction process, achieved through pressure solution and reprecipitation may have been hin-dered due to the presence of olivine in contact with chro-mite grains.
Effect of grain size on compaction
To establish the effect of grain size on compaction, chro-mite grains were sieved in three different size ranges with averages of 5, 28 and 39 μm. Starting material mixtures had the same 40:60 volume proportion of chromite to glass. The mixtures were first statically equilibrated, using a longer equilibration time of 144 h for the coarser chro-mite grains, and then centrifuged for 10 h at 700g to ena-ble direct comparison to the first set of experiments. Final mean grain sizes are reported in Table 2. These experiments also resulted in a cumulate pile at the bottom of the cap-sule. Porosity was again measured in eight layers perpen-dicular to the capsules long axis, porosity profiles are pre-sented in Fig. 3c. Starting with finer grains with mean sizes of 5.0 μm (increased to 8.6 μm after the static experiment), the lowermost layer is the most compacted and porosity increases toward the top with the same trend as in the refer-ence experiments with a mean grain size of 12 μm. Using coarser starting grains with mean sizes of 28 and 39 μm (changed to 29 and 40 after the experiments) the nominally most compacted part of the cumulate pile is not always the lowermost layer and the porosity change over the height of the crystal pile is not as regular as with finer grains. The coarser grains cause larger statistical errors in image anal-ysis because much less crystals are present per unit area when compared with fine grain chromite. Because most errors overlap (Fig. 3c), the functional form of the depend-ence of compaction on grain size could not be determined.
7 8 9 10 log(∆ρ·a·h·t) 0.6 0.7 0.8 0.9 1
φ/φ (in bottom layer)
o 200g 500g 700g 1000g 100g 1200g 1500g
Fig. 5 Relation between the porosity in the lowermost layer in each
centrifuged experiment normalized to the porosity after crystal set-tling (ϕ0) versus the logarithm of effective pressure integrated over time. Each point corresponds to a centrifuged experiment (labels show the experimental acceleration employed), the solid line repre-sents the best fit to the experimental data. The porosity after crystal settling (dashed line and open circle) is considered as the starting porosity before compaction. Error bars are 1σ
Grain size and grain size distribution
Grain growth
Chromite crystals from experiments with 5–6.2 μm starting grain size have equant shapes with planar facets and rounded to sharp edges (Fig. 4). These near-equilibrium octahedral crystal shapes were already achieved after static experiments for 24 h. Mean grain sizes change within a narrow range and large deviations from the mean value can be observed. With a starting average grain size of 6.2 (3.5) µm, the maximum mean size achieved after the static and centrifuge experiments at 1,300 °C, is 12.1 (5.1) µm (experiment SM-C-17). The aver-age grain size of crystals in a liquid at chemical equilibrium depends on Ostwald ripening, a process in which large grains grow at the expense of smaller ones (Cabane et al. 2001, 2005; Evans et al. 2001). The rate controlling mechanism of Ostwald ripening can be either diffusion of components in the melt (dif-fusion controlled) or attachment/detachment of atoms at crys-tal–melt interfaces (surface reaction controlled) (Cabane et al.
2005; Faul and Scott 2006). For this mechanism, the relation between the initial mean grain size (¯d0) and mean grain size
after the experiment (¯d) of duration (t) is:
(3)
¯
dn− ¯d0n=kpt
where kp is the thermally activated rate constant (or rip-ening rate) and n the growth exponent of the order of 2–5 (Cabane et al. 2001; Evans et al. 2001). If this functional form applies to the experimental results, then the value of n can be used to define the rate limiting mechanism (Cabane et al. 2005). When plotting the mean grain size of chromite as log(d) versus log(t), the general grain growth equation provides a good fit (r2 = 0.73) (Fig. 6):
and the inverse of the slope of this equation corresponds to the grain growth exponent (n). Unfortunately, the relatively large statistical errors in grain size prevent the grain growth exponent to be better constrained than between 2.5 and 6.2. This span is in the range of theoretical values for Ost-wald ripening but does not properly define the rate limiting mechanism (i.e., diffusion or surface reaction controlled).
Crystal size distribution
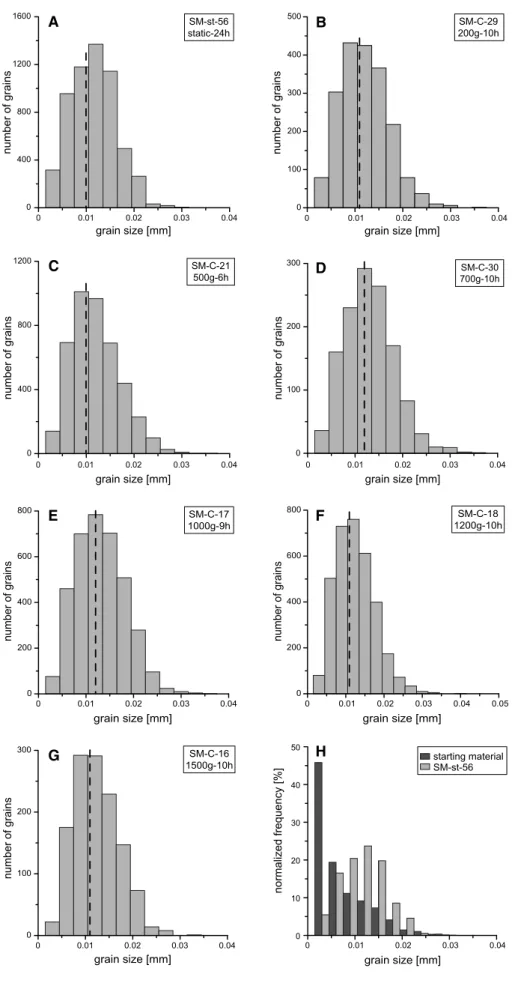
Further support for Ostwald ripening stems from crystal size distributions (Fig. 7a–g). A decrease in fine grain sizes and a shift of mode toward medium (to large) grain sizes can be observed. This is best illustrated in Fig. 7h where the frequency distribution histograms of the chromite grain sizes in the initial starting powder are compared with grain sizes after 24 h at static conditions.
Crystal size distributions normalized to mean grain size and maximum mode are used to define the kinetics of Ost-wald ripening of particles in suspensions (Faul and Scott
2006 and references therein). As shown in Fig. 8, the nor-malized distribution is about 2.5 units wide with a tiny tail continued toward a radius three times the mean grain size. Such a crystal size distribution shape is observed in almost all our experiments and is characteristic for second-order surface reactions (Faul and Scott 2006). Nevertheless, these distributions have their maximum at the mean grain size, which is typical for diffusion controlled Ostwald ripening.
A compilation of 3D crystal size distributions, obtained using the CSD correction program (Higgins 2000), is plot-ted as ln(population density) versus grain size for all static and centrifuged experiments at 1,300 °C (Fig. 9), together with the initial grain size distribution in the starting mate-rial. The latter has a high population density of fine grains, but these have strongly decreased in abundance after 24 h at static conditions, the curve having moved toward coarser grains. After additional centrifugation of 6–10 h, almost all CSDs have generally consistent shapes and a more pro-nounced loss of fine grain size fractions can be observed when comparing with static experiments. Fine grain sizes on these curves are overturned and show a log-linear trend for larger grain sizes. Comparing these shapes with ideal-ized CSD plots (Boorman et al. 2004), most similarities
(4) log (d) = 0.28(12) log (t) − 0.36(5) 4.9 4.95 5 5.05 5.1 10 20 5 log (t) [s]
mean grain size [µm]
Fig. 6 Logarithmic relation between mean size of chromite grains
(with 1σ error bars) and experimental run time. These experiments started from 6.2 μm mean grain size. The solid line represents the straight line best fitting the experimental results. The inverse of the slope corresponds to the grain growth exponent (Eqs. 3, 4). Relatively large uncertainties in grain size and a narrow range of final grain sizes prevent the grain growth exponent to be better constrained than between 2.5 and 6.2
Fig. 7 Crystal size distributions
of chromite grains in experi-mental charges. a–g A decrease in fine grains and a slight shift of mode (dashed line) toward medium (to large) grain sizes can be observed. Experiment number, experiment accelera-tion and duraaccelera-tion are given in each plot. h Frequency distribu-tions of the chromite grain sizes in the starting material com-pared with the static experiment
at 1,300 °C, 0.5 GPa, 24 h 00 0.01 0.02 0.03 0.04 400 800 1200 1600 number of grains grain size [mm] 0 0.01 0.02 0.03 0.04 0 400 800 1200 grain size [mm] number of grains 0 0.01 0.02 0.03 0.04 0 200 400 600 800 number of grains grain size [mm] SM-C-17 1000g-9h 0 0.01 0.02 0.03 0.04 0.05 0 200 400 600 800 number of grains grain size [mm] 0 0.01 0.02 0.03 0.04 0 100 200 300 number of grains grain size [mm] SM-st-56 static-24h A C E F G 0 0.01 0.02 0.03 0.04 0 10 20 30 40 50 normalized frequency [%] grain size [mm] starting material SM-st-56 H 0 0.01 0.02 0.03 0.04 0 100 200 300 400 500 SM-C-29 200g-10h grain size [mm] number of grains B SM-C-21 500g-6h 0 0.01 0.02 0.03 0.04 0 100 200 300 number of grains grain size [mm] D SM-C-30 700g-10h SM-C-18 1200g-10h SM-C-16 1500g-10h
are seen with grain growth through crystal aging (Ostwald ripening). CSD profiles of chromite cumulates from the Stillwater Complex, Montana, also indicate crystal aging
as the dominant mechanism of grain growth (Waters and Boudreau 1996).
Grain growth and compaction
In principal, it would be desirable to understand the rela-tion between crystal growth driven by surface energy mini-mization and the compaction process driven by differential stresses. However, in the experiments, it is not possible to distinguish whether crystal aging is enhancing compaction or whether compaction-driven recrystallization enhances crystal growth. The difference in mean grain size between static and centrifuged runs (i.e., from ~11 to ~12.1 μm) is within the uncertainty of the measurements (Table 2). To distinguish between the above possibilities, a static ment would have to be compared to a centrifuge experi-ment of more than 10 days centrifugation at high accelera-tion, which is not a desirable run configuration.
Discussion
Crystal settling velocities
Mechanical settling velocities (vs) of isolated spherical grains in a non-Newtonian fluid can be calculated with Stokes’ law (1851):
where d is the grain size (in m), Δρ the density differ-ence between solid and liquid (in kg/m3), n · g the accel-eration in the system, expressed as a multiple (n) of Earth’s gravitational acceleration g, and μ the liquid viscosity (in Pa s). The average size of chromite grains (11.5 μm) after static experiments conducted at 1,300 °C, the densities of chromite of 4,600 kg/m3 (Deer et al. 1992) and of melt 2,720 kg/m3 (Stolper and Walker 1980), and a melt viscos-ity of 25.7 Pa s (Giordano et al. 2008) would yield a Stoke settling velocity of 5.18 × 10⁻⁹ m/s.
For gravity settling of minerals in a magma, Stokes’ law is only valid when grains are spherical in shape and isolated in an infinite layer of melt. Highly concentrated suspen-sions of crystals settle as aggregates and the upward flow of the fluid reduces the overall settling rate (e.g., Mirza and Richardson 1979; Schwindinger 1999). Furthermore, for a given relative velocity, the average velocity gradients, and hence shear stresses will be greater in a concentrated suspension than for isolated grains (Mirza and Richardson
1979). Depending on the crystal content, the velocity of the particles can be empirically defined as “hindered settling velocity” v(ϕc) (Richardson and Zaki 1954; Tomkins et al.
2005): (5) vs = 1 18 d2�ρ(n · g) µ 0 1 2 3 4
normalized grain size 0 0.2 0.4 0.6 0.8 1 normalized frequency 1 0.8 0.6 0.4 0.2 0 0 1 2 3 4
first order surface reaction controlled
diffusion controlled Rayleigh distribution
second order surface reaction controlled
Log-normal distribution
normalized frequenc
y
normalized grain size Faul & Scott, 2006
Fig. 8 Normalized crystal size distributions of chromite grains after
static (red curve) and centrifuged (black curves) experiments. Here, crystal size is normalized to mean grain size and frequency to the maximum value of distribution. Distribution shapes are similar for all experiments and attributed to second-order surface reaction (blue curve in inset, after Faul and Scott 2006)
0 0.02 0.04 0.06 8 12 16 20 24 starting material static experiments centrifuged experiments Ln (population density) grain size [mm]
Fig. 9 3D chromite crystal size distributions of Ln (population
den-sity) versus grain size using the CSD correction program of Higgins (2000). The size distribution of the initial chromite powder used in the starting material (light gray curve) is compared to the size dis-tribution after a static experiment (24 h, 1,300 °C) (dark gray curve) and the centrifuged experiments with total experimental times of 30– 34 h (black curves)
where ϕc is the crystal fraction in the suspension and n the sedimentation exponent. The hindered settling veloc-ity for a chromite suspension with 23.5 vol% chromite grains is experimentally measured to be 2.8 × 10⁻⁹ m/s.
This is about half (53 %) of the Stokes settling velocity of 5.18 × 10⁻⁹ m/s. Using these velocities for a suspension
of 23.5 vol% crystals results in a sedimentation exponent
n = 2.35 (3). This value is close to the lower limit of experi-mentally determined values of n (4.65–2.4) (Baldock et al.
2004) which are mostly based on sedimentation of sand par-ticles in fresh water. The effect of the sedimentation expo-nent on settling velocity is shown in Fig. 10. Higher sedi-mentation exponents lead to a more rapid decrease in settling velocity with increasing crystal content in the suspension. The sedimentation exponent of olivine grains in a set of sim-ilar experiments was determined to ~4.1 (6) (Schmidt et al.
2012). The hindered sedimentation exponent is necessary to describe the experiments, but of little influence for the natu-ral case, where <0.1–1 vol% chromite grains are expected to settle in a magma column (compare to Eq. 6).
Formation times of gravitational chromite orthocumulates In the experiments, the mechanical Stokes settling of the dense chromite suspension (40 vol% crystals) led to the (6)
v(ϕc)=vs·(1 − ϕc)
n
formation of an orthocumulate with an average poros-ity of ~0.52 in the chromite layer. This is in good agree-ment with the known porosities (0.5–0.7) of orthocumulate rocks (e.g., Tegner et al. 2009) which ultimately depends on crystal shape. Thus, the final porosity of a gravitation-ally formed orthocumulate of chromite without any further compaction is recommended to be 0.52.
To calculate the settling time that leads to a chromite orthocumulate layer, assuming that mechanical settling is the only mechanism, the following equation can be used: where h is the thickness of the resulting orthocumulate layer (in m), ϕci the crystal content in the initial melt layer
from which the orthocumulate forms, v(ϕc) the hindered
set-tling velocity of a suspension with an initial crystal content (in m/s) and the constant 0.48 the final crystal content of a gravitationally formed chromite orthocumulate layer. Con-sidering an initial melt layer or magma chamber with 1, 0.5, or 0.1 % (ϕci = 0.01–0.001) chromite with an average grain size of 1–2 mm, the time needed to form a 1 m chro-mite orthocumulate layer would vary between 14–3.5, 28–7 and 140–35 days, equal to a layer growth of 0.007–0.3 m/ day.
One of the models for the chromite layers in the Bush-veld Complex proposes 1.2 vol% initial chromite in the parent magma (Mondal and Mathez 2007), chromites hav-ing an average grain size of ~1.0 mm (Hulbert and Von Gruenewaldt 1985). In this case, the orthocumulate forma-tion time of a 1-m layer with a final crystal content of 48 % would be around 11 days. Nevertheless, the 1.2 vol% initial crystal content in the magma layer is still a matter of debate and considered as the maximum crystal content.
Formation times of compacted chromite cumulates
Following the initial process of crystal settling, the crys-tal mush will be modified due to secondary or postcumu-lus processes resulting in the formation of meso- or adcu-mulates (e.g., Hunter 1996a; McBirney et al. 2009). The experimental results of this study show that the reduction in porosity in the bottom layer of a cumulate pile is pro-portional to the effective stress integrated over time either applied through centrifugation (Eq. 2) or in nature. The time dependence of the porosity reduction or compaction process can thus be used to calculate compaction times for natural cases. Considering a linear grain size scaling as appropriate for the dissolution–reprecipitation process observed in the experiments (e.g., Shimizu 1995), the time (tadcum) necessary to reduce porosity from 0.52 (i.e., the average porosity after crystal settling) to a porosity ϕm at a
depth hcum (in m) within a cumulate pile can be calculated by solving Eq. (2) for time:
(7) tortho=(h ·0.48/ϕci−h)/v(ϕc) crystal fraction 0 0.1 0.2 0.3 0.4 0.5 0.6 0 0.2 0.4 0.6 0.8 1
hindered settling velocity/Stokes settling velocity
n=1
n=2.3
n=4
Fig. 10 Effect of sedimentation exponent on the settling velocity
of chromite shown as the ratio between hindered- to Stokes settling velocity. Velocity is reduced more profoundly when sedimentation exponent is higher, the effect of hindered settling is important in the experiments but not at low chromite fractions as expected for LMIs
where �ρ is the density difference between the crystals and the melt (in kg/m3), g is Earth gravity (m/s2) and d/
d0 accounts for the linear grain size scaling with d0 (in m) being the initial grain size, i.e., 11.5 × 10⁻⁶ m as in the
experiments. Equation (8) then becomes:
From an original orthocumulate layer with a porosity of 0.52, adcumulate formation times of a 1-m thick layer of chromite for different residual porosities and grain sizes are calculated and shown in Fig. 11. The formation time of 1 m chromite layer with 70–80 vol% chromite at the bottom and an average grain size of 1.0 mm results as 4.5–125 years. The selected thickness, porosity and grain size values are chosen as characteristic for the Bushveld UG2 and UG3 layers (Mondal and Mathez 2007), nev-ertheless, this calculation just provides a time scale for a single layer. Compaction times calculated for an olivine cumulate with identical thickness, 2.0 mm grain size and 0.54 initial porosity (Schmidt et al. 2012) are calculated to be much shorter, i.e., 0.2 and 0.9 years for reaching 70 and 80 vol% olivine at the bottom of the layer. The large differ-ence between adcumulate formation times of chromite and
(8) tadcum= 6.166 × 10¹⁴ 10(14.35·ϕm) · d hcum·g · �ρ · d0 (9) tadcum= 5.471 × 10¹⁸ 10(14.35·ϕm) · d hcum·�ρ
olivine demonstrates that despite the much higher density contrast with the melt (Δρ ~ 1,880 and 420 kg/m3, respec-tively), the rate of chemical compaction for chromitites is much lower than for olivine cumulates. This is in agree-ment with lower crystal growth rates observed for chromite in comparison to olivine.
Compaction versus characteristic cooling times
To evaluate whether such compaction times are feasible, we calculate characteristic solidification times of half dikes and sills assuming that the solidifying magma loses heat by conduction to the country rock (Turcotte and Schubert
2002):
where b is the sill half width (in m), k thermal diffusivity of the country rock (in m2/s) and λ a dimensionless param-eter related to specific heat capacity, intrusion and country rock temperatures and latent heat of solidification. Obvi-ously, cooling times increase with sill thickness (and coun-try rock temperature), hence the fastest cooling and most unfavorable case for compaction would result from the highest initial chromite content in the magma chamber. Still considering the formation of a 1 m chromite cumu-late layer with a porosity of 0.3, an initial chromite content of the magma of 1 vol% requires a sill thickness of 70 m (calculated from: cumulate layer thickness crystal content/ initial crystal content). In this case, a characteristic cool-ing time of 34–53 years results for country rock tempera-ture of 400–700 °C, respectively. This solidification time is longer than compaction times of a single chromite layer calculated from Eq. (9), i.e., ~2–14 years for grain sizes of 0.5–3 mm. Consequently, even in the most unfavorable case, compaction to porosities <0.3 are feasible. In a pos-sibly more realistic case with 0.1 vol% of chromite forming from the magma, a sill thickness of 700 m is required for a 1-m-thick cumulate, leading to a characteristic cooling time of 3,400–5,300 years, much longer than any of the compac-tion times calculated.
It is not the purpose of this contribution to model lay-ered intrusions, for an extensive treatment of LMIs cool-ing processes see, e.g., Irvine (1970). In fact, the floor of a more or less continuously crystallizing layered mafic intrusion is made by a thick pile of recently accumulated and partially solidified magmatic material yielding near-solidus boundary temperatures of ~1,000 °C. A slightly above solidus temperature of the floor is indicated in some of the Bushveld layers by footwall pegmatoids which are interpreted as residual melt escape within the lower layer (Mathez and Mey 2005). Unfortunately, the height of the magma chamber in layered mafic intrusions and hence the (10) t = b 2 4k · 2 0.15 0.20 0.25 0.30 0.35 0.40 porosity 0 40 80 120 160 200 time [years] 0.5 mm grain size 1 mm grain size 2 mm grain size 3 mm grain size 1 meter chromite cumulate layer
Fig. 11 Chromite accumulate formation times calculated from
Eq. (9). In this example, a single, 1 m chromite cumulate layer with an initial porosity of 0.52 is considered. Shown are grain sizes of 0.5, 1, 2 and 3 mm (red, blue, green and black curves, respectively), typi-cal Bushveld chromitites have 1–2 mm grain size and residual porosi-ties of 0.2–0.3 on average
size of the heat reservoir at any given time is hard to con-strain. The magma chamber height could range from a few hundred meters to the total LMI-height, or possibly even more given the fact that most LMIs are cumulative, part of the fractionated melt being erupted and eroded (e.g., Caw-thorn and Walraven 1998; VanTongeren et al. 2010). Bulk cumulate viscosity
From the experimentally obtained porosity profiles through the compacting chromite and olivine layers and the effec-tive pressures applied, bulk viscosities of the matrix (ξ) can be calculated. For this calculation, we have used the formu-lation of Connolly and Podladchikov (2000), which is for the Darcian flow of a slightly compressible fluid through a viscoelastic matrix composed of incompressible solid grains:
where ϕ is the porosity or melt content, t the experimental time, and Pe the effective pressure applied during centrifu-gation on the bottom layer of the cumulate pile. For this calculation, we employed the porosity difference in the bottom layer of two experiments of identical centrifugal acceleration (200g) but different times (20 min vs. 10 h, Table 2). The matrix bulk viscosity for chromite results to
4 × 10⁹ Pa s. The same calculation can be applied to the
experiments on olivine cumulates (Schmidt et al. 2012), where the bulk viscosity can be calculated from two experi-ments at 400g but 6 h and 50 h run times. For olivine a matrix bulk viscosity of 4 × 10⁸ Pa s results, lower than
for chromite and in agreement with the faster compaction observed for olivine relative to chromite.
Reported values of bulk matrix viscosity (or effective bulk viscosity) range between 1018 Pa s (McKenzie 1985; Sparks et al. 1985), 1014 Pa s (Shirley 1986) and 1011 Pa s (Boudreau and Philpotts 2002). The former value is derived from solid grain deformation without allowing for melt mediated dissolution/reprecipitation processes, the latter one was inferred from the observed compaction profiles in the Holyoke flood basalt. Our direct experimental deter-mination of the effective bulk viscosity yield significantly lower values of magnitude 109 Pa s, indicating that com-paction occurs much faster than would be anticipated from those earlier viscosity estimates.
The lower limit of compaction, melt escape and fluidization
Compaction is a priori a process that does not require changes in temperature, pressure or bulk chemistry, hence as a first approximation the bulk system retains a constant (11)
dϕ
dt = −
(1 − ϕ)
ξ Pe
crystal/melt ratio. In the absence of crystallization, the den-sification of the cumulates due to the overburdening crys-tal pile requires expulsion of melt interstitial to the accu-mulated grains (e.g., McKenzie 1984; Shirley 1986). In our case, this melt migrates upwards to the melt reservoir representing the magma chamber. This upward directed melt flow is significant as long as the residual permeability of the cumulate pile is not too low. When permeability is reduced such that melt escape becomes difficult, the melt pressure increases and further compaction is retarded (e.g., Boorman et al. 2003; Shirley 1987).
To evaluate whether melt escape is hindered one can compare the hydraulic pressure gradient (∇Ph) necessary
for fluid expulsion with the maximum possible effective pressure gradient in the crystal pile (∇Pe):
where q is the volumetric melt flux (in m/s), μ the melt viscosity (in Pa s), k the cumulate permeability (in m2),
ϕm residual porosity, Δρ density difference between
crys-tals and melt (in kg/m3) and a the acceleration, either Earth gravity or the acceleration applied through centrifugation (in m/s2).
Experiments
The appropriate experimental parameters in Eqs. (12) and (13) are Δρ = 1,880 kg/m3, μ = 25.7 Pa s, ϕm = 0.39– 0.46, and a = 200–1,500 (×9.8) m s−2. Permeability k (in
m2) is calculated from k = (ϕm3 · d2/C)/(1 − ϕm)2 (Carman– Kozeny equation) with d (grain size) = 11–12.1 μm and
C = 10 from Connolly et al. (2009). The volumetric melt flux q is estimated as q = −h Δϕ/t with h being the cumu-late pile thickness (1,201 to 1,470 μm in the experimental charges), Δϕ the change in porosity during compaction and
t the experimental run times of 6–10 h. With these values, for the chromite experiments, the effective pressure gradi-ents are 102–103 times higher than the fluid pressure gra-dients, implying that compaction in the experiments is not limited by melt escape.
The porosity at which compaction becomes limited by expulsion of interstitial melt can be estimated by find-ing the porosity at which the hydraulic pressure gradient equals the effective pressure gradient (i.e., ∇Ph= ∇Pe).
For our chromite experiments, this porosity is between
ϕm = 0.1–0.2. Natural cumulates
When melt escape becomes hydraulically limited, the matrix is fluidized. In the lower parts of the cumulate, (12)
∇Ph= −q · µ/k
(13)
crystals are hold down by the overlying crystal burden and melt flux aggregates over a rather limited height. In the upper parts of the cumulate, the escaping melt aggregates from the entire crystal pile while the down-ward directed force decreases strongly with the decreas-ing overlydecreas-ing height of the crystal pile. This may lead to crystals moving again upward, a process often described as fluidization of the cumulate (e.g., Boorman et al. 2003; Boudreau 1992). Once the matrix is fluidized, local insta-bilities may result in crystals being carried upward by the fluid.
With the characteristic compaction times for natural cases calculated above (Sect. 4.3), the difference between the hydraulic and effective pressure gradients can be evalu-ated from Eqs. (12) and (13). In a 1 m chromite cumulate layer with an initial porosity of 0.52 and a residual poros-ity of 0.30, 1.0 mm grain size and a compaction time of 4.5 years, effective pressure gradients resulting from the crystal pile are almost three orders of magnitude larger than the hydraulic pressure gradients in the cumulate layer. In this problem set, permeabilities even at a few percent poros-ity are so large that they easily accommodate any realistic melt flux. This is also true, if some additional flux results from cumulate layers still under compaction below the cumulate layer of interest. Consequently, at the compaction time scales (years to decades) calculated for ultramafic to mafic cumulates, compaction is not limited by melt escape and would not result in fluidization unless the escaping melt is focused. In nature, focused melt flow is conveni-ently observed in the so-called uppers (e.g., Boudreau and McCallum 1992; Mungall and Naldrett 2008). These are essentially frozen-in upward directed schlieren of cumulate minerals interpreted as being driven upwards by more or less focused melt escaping from the cumulates. Similarly, breccia pipes have been described in Bushveld (Boorman et al. 2003) which are also interpreted as localized cumu-late fluidization.
The melt flux necessary for fluidization can be estimated from the conditions at which the effective pressure vanishes (Eqs. 12, 13):
Employing the parameters as above, this flux is ~−2.8 × 10⁻⁶ m/s. This is about 103 times the volumetric melt flux (i.e., 1.6 × 10⁻⁹ m/s) calculated for a 1 m
chro-mite cumulate with 0.3 residual porosity, 1 mm grain size and 4.5 years compaction time.
Furthermore the melt flux necessary for fluidization is one order of magnitude less than the Stokes settling veloc-ity (i.e., 3.98 × 10⁻⁵ m/s) of identical chromite grain sizes
but corresponds well to the hindered settling velocity of 2.35 × 10⁻⁶ m/s with residual porosity of 0.3.
(14)
q = −�ρ · g · (1 − ϕm) ·k/µ
Calculating compaction times in multiple layers
In large layered mafic intrusions, rates of accumulation have been proposed to be around 0.01 m/year and thus compaction can be efficient within a few tens of meters (Tegner et al. 2009) and may effect multiple layers simul-taneously. In fact, in most layered mafic intrusions, chro-mite layers are part of a sequence associated with layers of mafic minerals (typically olivine and pyroxenes).
To evaluate the effect of simultaneous compaction of several layers on resulting porosities and porosity profiles, we recast Eq. (2) as:
where h (increasing downwards) is height (in m), Δρ the density contrast of crystal and melt (1,880 kg/m3 for chromite and 420 kg/m3 for olivine), t is time (in s), d grain size (in m), and ϕ0 the porosity after crys-tal settling. k1 and k2 derive from the experimentally fit constants of Eq. (2) for chromite in this study and are
−0.0581 and 2.50, while k1 and k2 for olivine derive from (15) ϕ(h)=(k1·Ln(�ρ · h · t/d) + k2) · ϕ0 porosity 0.1 0.3 1 3 10 30 100 0 0.1 0.2 0.3 0.4 0.5 0 0.2 0.4 0.6 0.8 1.0 0 0.1 0.2 0.3 0.4 0.5 normalized height olivine chr.
Fig. 12 Porosity profiles through a two-layer olivine–chromite
cumulate pile evolving with time, normalized for height. The initial conditions are 20 m olivine and 2 m chromite cumulate, each with a porosity of 0.51, olivine has 3 mm and chromite 1.5 mm grain sizes. Note that the porosity profiles are self-similar until truncated at the compaction limit set to 0.02 (dashed line). Curve labels are time in years. Even after the bottom olivine layer reached its compaction limit (at 2 years), melt escaping from the further compacting chro-mite layer is able to bypass the olivine layer
Eq. (2) in Schmidt et al. (2012) and are −0.119 and 3.88, respectively.
The cumulate layers compact under their own weight and develop a characteristic porosity profile. The func-tional form of Eq. (15) causes all porosity profiles of singly compacting layers to be self-similar when normal-ized to unit height, independent of h, Δρ, grain size, fit constants or time (as long as the compaction limit is not reached). This is illustrated in Fig. 12, where the poros-ity profiles for the top olivine layer given by the curves at 0.1, 0.3 and 1 years are identical and those at longer compaction times are simply truncated in their lower part by the fact that porosity cannot decrease at infinitum, i.e., not below the compaction limit. Also note that in Fig. 13, the porosity profile of a singly compacting chromite layer given by the curve labeled “0” has an identical shape. In Fig. 12, the compaction limit was set to 0.02, a value characteristic for the fraction of frozen-in residual melt in such ultramafic layers (e.g., Tegner et al. 2009).
A two‑layer case
Figure 12 shows the porosities developing in a 2-layer case with initially 20 m olivine and 2 m chromite, both with an initial porosity (ϕ0) of 0.51. Grain sizes were chosen as 1.5 mm for chromite and 3 mm for olivine, in agreement with typical grain sizes observed in Bushveld’s critical zone. The bottom of the olivine layer compacts to a poros-ity of 0.035 within 1 year, reaches the compaction limit within 2 years, and within 10 years the bottom 80 % of the layer have also reached the compaction limit while the observable cumulate height is reduced to half of the initial value. These numbers reiterate that chemical compaction of olivine is fast on magmatic time scales (Schmidt et al.
2012), and by analogy most probably also for other mafic silicates (e.g., pyroxenes).
The chromite layer compacts under the additional weight of the olivine layer and hence much faster than in the single layer case described above. Within 1 year, this layer reaches a porosity of ~0.31, within 8 years of ~0.24 and within 30 years ~0.20. Such porosities are typically observed in, e.g., the UG2 and UG3 layers of the Bush-veld Complex (Mathez and Mey 2005; Mondal and Mathez
2007), and these compaction times are within characteris-tic cooling times of a mass of magma needed to crystallize such amounts of cumulate. Although there is quite some heterogeneity in natural chromite layers, their average porosities do not decrease below ~0.15. In the above two-layer case, ~250 years are necessary to reach this value.
Singly compacting layers versus multiple layers compacting together
Information whether a given layer compacts solely or within a sequence of layers in a cumulate pile can be derived from porosity profiles. In Fig. 13, such porosity profiles are calculated for an initially 2 m thick chromite layer as a function of the thickness of an overlying olivine layer (representative for any mafic silicate layer). In order to render these porosity profiles comparable, they are cal-culated for a time when the bottom of the chromite layer reaches ϕ = 0.20. As can be seen, a singly compacting chromite layer develops a porosity difference of almost 15 %, but already a few meter of overburden obliterate any measurable porosity difference within this layer, given that natural samples have a certain heterogeneity and that the palaeo-porosity of adcumulates cannot be determined better than ±0.01–0.02. Nevertheless, systematic poros-ity increases within, e.g., the UG2 and UG3 layers in the Bushveld Complex are not reported, indicating that these layers compacted with their overlying harzburgite and pyroxenite layers. 0 0.2 0.4 0.6 0.8 1.0 0.15 0.20 0.25 0.30 0.35 0.40 0 1 10 50 0.15 0.20 0.25 0.30 0.35 0.40 porosity normalized height
Fig. 13 Porosity profiles through an initially 2-m-thick chromite
layer normalized to unit height. The curves give porosity profiles as a function of overload (labels give the initial thickness of the overly‑ ing olivine layer), showing that in singly compacting chromite a rec-ognizable porosity gradient develops, while a few meter of overload annihilate any measurable gradient. To render the curves comparable, each is calculated such that the bottom of the layer reaches a porosity of 0.20