HAL Id: hal-02886900
https://hal.archives-ouvertes.fr/hal-02886900
Submitted on 27 Nov 2020
HAL is a multi-disciplinary open access
archive for the deposit and dissemination of
sci-entific research documents, whether they are
pub-lished or not. The documents may come from
teaching and research institutions in France or
abroad, or from public or private research centers.
L’archive ouverte pluridisciplinaire HAL, est
destinée au dépôt et à la diffusion de documents
scientifiques de niveau recherche, publiés ou non,
émanant des établissements d’enseignement et de
recherche français ou étrangers, des laboratoires
publics ou privés.
luminosity function, and star formation history of dusty
galaxies up to z � 6
C. Gruppioni, M. Bethermin, F. Loiacono, O. Le Févre, P. Capak, P. Cassata,
A.L. Faisst, D. Schaerer, J. Silverman, L. Yan, et al.
To cite this version:
C. Gruppioni, M. Bethermin, F. Loiacono, O. Le Févre, P. Capak, et al.. The ALPINE-ALMA [CII]
survey - The nature, luminosity function, and star formation history of dusty galaxies up to z � 6.
Astron.Astrophys., 2020, 643, pp.A8. �10.1051/0004-6361/202038487�. �hal-02886900�
https://doi.org/10.1051/0004-6361/202038487 c ESO 2020
Astronomy
&
Astrophysics
The ALPINE-ALMA [CII] survey
The nature, luminosity function, and star formation history of dusty
galaxies up to z
' 6
C. Gruppioni
1, M. Béthermin
2, F. Loiacono
3,1, O. Le Fèvre
2, P. Capak
4, P. Cassata
5,6, A. L. Faisst
4, D. Schaerer
7,
J. Silverman
8, L. Yan
9, S. Bardelli
1, M. Boquien
10, R. Carraro
11, A. Cimatti
3,12, M. Dessauges-Zavadsky
7,
M. Ginolfi
7, S. Fujimoto
13,14, N. P. Hathi
15, G. C. Jones
16,17, Y. Khusanova
2, A. M. Koekemoer
15, G. Lagache
2,
B. C. Lemaux
18, P. A. Oesch
7,13, F. Pozzi
3, D. A. Riechers
19,20, G. Rodighiero
5, M. Romano
5,6, M. Talia
1,3,
L. Vallini
21, D. Vergani
1, G. Zamorani
1, and E. Zucca
1(Affiliations can be found after the references) Received 25 May 2020/ Accepted 14 September 2020
ABSTRACT
Aims.We present the detailed characterisation of a sample of 56 sources serendipitously detected in ALMA band 7 as part of the ALMA Large Program to INvestigate CII at Early Times (ALPINE). These sources, detected in COSMOS and ECDFS, have been used to derive the total infrared luminosity function (LF) and to estimate the cosmic star formation rate density (SFRD) up to z ' 6.
Methods.We looked for counterparts of the ALMA sources in all the available multi-wavelength (from HST to VLA) and photometric redshift catalogues. We also made use of deeper UltraVISTA and Spitzer source lists and maps to identify optically dark sources with no matches in the public catalogues. We used the sources with estimated redshifts to derive the 250 µm rest-frame and total infrared (8–1000 µm) LFs from z ' 0.5 to 6.
Results.Our ALMA blind survey (860 µm flux density range: ∼0.3–12.5 mJy) allows us to further push the study of the nature and evolution of dusty galaxies at high-z, identifying luminous and massive sources to redshifts and faint luminosities never probed before by any far-infrared surveys. The ALPINE data are the first ones to sample the faint end of the infrared LF, showing little evolution from z ' 2.5 to z '6, and a “flat” slope up to the highest redshifts (i.e. 4.5 < z < 6). The SFRD obtained by integrating the luminosity function remains almost constant between z ' 2 and z ' 6, and significantly higher than the optical or ultra-violet derivations, showing a significant contribution of dusty galaxies and obscured star formation at high-z. About 14% of all the ALPINE serendipitous continuum sources are found to be optically and near-infrared (near-IR) dark (to a depth K s ∼ 24.9 mag). Six show a counterpart only in the mid-IR and no HST or near-IR identification, while two are detected as [C II] emitters at z ' 5. The six HST+near-IR dark galaxies with mid-IR counterparts are found to contribute about 17% of the total SFRD at z '5 and to dominate the high-mass end of the stellar mass function at z > 3.
Key words. galaxies: evolution – galaxies: high-redshift – galaxies: luminosity function, mass function – cosmology: observations –
submillimeter: galaxies
1. Introduction
Our current knowledge of the cosmic star formation rate den-sity (SFRD) at high redshift (z > 3) is based mostly on galaxy samples selected in the ultra-violet (UV) rest frame (e.g.
Bouwens et al. 2015 and Oesch et al. 2018), whose bolomet-ric star formation rates (SFRs) are not measured, but rather inferred through uncertain dust-correction techniques, and which are not necessarily representative of the whole galaxy population (e.g. missing strongly obscured massive systems with high dust content).
Since the discovery of the cosmic infrared background (CIB; representing the cumulative emission reprocessed by dust from all the galaxies throughout the cosmic history of the Universe; e.g.Lagache et al. 2005) at the end of the 1990s by the COBE satellite (Puget et al. 1996; Hauser et al. 1998), and its reso-lution into discrete, rapidly evolving, far-infrared (far-IR) and sub-millimetre (sub-mm) sources by deep extragalactic surveys performed with the Infrared Space Observatory (ISO) and the Submillimetre Common-User Bolometer Array (SCUBA) on the James Clerk Maxwell Telescope (JCMT), many searches have
focused on deriving how much star formation activity in the early Universe is obscured by dust. These dusty star-forming galaxies, also called “sub-millimetre galaxies” (SMGs; e.g. Smail et al. 1997 and Hughes et al. 1998; Barger et al. 1998; Blain et al. 2002), are characterised by large far-IR luminosities (&1012L )
and stellar masses (M & 7 × 10¹⁰M
; e.g. Chapman et al. 2005,Simpson et al. 2014), extremely high star formation rates (SFRs,&100 M yr−1; e.g.Swinbank et al. 2014), and large gas
reservoirs (&1010M
; e.g.Bothwell et al. 2013;Béthermin et al. 2015). Despite them being rare and luminous objects, typi-cally located around z ∼ 2–2.5 (e.g. Chapman et al. 2003;
Wardlow et al. 2011), their tremendous SFRs make them sub-stantial contributors to the SFRD at Cosmic Noon, that is, 1 < z < 3 (e.g. Casey et al. 2013). However, the fraction of dust-obscured star formation, which is traced by Spitzer and AKARI up to z ' 2 (e.g.Rodighiero et al. 2010,Goto et al. 2019), and by Herschelup to z ' 3 (e.g.Gruppioni et al. 2013,Magnelli et al. 2013), is still unknown at higher redshifts.
One of the problems is the difficulty in identifying the SMGs because of the coarse angular resolution of single-dish tele-scopes and the faintness of the optical/UV counterparts. The few
SMGs that have been identified at z > 4 trace only the bright tail of the SFR distribution (e.g.Capak et al. 2011;Walter et al. 2012;Riechers et al. 2011,2013,2017;Marrone et al. 2018) and are unlikely to represent the bulk of the population. Moreover, most of the SMGs have photometric or spectroscopic observa-tions that likely place them at z < 3 (Brisbin et al. 2017).
The Atacama Large Millimetre/submillimetre Array (ALMA) has now opened a gap in the wall, allowing us to refine our understanding of dusty galaxies at high redshifts by unveiling less extreme galaxies, between massive SMGs and normal star-forming galaxies, through superb sensitivity and high spatial resolution surveys in the sub-mm/mm domain. This can be achieved thanks to the recently explored ability of ALMA to reveal serendipitously detected galaxies in blind extragalactic surveys.
The ALMA deep surveys performed byDunlop et al.(2017),
Walter et al.(2016), andAravena et al.(2016), probing very faint fluxes over small areas (<5 arcmin2), as well as the wider
(cov-ering few tens of arcmin2) and shallower (to ∼0.2–0.7 mJy) sur-veys by Hatsukade et al.(2018) and Franco et al.(2018), have enabled us to uncover faint (sub-)mm populations at z >4, with infrared luminosities (LIR, between 8 and 1000 µm) .1012L
(e.g.Yamaguchi et al. 2019). An important product of these sur-veys is the discovery of a population of faint ALMA galaxies that are undetected even in the deepest optical and near-infrared (near-IR; i.e. '1–3 µm) images with the Hubble Space Telescope (HST). These “HST-dark” galaxies are often identified in the mid-infrared (mid-IR), in deep Spitzer-IRAC 3.6 or 4.5 µm images (e.g. Franco et al. 2018; Wang et al. 2019; Yamaguchi et al. 2019), although, despite them being unlikely spurious ALMA detections (e.g.Williams et al. 2019;Romano et al. 2020), some remain undetected even in IRAC maps.
Indeed, ALMA follow-up studies of “classical” SMGs (e.g.
Simpson et al. 2014;Dudzeviˇci¯ut˙e et al. 2020) have found that a fraction of these objects are invisible in deep optical/near-IR images; in particular, Dudzeviˇci¯ut˙e et al.(2020) found that
∼17% of the SCUBA-2 SMGs in the UKIDSS/UDS field
(AS2UDS survey) are undetected in the optical/near-IR down to K s = 25.7 mag. Already in the pre-ALMA studies there were cases of bright SMGs, such as the source GOODS 850-5 (also known as GN10), undetected in very deep optical/near-IR images (e.g.Wang et al. 2009), while the existence of dusty star-forming systems at z > 5 was already discussed byDey et al.
(1999) in the late 90s as a realistic expectation.
The HST-dark galaxies also tend to be serendipitously found in CO line scan surveys (see e.g.Riechers et al. 2020, who found two of them at z > 5), possibly with space densities higher than expected even at the bright end of the CO luminosity functions (LFs). These results indicate the existence of a prominent pop-ulation of dusty star-forming galaxies at z > 4, which is fainter than the confusion limit of the single-dish sub-mm surveys that discovered the SMGs, but with much larger space densities, pro-viding a significant contribution to the SFRD at high-z, even higher than that of the UV-bright galaxies at the same redshifts (e.g. Rodighiero et al. 2007; Williams et al. 2019; Wang et al. 2019).
Very faint ALMA fluxes were also reached by surveys of serendipitously detected sources in targeted observations (i.e. non-pure-blind surveys), which were able to constrain the faint end of the sub-mm/mm galaxy source counts, estimate their contribution to extragalactic background light, study their nature, and possibly detect dark galaxies (e.g.Hatsukade et al. 2013; Ono et al. 2014; Carniani et al. 2015; Oteo et al. 2016;
Fujimoto et al. 2016).
Here, we present the identification, multi-wavelength char-acterisation, and luminosity function of a sample of 56 sources, serendipitously detected in continuum at ∼860 and ∼1000 µm (ALMA band 7), within the ALMA Large Program to INvestigate CII at Early Times (ALPINE, PI: Le Fèvre; see
Le Fèvre et al. 2020;Faisst et al. 2020;Béthermin et al. 2020)1 survey fields. Firstly, ALPINE is a 70 h ALMA survey in band 7, specifically designed to measure singly ionised carbon ([C II] at 158 µm) emission and any associated far-IR continuum for 118 main-sequence galaxies at 4.4 < z < 5.9 (representative in stel-lar mass and SFR of the star-forming population at z ' 5; see
Le Fèvre et al. 2020;Faisst et al. 2020). The programme, com-pleted in February 2019, allows us to build a coherent picture of the baryon cycle in galaxies at z > 4 for the first time, by con-necting the internal ISM properties to their well-characterised stellar masses and SFRs (from a wealth of ancillary photomet-ric and spectroscopic data, which is already in hand). All the ALPINE pointings are located in the Extended Chandra Deep Field South (ECDFS; Giacconi et al. 2002) and Cosmic Evo-lution Survey (COSMOS;Scoville et al. 2007), thus benefitting from a wealth of ancillary multi-wavelength photometric data (from UV to far-IR), making ALPINE currently one of the largest panchromatic samples to study the physical properties of normal galaxies at high-z.
Besides the main targets, in the ALPINE pointings a blind search for serendipitous line and/or continuum emitters has been performed in a total area of 24.9 arcmin2providing two
indepen-dent catalogues of emission-line (Loiacono et al. 2020) and con-tinuum (Béthermin et al. 2020) detections. This work focuses on the continuum sample of serendipitous detections. For these sources, we performed identifications in all the catalogues and deep images available in the COSMOS and ECDFS fields. We also constructed spectral energy distributions (SEDs), estimated photometric redshifts when they were unavailable in the litera-ture, and derived the 250 µm rest-frame and total IR (8–1000 µm) luminosity functions and the contribution of dusty galaxies to the cosmic SFRD up to z ' 6.
The ALPINE sample of serendipitous continuum galaxies is briefly described in Sect.2, the identification process and results are presented in Sect.3, while the luminosity function results are discussed in Sect.4. In Sect.5, we derive the contribution of our sources to the cosmic SFRD, and in Sect.6we present our con-clusions. Throughout the paper, we use aChabrier(2003) stellar initial mass function (IMF) and adopt aΛCDM cosmology with H0= 70 km s−1Mpc−1,Ωm= 0.3, and ΩΛ= 0.7.
2. The ALPINE serendipitous continuum detections
The ALMA ALPINE observations were carried out in band 7 during Cycle 5 and Cycle 6, and were completed in February 2019. Each target was observed for ∼30 min of on-source inte-gration time, with the phase centre pointed at the UV position of the sources. One spectral window was centred on the [C II] expected frequencies, according to the spectroscopic redshifts extracted from the UV spectra, while the other side bands were used for continuum measurements only. The data were calibrated using the Common Astronomy Software Applications package (CASA; McMullin et al. 2007), version 5.4.0, and the contin-uum maps were obtained by collapsing the line-free channels in all the spectral windows (seeBéthermin et al. 2020).
The ALMA observational strategy/setup, the details of the data reduction and the method adopted to extract continuum flux
density information from ALPINE data and to select a com-plete sample of serendipitous sources, are comprehensively dis-cussed in Béthermin et al.(2020). In the following paragraphs we summarise the main steps. The data cubes were imaged using the tclean CASA routine down to a flux threshold of 3σ (σ being the standard deviation measured in a non-primary-beam-corrected map after masking the sources). A natural weighting of the visibilities was applied in order to maximise the point-source sensitivity and to optimise the measurement of the integrated properties of the ALPINE targets. The continuum maps were obtained by excluding the channels contaminated target source lines and those of a few off-centre, serendipitously detected con-tinuum sources with lines. In fact, in order to avoid possible contamination of the continuum flux by line flux, spectra were extracted for all the non-target sources and new tailored con-tinuum maps were produced by masking the potentially line-contaminated channels and then remeasuring the continuum flux (correction varying from 58% to a negligible fraction of the flux density).
The average synthesized beam size is 1.13 × 0.85 arcsec2
(size varies with frequency and array configuration, i.e. between 5.2 and 6 kpc at 4.4 < z < 6). The continuum sensitivity also varies with the frequency, and for this reason the continuum sources have been extracted on signal-to-noise ratio (S/N) maps, by searching for local maxima above a given threshold using the find_peak routine of astropy. As revealed from simulations shown inBéthermin et al.(2020), the threshold above which we obtain a purity of 95% corresponds to an S /N = 5 outside the central region of 1 arcsec radius (expected to contain the ALMA continuum flux of the ALPINE targets). The sources extracted in the 1 arcsec central regions are referred to as “target”, and the objects found outside of this area are referred to as “non-target”. In this paper, we focus only on the non-target sources.
The final sample of non-target sources detected in continuum at S /N > 5 in ALMA band 7 consists of 56 sources, of which three are in the ECDFS and 53 are in COSMOS, and which were extracted over a total area of 24.92 arcmin2(excluding the circle of 1 arcsec radius around the central ALPINE targets). The num-ber of expected spurious sources in this sample is ≤3, while the completeness is a function of the flux density and the size of each source (seeBéthermin et al. 2020), as discussed in Sect.4. One of the ECDFS sources has been detected in two different (slightly overlapping) ALPINE pointings, therefore it has a flux measure-ment in both channels, that is, 860 µm and 1000 µm. Details on the flux measurement and uncertainties are provided in
Béthermin et al.(2020).
3. The nature of the ALPINE serendipitous sources
We took advantage of the great wealth of multi-wavelength ancillary data, catalogues, spectroscopic and photometric red-shifts, and deep images that are available in the ALPINE fields (ECDFS and COSMOS; see e.g.Faisst et al. 2020) to investigate the nature of the serendipitous sources detected in continuum by ALMA.
The ground-based photometry available in the ECDFS includes U38, b, v, Rc, and I broad-band filters from the Wide Field Imager on the ESO/2.2-m telescope; U and R bands from VIMOS on the ESO VLT; near-IR filters J, H, and K s from ISAAC on the ESO VLT; J and K s data from WIRCam on the CFHT; and 14 intermediate-band filters from the Suprime-Cam on the Subaru telescope. In addition, a wealth of HST observa-tions are available in the ECDFS field.
The photometric data available in the COSMOS field include u-band observations from MegaCam on CFHT; B, V, r+, i+, z++, as well as 12 intermediate-band and two narrow-band fil-ters from the Suprime-Cam on Subaru; Y HS C-band from the Hyper Suprime-Cam on Subaru; as well as near-IR bands H and K s from WIRCam on CFHT; and Y, J, H, and K s from VIR-CAM on the ESO-VISTA telescope. In terms of HST data, all but one ALPINE pointing in COSMOS are covered by ACS F814W observations (Koekemoer et al. 2007;Scoville et al. 2007). This is also the case for CANDELS data in ACS and WFC3 bands (Grogin et al. 2011; Koekemoer et al. 2011) and several addi-tional pointings in ACS and WFC3 bands. The space-based pho-tometry in both fields includes Spitzer data in the four IRAC bands (3.6, 4.5, 5.8, and 8.0 µm) and in the MIPS 24 µm band, and Herschel data in the PACS (100 and 160 µm) and SPIRE bands (250, 350, and 500 µm). A detailed summary and refer-ences of the different ground- and space-based data available in the two fields are presented inFaisst et al.(2020).
In the identification process, we first matched the ALMA non-target list with the 3D-HST catalogues (Brammer et al. 2012;
Skelton et al. 2014;Momcheva et al. 2016) in both ECDFS and COSMOS, and with the COSMOS2015 (Laigle et al. 2016) in COSMOS. Then, for the COSMOS sources, we looked for coun-terparts in the super-deblended (Jin et al. 2018) and the DR4 UltraVISTA catalogues (McCracken et al. 2012; Moneti et al. 2019). Moreover, in COSMOS we considered the IRAC catalogue based on the Spitzer Large Area Survey with Hyper-Suprime-Cam data (SPLASH;Capak et al. 2012;Steinhardt et al. 2014)2. In the
following sections, we describe in detail the identification pro-cess of the ALPINE non-target continuum sources and the results obtained.
3.1. Source identification 3.1.1. Catalogue match
As a first step in the identification process of the ALPINE non-target sources, we cross-matched the ALMA list with the multi-wavelength catalogues available from the literature in COS-MOS and ECDFS. We found a counterpart within 1 arcsec of the source position for all three GOODS-S galaxies in the 3D-HST catalogue, and for 38 of the COSMOS sources in the
Laigle et al. (2016) catalogue. We then found one additional COSMOS source in the 3D-HST catalogue (three in total, but two in common withLaigle et al. 2016), while other three (39 in total, but 36 already in the COSMOS2015 catalogue) were identified with galaxies in the super-deblended catalogue (at λ ≥ 24 µm, as well as two also in the UltraVISTA DR4 catalogue) byJin et al.(2018), plus another three only with IRAC/SPLASH
objects (the fluxes were provided by M. Giulietti, priv. comm.). By running Monte Carlo random shifts of the COSMOS15 cat-alogue, we find an average number of spurious matches.2, at an average distance of ∼0.700 from the ALMA sources. Since the great majority of the positional offsets between the ALMA sources and the catalogue counterparts are <0.400, with just six sources with an offset in the range of 0.400–0.600, we can
con-sider that the false match rate is negligible. Moreover, as we discuss later, we visually inspected the ALMA contours over-plotted onto the images in all the available bands and for all the sources, in order to validate the match. We were therefore able
2 The SPLASH maps are available, upon request, athttp://splash.
to photometrically identify 48 sources out of 56 (3/3 in ECDFS and 45/53 in COSMOS), leaving us with a sample of eight galax-ies with no counterpart in any of the available catalogues. Of these eight sources, two were identified as line emitters in the blind-lines catalogue byLoiacono et al.(2020). Because the two serendipitously detected lines associated with unidentified con-tinuum sources are in the same side band as the [C II] 158 µm emission of the ALPINE targets in the same pointings, they are likely [C II] as well (see e.g. Jones et al. 2020; Romano et al. 2020). This provided us with a spectroscopic redshift estimate for two sources without any catalogue counterparts, leaving us with six sources with neither catalogue matches nor redshift estimates.
3.1.2. Image visual inspection
In a second step, we inspected the images – from UV to sub-mm and radio – at the position of the ALMA sources, find-ing a likely faint counterpart (i.e. below the threshold imposed by the catalogues, at 2.5–4.5σ) in the IRAC/SPLASH maps (at 4.5 µm) for two of the unidentified sources. By inspecting the images, we also found two sources for which the optical coun-terpart fromLaigle et al.(2016) – though within 1 arcsec from the ALMA position – was slightly offset and likely not the true identification. This is because at longer wavelengths (i.e. K s and IRAC bands) another source appeared at the exact position of the ALMA galaxy. For these sources, only the long wavelength photometric data (&2 µm, assumed to represent the true iden-tification) were considered for constructing the spectral energy distribution (SED).
In the end, the number of sources with no obvious iden-tification (either photometric nor spectroscopic) is four, which is more or less consistent with the number of expected spuri-ous detections estimated through inverted map analysis: 2.8+2.9−1.6 (see Béthermin et al. 2020). The S/Ns of these four unidenti-fied sources are 9.3, 6.7, 5.5, and 5.1: while the latter two are likely spurious detections, for the other two, this conclusion is not so obvious, since they were detected at a significantly high S/N. They could be dark galaxies with a mid-IR counterpart just below the detection threshold. To summarise, among the 56 con-tinuum sources, 44 were identified in the optical and/or near-IR (38 COSMOS2015, four 3D-HST, two UltraVISTA DR4), six only in the mid-IR (three SPLASH, one super-deblended, two IRAC images), two in [C II] line (with no photometric coun-terpart), and four remained unidentified (two of which could be spurious). The results of our identification process are sum-marised in Table1.
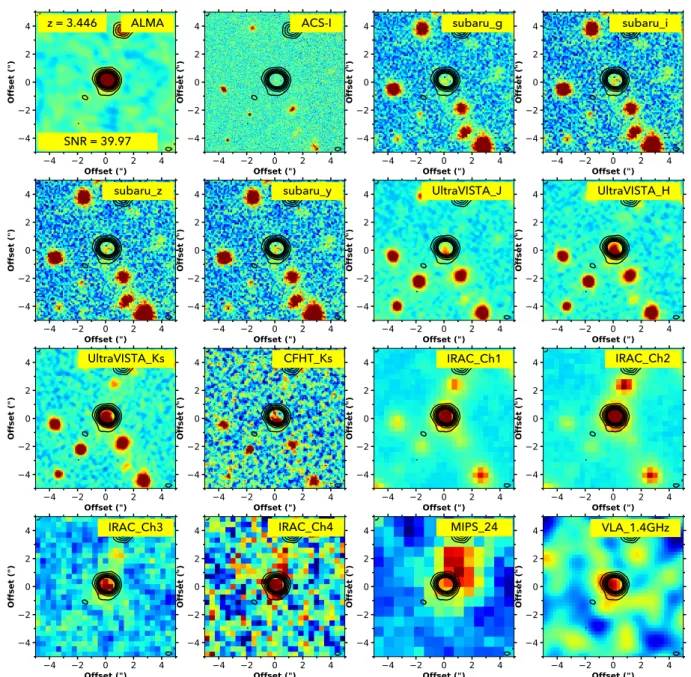
In Figs.1–4we show some examples of different cases
result-ing from the identification process of the ALPINE continuum non-target sources: from top left to bottom right, we plot the ALMA >3σ contours superimposed to the ALMA, HST/ACS-i (5σ = 27.5 mag in COSMOS;Koekemoer et al. 2007), Subaru (IA484(5σ)= 25.9 mag in COSMOS; Taniguchi et al. 2015), UltraVISTA (K s(5σ)= 24.9 mag in COSMOS;McCracken et al. 2012; Moneti et al. 2019), IRAC (S4.5(5σ)' 1.67 µJy in
COSMOS; Capak et al. 2012; Steinhardt et al. 2014), MIPS (S24(5σ) = 71 µJy in COSMOS; Le Floc’h et al. 2009), and
radio VLA-1.4 GHz images (5σ = 10.5 µJy in COSMOS;
Schinnerer et al. 2010). Figure 1 shows an object with multi-wavelength counterparts in all bands and photo-z from
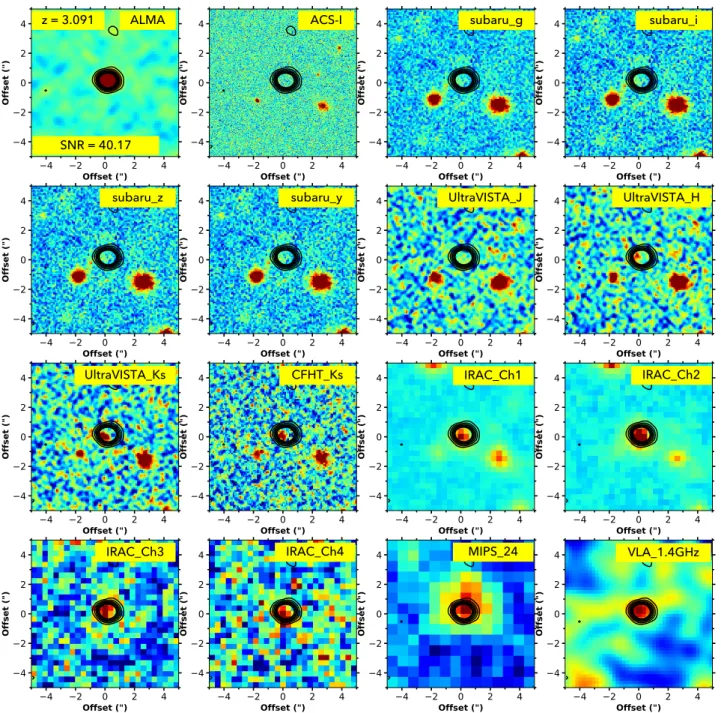
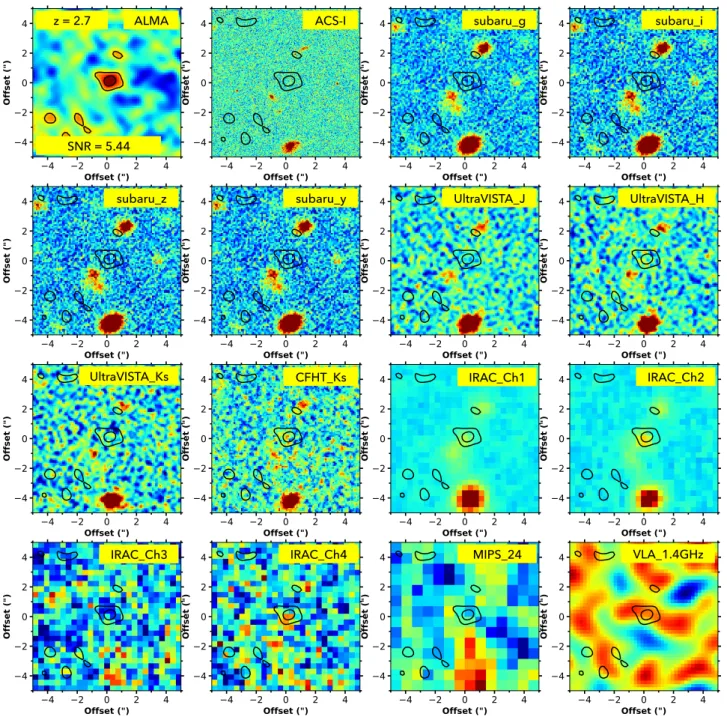
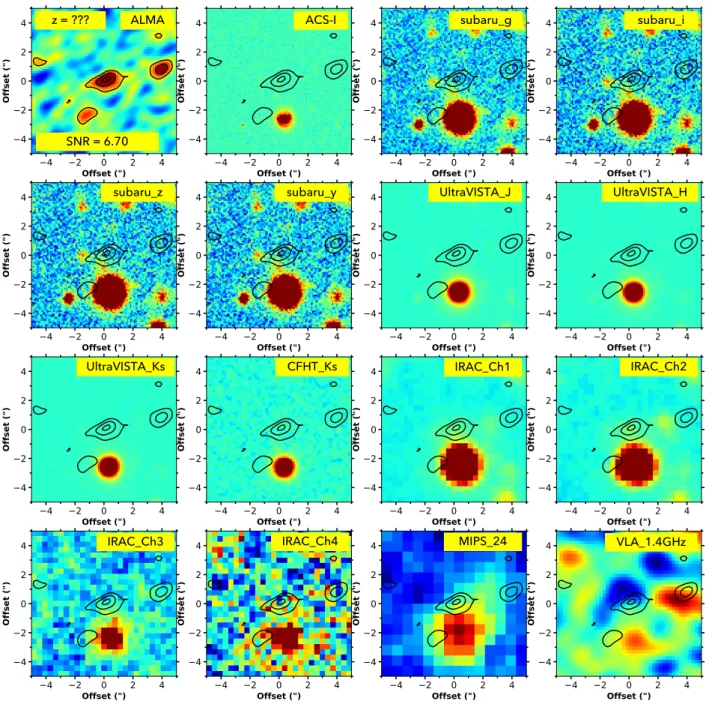
Laigle et al.(2016). Figure2shows an object with near-IR to sub-mm identification and photo-z. Figure3shows an optically +near-IR dark galaxy detected only in the SPLASH/IRAC-3.6/4.5 µm images. Figure4shows an unidentified source.
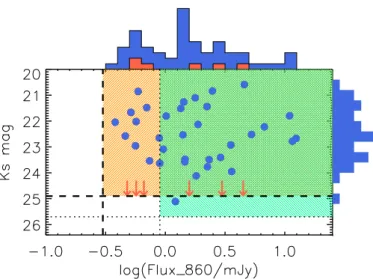
In Fig. 5, we show the K s magnitude versus 860 µm flux for the ALPINE sources with a K s-band counterpart; the arrows show the locus of the six sources identified only in the mid-IR (plotted at the 5σ limit of the UltraVISTA survey in COSMOS, i.e. K s = 24.9). The ALMA flux and Ks magnitude distribu-tion of our sample are shown on the top and right axes, respec-tively. We show the ALMA flux and K s-magnitude limits as ver-tical and horizontal dashed lines (limiting an orange coloured area), and, for comparison, those of the AS2UDS survey of SMGs (Dudzeviˇci¯ut˙e et al. 2020) as dotted lines (surrounding a green coloured area): while the 860 µm flux of our sample is significantly fainter than that of the AS2UDS survey, our K s-magnitude limit is shallower. Our HST+near-IR dark sources (shown in orange) span about the whole range in flux, but – by definition – are all below the K s-band limit (downward-pointing arrows). Only half of them are below the AS2UDS flux limit, the other three could also have been detected in that survey.
3.2. Spectral energy distributions and source properties Using all the available photometric data in COSMOS and ECDFS, we constructed the SEDs of all the ALPINE non-target sources with at least one photometric detection in addition to the ALMA one. In order to also obtain the complete mid- and far-IR coverage for our sources, the ALMA sample was cross-matched with the Spitzer and Herschel catalogues in both the ECDFS and COSMOS fields (i.e. the PACS Extragalactic Probe Sur-vey, PEP, Lutz et al. 2011, the Herschel-GOODS, H-GOODS,
Elbaz et al. 2011, the Herschel Multi-tiered Extragalactic Sur-vey, HerMES,Oliver et al. 2012, the super-deblended catalogue byJin et al. 2018). In the COSMOS15 and super-deblended cat-alogues, the Herschel fluxes are already reported: we chose the values from the super-deblended catalogue, when available. No additional Herschel matches for sources not identified in these two catalogues have been found. In H-GOODS, the Herschel fluxes were obtained from IRAC priors, thus source blending should not be an issue.
For two sources for which a faint counterpart (below the catalogue threshold) is detected only in the IRAC maps, we obtained a magnitude measurement by performing aperture pho-tometry directly on the images. We remind the reader that the depth of the IRAC/SPLASH observations in COSMOS is 1.67 µJy (5σ) at 4.5 µm. Thus, for two sources we obtained IRAC flux densities at 3.6 and 4.5 µm (S4.5' 1.25 and 1.61 µJy,
corresponding to ∼3.7 and 4.8σ). For six sources (two with just a line identification and no photometric counterparts and four with no counterpart at all – two of which are likely spurious detec-tions), we could not construct any SEDs.
3.2.1. SED fitting
We made use of all the available multi-wavelength informa-tion (either detecinforma-tions or upper limits) to fit the SEDs of our sources using the L
e
Phare
software (i.e.,Arnouts et al. 2002;Ilbert et al. 2006), which performs an χ2 fit to the data by con-sidering different templates. We considered the semi-empirical template library of Polletta et al. (2007), representative of dif-ferent classes of IR galaxies and AGN, to which we added some templates modified in their far-IR part to better repro-duce the observed Herschel data (see Gruppioni et al. 2010,
2013), and three starburst templates from Rieke et al. (2009). The final set of templates (32 in total) included SEDs of different
Table 1. Summary of continuum source identification.
Redshift Photometry
TOT COSMOS2015 3D-HST(a) UVDR4 SPLASH Super-deblended Ad-hoc IRAC No ID
TOT 56 38 3+ 1 (3 + 3)(b) 2 (26)(c) 3 (42) 1 (39) 2 6
Catalogue 38 33 4 0 0 1 0 0
L
e
Phare
9 2 0 2 3 0 2 0[C II] 5 3 0 0 0 0 0 2
No z 4 0 0 0 0 0 0 4
Notes.(a)ECDFS+COSMOS.(b)Values outside parentheses are the “new” identifications not included in other catalogues, while those in
parenthe-ses are the total number of sources identified in that catalogue, some of which are already included in other catalogues: for example, COSMOS2015.
(c)Twenty-four of the 26 galaxies found in the new UltraVISTA DR4 catalogue are also in COSMOS2015, while two are in the super-deblended
list.
z = 3.446 ALMA
SNR = 39.97
ACS-I subaru_g subaru_i
subaru_z subaru_y VLA_1.4GHz MIPS_24 IRAC_Ch1 CFHT_Ks UltraVISTA_J UltraVISTA_H UltraVISTA_Ks IRAC_Ch3 IRAC_Ch2 IRAC_Ch4
Fig. 1.Example of identification of ALPINE non-target continuum source: the postage stamps (from top left to bottom right) show the ALMA band 7 continuum map and the ALMA ≥ 3σ contours over-plotted on images from HST/ACS-i to radio VLA-1.4 GHz (band specified in the top-right corner). Object with multi-wavelength counterparts in all bands and photo-z fromLaigle et al.(2016). The plotted contour levels are at 3, 5, 7, 9, 11, 13, and 15σ, corresponding to 0.32, 0.53, 0.74, 0.95, 1.16, 1.37, and 1.58 mJy. The ALMA 1-mm flux density of this source (SC_1_DEIMOS_COSMOS_910650) is 4.22 mJy, the RMS (1σ) of this pointing is ∼0.11 mJy.
z = 3.091 ALMA
SNR = 40.17
ACS-I subaru_g subaru_i
subaru_z subaru_y VLA_1.4GHz MIPS_24 IRAC_Ch1 CFHT_Ks UltraVISTA_J UltraVISTA_H UltraVISTA_Ks IRAC_Ch3 IRAC_Ch2 IRAC_Ch4
Fig. 2.Object with no optical counterpart, but with multi-wavelength counterparts from near-IR to sub-mm and photo-z (fromLaigle et al. 2016). The plotted contour levels are at 3, 5, 7, 9, 11, 13, and 15σ, corresponding to 0.26, 0.44, 0.62, 0.79, 0.97, 1.15, and 1.32 mJy. The ALMA 860 µm flux density of this source (SC_1_DEIMOS_COSMOS_680104) is 3.54 mJy, the RMS (1σ) of this pointing ∼0.088 mJy.
types of galaxies, from ellipticals to starbursts, and AGN and composite ultra-luminous infrared galaxies (ULIRGs; contain-ing both AGN and star-formcontain-ing galaxies) in the rest-frame wave-length interval, 0.1–1000 µm. We allowed the code to apply dif-ferent extinction values (E(B − V) from 0.0 to 5) and extinction curves to the templates in order to improve the fit. This increased the real number of possible templates. When performing the fit, the redshifts were fixed to the spectroscopic or photometric val-ues from the literature, or from [C II] line detection, when avail-able. In most cases, we found good consistency between the photo-z from the literature and the best fit SED obtained with our SED fitting by fixing the redshift at that value. For the six sources with only a mid-IR counterpart, we attempted a photo-z estimate with L
e
Phare
, obtaining values of zIRphotin the 2.2–6 range (with an average value zdark =3.5; see Sect.3.3). In orderto obtain a better determination of the total IR luminosity, we simultaneously fitted only the rest frame’s 8–1000 µm range with additional far-IR template libraries included in L
e
Phare
(e.g.Chary & Elbaz 2001;Dale & Helou 2002;Lagache et al. 2004;
Rieke et al. 2009;Siebenmorgen & Krügel 2007). We thus best fitted the far-IR bump rather than constraining the whole SED from UV to mm (where optical/near-IR data always dominate the χ2, because of their smaller errors than those affecting the
longer wavelength bands).
For most of the continuum non-target ALPINE galaxies we could obtain a good fit to all the data points and a SED estimate: the majority (75%) are best reproduced by star-forming galaxy templates (though 55% of them are composite, i.e. star-forming galaxies containing an obscured or low-luminosity AGN), while the remaining 25% are fitted by type 1 or 2 AGN templates. We
z = 2.7 ALMA
SNR = 5.44
ACS-I subaru_g subaru_i
subaru_z subaru_y VLA_1.4GHz MIPS_24 IRAC_Ch1 CFHT_Ks UltraVISTA_J UltraVISTA_H UltraVISTA_Ks IRAC_Ch3 IRAC_Ch2 IRAC_Ch4
Fig. 3.Optically dark galaxy detected only in deep IRAC-SPLASH 4.5 µm catalogue. The photo-z has been derived with L
e
Phare
using ALMA and IRAC data only. The plotted contour levels are at 3, 5σ, corresponding to 0.14, 0.23 mJy. The ALMA 1 mm flux density of this source (SC_1_DEIMOS_COSMOS_224751) is 0.25 mJy, the RMS (1σ) of this pointing is ∼0.046 mJy.checked for signal by stacking on the X-ray images (Chandra) at the positions of the AGN and non-AGN samples, but measured no significant signal for either of the samples. Although, for the AGN-SED sources, a 1.5σ positive signal was detected, against a negative signal for the non-AGN SEDs. We stress that for the six sources detected only in the mid-IR (i.e. IRAC bands), the SED type and redshift are very uncertain, and the relative results have to be taken only as indications.
In Fig.6, we show some examples of the observed SEDs and their best fitting templates obtained from our analysis. The redshift distribution of the whole sample, including the spec-troscopic and photometric redshifts from the literature, those from [C II] detection, and those obtained with L
e
Phare
for the sources not in the COSMOS2015, super-deblended, or 3D-HST catalogues, is shown in Fig.7. The five redshifts from [C II] arein a different colour, since we treated those sources separately in the LF analysis because (being at the same redshifts of the ALPINE targets at the centre of the ALMA pointing) they might be part of an overdensity, or in any case associated to the target. Indeed, at z ' 4.57, a massive proto-cluster of galaxies located in the COSMOS field has been identified byLemaux et al.(2018), therefore some of our [C II] emitters might be part of it. Con-sidering them as blindly detected sources might bias the LF cal-culation (see Loiacono et al. 2020). These possible effects are discussed in Sect.4.3.
3.2.2. Redshifts
In the paper byBéthermin et al.(2020), the redshift distribution is presented and discussed only for the “secure” identifications,
z = ??? ALMA
SNR = 6.70
ACS-I subaru_g subaru_i
subaru_z subaru_y VLA_1.4GHz MIPS_24 IRAC_Ch1 CFHT_Ks UltraVISTA_J UltraVISTA_H UltraVISTA_Ks IRAC_Ch3 IRAC_Ch2 IRAC_Ch4
Fig. 4.ALPINE serendipitous source with no obvious identification in any bands. The plotted contour levels are at 3, 5, and 6.5σ, corresponding to 0.47, 0.79, and 1.02 mJy. The ALMA 1 mm flux density of this source (SC_1_DEIMOS_COSMOS_471063) is 1.06 mJy, the RMS (1σ) of this pointing is ∼0.16 mJy.
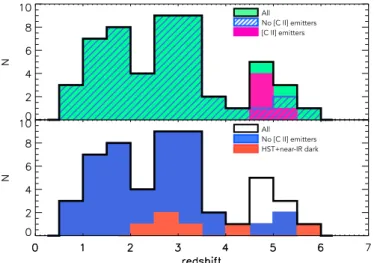
that is, the 38 sources with a counterpart in the catalogues. In this work, we used all the redshifts, including the more uncer-tain ones, considering a total of 52 out of 56 sources. The red-shift distribution obtained for the whole sample of 52 sources is shown in Fig. 7 (green-filled and empty black histogram in the top and bottom panels, respectively). We note that the total redshift distribution has a broad peak in the z ' 1.5–3.5 range (with a low-significance dip at z ∼ 2), followed by a secondary peak at z ∼ 5. The secondary peak at z '5 is partially due to the sources “associated” with the ALPINE targets (i.e. with a line in the same ALMA side band; deep-pink histogram in the top panel), although it is also occupied by sources apparently not related to the targets.
The median redshift of the total distribution is zmed' 2.84 ±
0.18 (zmed ' 2.53 ± 0.17 if we exclude the sources at the same
zof the targets; blue-dashed and blue-filled distribution in the
upper and lower panel, respectively), which is similar to that found byFranco et al.(2018) in a 2–3× larger (69 arcmin2) and
shallower (to 0.7 mJy) ALMA survey at 1.1 mm in GOODS-S (zmed' 2.9), although the number of blindly detected objects in
our ALPINE pointings is larger (56 compared to 20). The size of our continuum survey is similar to that of the ALMA twenty-six arcmin2Survey of GOODS-S at One-millimeter (ASAGAO; Hatsukade et al. 2018), which is 26 arcmin2, although our num-ber of detections is more than double (i.e. we detect 56 sources above 5σ compared to 25 in ASAGAO). However, we must note that our sources are selected in two different side bands, and the 1.1 mm one goes about a factor of 1.5–2 deeper than the ASAGAO survey at the same wavelength.
In panel b of Fig. 8, the redshift distribution of the 47 identified sources of our sample (excluding the [C II] emit-ters) is compared to those from other ALMA surveys, such as
Fig. 5.Distribution of observed K s-band magnitude and 860 µm ALMA fluxes of ALPINE serendipitous continuum sources with a K s counter-part. The horizontal dashed line shows the UltraVISTA K s-band 5σ limit of 24.9, while the vertical one shows the minimum 860 µm (5σ) flux density reached by the ALMA sample (the orange coloured area shows the region covered by our data). For comparison, the dotted lines (green filled area) indicate the K s magnitude and 870 µm flux limits of the AS2UDS sample of SMGs reported byDudzeviˇci¯ut˙e et al.(2020). The downward-pointing arrows shown at the K s-band limit are the six sources detected only at mid-IR wavelengths. The histograms show the K s-band magnitude distribution on the right axis, and the 860 µm flux density distribution is on the top axis of the plot (orange histogram showing the fluxes of the mid-IR detected sources).
GOODS-ALMA, ASAGAO, the ALMA Spectroscopic Survey in the Hubble Ultra Deep Field (ASPECS;Aravena et al. 2016,
2020) and AS2UDS. While the ASPECS distribution (magenta) peaks at lower redshift, and the GOODS-ALMA (red) at slightly higher redshift than ours (blue filled), we notice that the ALPINE continuum survey peaks at redshifts similar to those of the ASAGAO (green dashed) and AS2UDS (orange dashed) sur-veys. However, the secondary peak at z ∼ 5 of our distribution does not seem to be present in the other two. We refer the reader toBéthermin et al.(2020) for a more detailed discussion about the redshift distribution of the ALPINE continuum non-target sources and the comparison with other ALMA survey works. 3.2.3. Total IR luminosity
We derived the total IR luminosities (LIR = L[8–1000 µm]) for
all the ALPINE sources with at least one detection in addition to the ALMA one, that is, for 50 galaxies (47+3 [C II] emitters). In order to obtain the total IR luminosities, we integrate the best fit SED of each source over the range 8 ≤ λrest ≤ 1000 µm. This
integration for most of our sources has been performed on well constrained SEDs covered by data in several bands (see Fig.6), while for few sources an extrapolation of the SED with no data constraining the far-IR peak was required (thus reflecting in large uncertainties in LIR). In Fig.8, we show the distribution of the
860 µm flux density of all the 56 ALMA continuum serendipi-tous detections (panel a), and the redshift (panel b), LIR (panel
c) and stellar mass (panel d) distributions of the 47 sources with spectroscopic or photometric redshift measurements not asso-ciated with the ALPINE targets (i.e. blue histogram in Fig.7), compared to other samples from the literature. The total IR lumi-nosity distribution of our sources (blue) peaks at LIR ' 1012L ,
similarly to ASAGAO (green;Hatsukade et al. 2018), although we cover a larger range, from ∼1011–1013L
. The ASPECS
sur-vey (Aravena et al. 2020) peaks at significantly fainter luminosi-ties (LIR' 3 × 10¹¹L ), while the AS2UDS (Dudzeviˇci¯ut˙e et al. 2020) at brighter ones (LIR ' 4 × 10¹²L ). This is a direct
con-sequence of the combination of the flux (panel a) and redshift (panel b) histograms. The AS2UDS survey, though covering the same redshift range of ALPINE, extends to and peaks at much larger fluxes, while the ASPECS survey covers much fainter fluxes and lower redshifts, resulting in fainter luminosities. Also, ASAGAO seems to sample fainter fluxes than ALPINE, but similar redshifts (though it misses a low-z peak present in our distribution), while their LIR are similar to ours (with a
nar-rower distribution, but similar peak). The similar luminosity dis-tribution derived from similar redshifts but fainter fluxes might appear puzzling: however, we must note that the flux densities reported in panel a of Fig. 8 are at different wavelengths, as made clear in the legend, and are therefore not directly compara-ble. This means that the 860/870 µm fluxes would correspond to about a factor of ∼2–3 fainter values if translated to 1.1/1.2 mm. Indeed, our 1 mm channel (here, all the ALPINE flux densities are converted to 860 µm for simplicity) reaches fluxes 1.5–2× fainter than ASAGAO. This could likely reconcile our results with the ASAGAO ones.
3.2.4. Stellar mass
We used the Le P
hare
code and theBruzual & Charlot(2003) libraries to estimate the stellar masses of our sources. We stress that the stellar masses derived for the HST and near-IR dark galaxies are extremely uncertain, given the few photometric points available (although we made use of all the 3σ upper limits to constrain the masses). Therefore, we can only take the results as an indication. In panel d of Fig. 8, we show the mass distribution of our sources (blue) compared to those from GOODS-ALMA (red), ASAGAO (green), ASPECS (magenta) and AS2UDS (orange). We find that our galaxies are mas-sive (our mass distribution extends up to masses as high as 2.5 × 10¹¹M ; see also Fig.9), but slightly less extreme thanthose detected byFranco et al.(2018) and byDudzeviˇci¯ut˙e et al.
(2020). In fact, the median stellar mass of our distribution is M∗ = (4.1 ± 0.7) × 1010M
, while for GOODS-ALMA is
1.1 × 10¹¹M and for AS2UDS (1.26 ± 0.05) × 1011M . The
stellar mass distribution of the ASPECS sample is similar to ours, both in peak position and mass coverage. The ASAGAO masses have been derived by Yamaguchi et al. (2020) with MAGPHYS (da Cunha et al. 2008) and also byStraatman et al.
(2016) in the FourStar galaxy evolution survey (ZFOURGE) using FAST (Kriek et al. 2009). In the figure we plot the latter ones, which are well consistent with ours (while the MAGPHYS masses are significantly higher by&0.2–0.5 dex, as also noted by
Yamaguchi et al. 2020).
3.3. Optically and near-IR dark galaxies
As mentioned in the previous section, of the 56 galaxies detected in our main catalogue, 12 (21%) do not present any obvious HST or near-IR (UltraVISTA, to K s ' 24.9; see
McCracken et al. 2012, DR4; Moneti et al. 2019) counterparts. Six of these sources have been identified in the IRAC 3.6 or 4.5 µm bands (one also in the MIPS 24 µm and Herschel bands), while six have no photometric counterpart at all. Two of these unidentified sources have been detected as line (likely [C II]) emitters by Loiacono et al. (2020), while four remain
z=2.85
Wavelength [μm] 104 102 100 10-2 Fl ux [μ Jy ]z=3.43
Fl ux [μ Jy ] z=1.23 STARB z=3.08 AGN2 1 10 100 1000 1 10 100 1000 104 102 100 10-2 0.1 1 10 100 1000 z=3.45 STARB z=2.90 SF-AGN z=2.53 STARB z=3.01 AGN2Fig. 6.Example of observed SEDs of ALPINE continuum non-target sources with an identification and a photo-z in the available catalogues. The observed SEDs have been fitted with L
e
Phare
by fixing the redshift at the catalogue value: the best fit template to all the data is shown in black, while the template best reproducing the IR data (i.e. from 8 to 1000 µm rest frame, used to derive LIR) is shown in red.All No [C II] emitters [C II] emitters All No [C II] emitters HST+near-IR dark
Fig. 7.Redshift distribution of ALPINE non-target sources detected in continuum with an identification (green-filled black histogram in the top panel, empty in the bottom panel). Top panel: the deep-pink his-togram shows the five sources detected in [C II] at the same redshift of the ALPINE central targets, while the blue-dashed histogram shows the redshifts of the 47 sources considered for the unbiased LF calcu-lation (i.e. excluding the five [C II] emitters). Bottom panel: the latter distribution is shown in blue, while the best fit photometric redshifts of the six HST+near-IR dark galaxies are shown as a red and orange-filled histogram.
unidentified (compatible with the number of expected spurious sources based on simulations, though two are at significantly high S/N; see Béthermin et al. 2020). If we exclude the four sources without identification, we end up with a '14% frac-tion of HST+near-IR dark galaxies among the ALPINE non-target continuum detections (six with a mid-IR counterpart + two [C II] emitters). The observed SEDs of the six dark galaxies with an IRAC (or far-IR) counterpart, and their best fit template found by L
e
Phare
, are shown in Fig.10. Their photometric redshifts are in the 2.23–5.85 range, with an average value of zdark ' 3.5 ± 0.5. We stress again that the estimated redshiftsfor five of these sources are extremely uncertain (while for the reminder the photo-z is better constrained by the available IRAC, MIPS and Herschel data); the width of the probability distribu-tion funcdistribu-tion (PDF) can be as large as ∼1–1.5. Moreover, with few photometric data, the best fitting solutions can degenerate in the photo-z/AVspace (i.e.Caputi et al. 2012). However, in our
case the ALMA detection and the absence of optical and near-IR counterparts come to our aid, as they ruled out the low-z solu-tions and better constrained the photometric redshift.
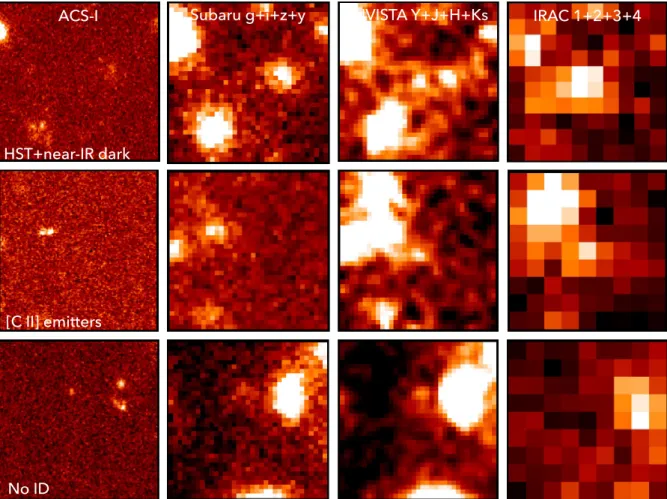
In order to check whether we can detect and eventually mea-sure an average flux in the optical and near-IR bands for these dark sources, we performed stacking at their positions in the HST-ACS band and in all four Subaru, Ultra-VISTA, and IRAC bands. We note that in the Subaru, Ultra-VISTA, and IRAC bands, we co-added images at different wavelengths. We thus applied average corrections to the fluxes when required (i.e. we multiplied the 200aperture photometry value of the IRAC stacked flux by a factor 1.22). In fact, the aim of our stacking analy-sis was not to measure accurate values, but just to validate our conclusions by detecting and estimating an average flux density for the ALPINE galaxies undetected in the optical and near-IR. In Fig.11, we show the results of our stacking analysis for the six HST+near-IR dark galaxies (top row) in the ACS-I, Sub-aru (g+ i + z + y), UltraVISTA (Y + J + H + Ks), and IRAC (ch1+ ch2 + ch3 + ch4) bands (from left to right, respectively). We compared to the results obtained for the two [C II] emitters without any counterparts (middle row) and for the four uniden-tified sources (bottom row). A positive signal comes up clearly in the UltraVISTA and IRAC bands for the six HST+near-IR dark galaxies, providing an average flux of ∼(1.21 ± 0.03) and (1.7 ± 0.3) µJy, respectively. In the ACS and Subaru images, we detect only the background. The images co-added at the posi-tions of the two [C II] emitters without counterparts show a faint signal only in the UltraVISTA bands, and maybe in the IRAC ones, but nothing in the ACS and Subaru bands. The four uniden-tified galaxies do not show any signal in the stacked images, at any wavelengths. In a future paper (Gruppioni et al., in prep.), we intend to investigate and discuss in more detail the nature
(a) (b) (c) (d)
Fig. 8.Distribution of 860 µm flux density of all 56 ALMA continuum serendipitous detections (a), redshift (b), total IR luminosity (c), and stellar mass distribution (d) of the 47 sources with measured redshift that were not associated with the ALPINE targets (i.e. blue histogram in Fig.7). The four distributions are compared with previous results from the literature, either from blind ALMA surveys like GOODS-ALMA, ASAGAO, and ASPECS (Franco et al. 2018;Hatsukade et al. 2018;Aravena et al. 2020, respectively), or from ALMA surveys of pre-selected SMGs such as the AS2UDS (i.e.Dudzeviˇci¯ut˙e et al. 2020; the AS2UDS distributions have been rescaled, i.e. divided by 100, for comparison purposes). The ASAGAO masses are from Table 1 ofYamaguchi et al.(2020): the plotted values are the ZFOURGE ones (those derived with MAGPHYS are significantly higher). The different colours and shadings of the histograms associated with each survey are shown in the legend. The yellow histograms show the distribution of the six HST+near-IR dark galaxies. We note that the flux densities reported in panel a from different surveys are at different wavelengths, therefore not directly comparable, meaning the 860/870 µm fluxes would correspond to about a factor of ∼2 fainter values if translated to 1.1/1.2 mm.
log (Stellar Mass \ M
¤ ) ALPINE ALPINE [C II] ALPINE HST-dark 2 4 6 8 10 12 redshift N 12.0 11.5 11.0 10.5 10.0 9.5 9.0
Fig. 9.Stellar mass versus redshift (le f t) and stellar mass histogram (right) for ALPINE continuum non-target detections. The black filled circles and blue filled histogram show the distribution of the whole sam-ple, while the orange circles and histogram show the locus occupied by the HST+near-IR dark sources. The cyan open squares and dashed-histogram show, for comparison, the locus of the sources identified with [C II] emitters at the same redshift of the ALPINE targets (we note that the two without photometric counterparts are missing, since for them a mass estimate was impossible).
and average properties of the ALPINE optical and near-IR dark sources (detected both in continuum and [C II]).
Previous studies have found faint ALMA galaxies com-pletely missed at optical and near-IR wavelengths (Franco et al. 2018; Wang et al. 2019; Yamaguchi et al. 2019), even in the deepest surveys in GOODS. The fraction of HST-dark sources discovered in the GOODS-ALMA survey by Franco et al.
(2018) is 20% of their sample, which is similar to the frac-tion found for the ASAGAO survey byYamaguchi et al.(2019), and similar to the fraction that we find in our sample if we consider all the sources not detected in the HST and near-IR bands (∼21%). However, if we exclude the four sources with-out any counterparts, but keep the two sources with [C II] lines, we find a more realistic percentage of 14%. If we also exclude the two [C II] emitters, likely associated with the ALPINE tar-gets, we find a conservative percentage of 11% of serendipitous HST+near-IR dark galaxies in our sample. However, for a fair comparison, we must note that the HST-dark galaxies found by
zphot=3.43 STARB logLIR=12.3±0.2 zphot=2.23 SF-AGN logLIR=12.8±0.1 zphot=4.08 SF-GAL logLIR=11.9±0.3 zphot=5.85 STARB logLIR=12.3±0.2 zphot=2.67 SF-AGN logLIR=11.7±0.3 zphot=2.85 STARB logLIR=11.8±0.2 0.1 1 10 100 1000 Wavelength [μm] 1 10 100 1000 Wavelength [μm] 1 10 100 1000 0 1 10 100 1000 104 102 100 10-2 0.1 1 10 100 1000 104 102 100 10-2 104 102 100 10-2 0.1 1 10 100 1000 Flux [ μJy ] Flux [ μJy ] Flux [ μJy ]
Fig. 10.Observed SEDs for HST+near-IR-dark galaxies, with their
ten-tative best fitting templates (black for the broad-band SED and red for the far-IR SED, as in Fig.6) and photometric redshifts found with L
e
Phare
. For all but one source, the fits are based only on the IRAC and ALMA data points, combined with the 3σ UV, optical, near- and far-IR 3σ upper limits.Franco et al. (2018) are undetected in GOODS-S, whose pho-tometry is deeper than in COSMOS. Therefore, some of our HST-galaxies could have been detected in optical or near-IR images as deep as the ones covering the GOODS-S field. Indeed, this would further reduce our fraction of HST-dark sources, increasing the difference with the previous results. For a more direct comparison of the results, in Table2 we report the size and depth of ALPINE, GOODS-ALMA, and ASAGAO.
ACS-I Subaru g+i+z+y
HST+near-IR dark
UVISTA Y+J+H+Ks IRAC 1+2+3+4
[C II] emitters
No ID
Fig. 11.Stacked images (10 arcmin size) resulting from co-addition of ACS-I, Subaru g+ i + z + y, Ultra-VISTA Y + J + H + Ks, and IRAC ch1+ ch2 + ch3 + ch4 bands (from left to right, respectively) at the positions of the six HST+near-IR dark galaxies (top), of the two [C II] emitters without photometric counterparts (middle), and of the four unidentified sources (bottom).
Table 2. ALMA selected HST-dark sources.
Survey Area Slim(5σ) λ Ntot %dark
(arcmin2) (mJy) (µm) (%)
(1) (2) (3) (4) (5) (6) ALPINE 24.9 0.3 860 56 11(21)(a)
GOODS-ALMA 69 0.70 1100 20 20 ASAGAO 26 0.2 1200 25 20
Notes.(a)The value in parentheses is the maximum (unrealistic)
percent-age obtained by considering all the sources unidentified in the optical and near-IR, including the likely spurious ones.
While the depth and size of the GOODS-ALMA survey are different to ours (it is about 2.5× the size and 2–3× shallower), the ASAGAO survey is similar to ALPINE, both in size and sen-sitivity. However, our detections are either at 860 or 1000 µm, while the two mentioned surveys in GOODS-S are at 1100– 1200 µm. A similar depth but in two different selection bands, in a range where the galaxy SEDs are steep, makes our survey about 2× deeper than the ASAGAO survey. Given all these fac-tors (ALPINE deeper in ALMA, but shallower in the counter-part identification), we would have expected to find a larger frac-tion of galaxies undetected in the HST and/or UltraVISTA bands in ALPINE (COSMOS) than in GOODS-ALMA or ASAGAO. However, we must note that, considering the shot noise, the uncertainties in equivalence of detection and matching
method-ology, the data quality and depth in various bands, we cannot take this as a really significant difference.
The stellar masses estimated for the HST+near-IR dark galaxies in our sample (shown in orange in Fig.9and as a yellow histogram in panel d of Fig.8) span about an order of magnitude in stellar mass, from 1.1 × 10¹⁰ to 9.5 × 10¹⁰M
, and are not
necessarily the most massive of the sample. For the purpose of the luminosity function calculation, we considered the HST-dark galaxies, although with large uncertainties in their redshifts and 8–1000 µm integrated luminosities (accounted for in our simula-tions).
4. Luminosity function
The size and depth of our sample allow us to derive the far-IR LF in more than one redshift bin, spanning from z ' 0.5 up to z ∼ 6. Because of the redshift range covered by our continuum sample, we would need to make significant wavelength extrapolations when computing the rest-frame LFs at any chosen wavelength. In order to apply the smallest extrapolations for the majority of our sources, we chose to derive the far-IR LF at the rest-frame wavelength corresponding to the median redshift of the sample (∼3): we therefore derive the rest-frame LF at 250 µm. Given the excellent multi-wavelength coverage of our fields, the SEDs of most of our sources are very well determined from the UV to the sub-mm. The extrapolations are therefore well constrained by accurately defined SEDs, even at redshifts lower and higher than
the median value. However, there are few sources for which the photometric redshift is based only on the ALMA and one or two mid-IR fluxes, therefore the redshift itself is very uncertain and the SED not well sampled. The extrapolation for these sources is thus not very accurate and the luminosity is derived with a high level of indeterminateness (i.e. it may vary by a factor of 2–3). We took into account these uncertainties in the error bars associated with the LF values (as discussed in detail in Sect.4.3). 4.1. Method
We derived the LFs using the 1/Vmax method (Schmidt 1968).
This method is non-parametric and does not require any assump-tions on the LF shape, but derives the LF directly from the data. In order to derive the monochromatic and total IR LFs, we used all the sources with a spectroscopic or photometric redshift, with the exception of two sources (SC_1_DEIMOS_COSMOS_787780, SC_1_vuds_cosmos_5101210235) that were also excluded from the continuum number counts byBéthermin et al.(2020) because their flux density was found to be boosted by an emission line (CO(7-6) at z = 1.28 and [C II] at z = 4.51, respectively). At z ' 5, we computed (and compared) two different LFs by either excluding or including the three [C II] emitters with optical/near-IR identification likely associated with the ALPINE targets. In the case of the former, we used 46 sources (out of 47, one was excluded because it was boosted by a CO line), and for the latter we used 48 (two [C II] emitters could not be used because they had no counterpart, one was excluded because it was boosted by the line). We divided the sample into five different redshift bins (over the 0.5 . z . 6 range), which we selected to be similarly pop-ulated. In each redshift bin, we computed the co-moving volume available to each source belonging to that bin, defined as Vmax,i= Z zmax zmin Ωeff,i dV dΩdzdz= V(zmax,i) − V(zmin,i), (1) where zmax is the minimum between the maximum redshift at
which a source would still be included in the sample – given the limiting flux of the survey – and the upper boundary of the con-sidered redshift bin. Analogously, zminis the maximum between
the minimum redshift above which the source will be detected in the survey and the lower boundary of the redshift bin. The quantity dV/(dΩdz) is the co-moving volume element per unit solid angle and unit redshift, whileΩeff,i is the effective area of
the i-th galaxy and depends on both the flux density (i.e. the total area covered by the survey, 24.92 arcmin2, at bright fluxes, since
only the brightest sources can be detected when distant from the centre of the pointing) and the size of each source (e.g. com-pact sources show better completeness than extended ones at a given flux density). We note that to calculate the areal coverage of the serendipitous detections, we excluded the 1 arcsec central area where the target source was extracted. The effective area is derived from the completeness Compl(S850,θi,xi, yi) at the
posi-tion (xi,yi) of the i-th source:
Ωeff,i(S850, θi)=
X
pointings
Z Z
Compl(S850, θi, xi, yi) dΩ, (2)
where the sum is over the 118 pointings. The completenesses were derived through accurate simulations by Béthermin et al.
(2020). Their Fig. 8 shows the effective area as a function of the 850 µm flux for different source sizes.
For each luminosity and redshift bin, the LF is given by φ(L, z) = ∆ log L1 X
i
1 Vmax,i
× incompl(z), (3)
where ∆ log L is the size of the logarithmic luminosity bin, incompl(z) is the correction for redshift incompleteness (i.e. sources without redshift), and Vmax,iis the maximum co-moving
volume over which the i-th galaxy could be observed given its luminosity and redshift (Equation 1). We adopted incompl(z)= 1 for z ≤ 6, under the assumption that the unidentified sources are all at z > 6 or spurious. In any case, whether or not we con-sider the redshift incompleteness (e.g. assuming that the three unidentified sources are at z > 3) will not affect our conclusions. Uncertainties in the infrared LF values depend on the number of sources in the luminosity bin (i.e. Poissonian error) and on the photometric redshift uncertainties. In particular, significant errors on the redshift estimate can shift a low redshift galaxy to higher redshifts and vice versa, thus modifying the number density of sources in a given redshift bin. To study the impact of these uncertainties on the inferred IR LF, we performed Monte Carlo simulations, as described in Sect.4.3.
4.2. The rest-frame 250µm luminosity function
Following the method described above, we derived the 250 µm LF of the ALMA ALPINE sources. We divided the sample into five redshift bins: 0.5 < z ≤ 1.5, 1.5 < z ≤ 2.5, 2.5 < z ≤ 3.5, 3.5 < z ≤ 4.5, and 4.5 < z ≤ 6. We considered luminosity bins of 0.5 dex, covering the whole luminosity range by overlap-ping by 0.25 dex. In this way, the luminosity bins are not sta-tistically independent (they are “alternately” independent), but we can better observe the “shape” of the LF and the position of the sources within the bin (e.g. if the bin is uniformly popu-lated or the sources are grouped at the edge of a bin). To study the possible bias introduced by the sources with spectroscopic redshifts (from [C II] 158 µm line emission) very close to that of the ALPINE targets, we derived two LFs at 4.5 < z < 6: one by excluding and another by including the two [C II] emit-ters with identification from/in the calculation. The comparison between the two LFs (excluding and including the two sources) is presented and discussed only in Sect.4.3, in order to avoid repetitions.
The results of the computation of our rest-frame 250 µm LFs are reported in Table3; the errors were computed through Monte Carlo simulations in order to study the impact of redshift uncer-tainties on the LFs. We refer the reader to the next section for a detailed description of the simulation. Given the area covered by our survey and the number of independent pointings, the contribution due to cosmic variance (fromDriver & Robotham 2010) is always negligible with respect to the uncertainties due to photo-z and luminosity.
Our 250 µm LFs are shown in Fig. 12. The completeness limits, shown as vertical dotted lines, were computed by con-sidering the nominal 860 µm limiting flux of our survey, that is, 0.3 mJy (seeBéthermin et al. 2020), and the template, among those of the library reproducing our SEDs, which provided the brightest luminosity at the redshift of the bin. For comparison, we over-plotted previous results from the literature at 250 µm, specifically the LFs derived by Koprowski et al. (2017) from the SCUBA-2 S2CLS survey and byLapi et al.(2011) from the Herschel-ATLAS survey.
In the common redshift intervals, our data are almost com-plementary to the literature data, mostly covering the faint end of the LFs (below the knee), while LF data from both
Koprowski et al.(2017) andLapi et al. (2011) cover the bright end (above the knee). In three of the four redshift intervals in common withKoprowski et al.(2017) (i.e. 0.5–1.5, 1.5–2.5, and
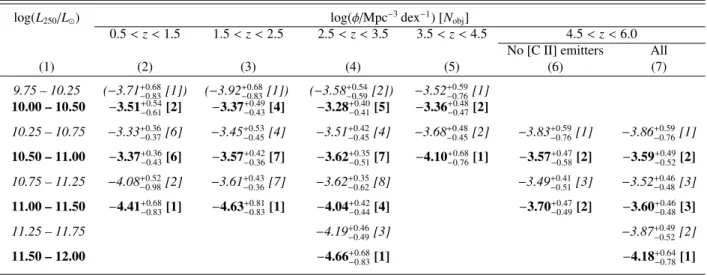
Table 3. ALPINE rest-frame 250 µm LF.
log(L250/L ) log(φ/Mpc−3dex−1) [Nobj]
0.5 < z < 1.5 1.5 < z < 2.5 2.5 < z < 3.5 3.5 < z < 4.5 4.5 < z < 6.0 No [C II] emitters All
(1) (2) (3) (4) (5) (6) (7) 9.75 – 10.25 (−3.71+0.68−0.83[1]) (−3.92+0.68−0.83[1]) (−3.58+0.54−0.59[2]) −3.52+0.59−0.76[1] 10.00 – 10.50 −3.51+0.54−0.61[2] −3.37+0.49−0.43[4] −3.28+0.40−0.41[5] −3.36+0.48−0.47[2] 10.25 – 10.75 −3.33+0.36−0.37[6] −3.45+0.53−0.45[4] −3.51+0.42−0.45[4] −3.68+0.48−0.45[2] −3.83+0.59−0.76[1] −3.86+0.59−0.76[1] 10.50 – 11.00 −3.37+0.36−0.43[6] −3.57+0.42−0.36[7] −3.62+0.35−0.51[7] −4.10+0.68−0.76[1] −3.57+0.47−0.58[2] −3.59+0.49−0.52[2] 10.75 – 11.25 −4.08+0.52−0.98[2] −3.61+0.43−0.36[7] −3.62+0.35−0.62[8] −3.49+0.41−0.51[3] −3.52+0.46−0.48[3] 11.00 – 11.50 −4.41+0.68−0.83[1] −4.63+0.81−0.83[1] −4.04+0.42−0.44[4] −3.70+0.47−0.49[2] −3.60+0.46−0.48[3] 11.25 – 11.75 −4.19+0.46−0.49[3] −3.87+0.49−0.52[2] 11.50 – 12.00 −4.66+0.68−0.83[1] −4.18+0.64−0.78[1]
Notes. Values in parentheses correspond to luminosity bins that might be affected by incompleteness due to survey limits. The bold (or alternatively italic) fonts denote independent luminosity bins.
3.5–4.5), in the very limited common range of luminosity our 250 µm LFs are consistent with the SCUBA-2 one around the knee (at z = 2.5–3.5, our knee is at brighter luminosities). Our LFs at the faint end are flatter than the extrapolation of the
Koprowski et al. (2017) fit at low z, consistent at z ∼ 3, and higher at z ∼4. In fact, in the higher redshift bin in common (3.5 < z < 4.5), our data, which reach an order of magnitude fainter luminosities, are slightly higher than the faint-L extrapo-lation of their Schechter fit. We note thatKoprowski et al.(2017) can constrain the Schechter curve with data (fromDunlop et al. 2017) at L250µm < 1011L only in the 1.5 < z < 2.5 redshift
interval.
Given the error bars of our LFs, in the overlapping redshift range (i.e. at z < 3.5) we are fully consistent with the Herschel LFs byLapi et al.(2011), although only our highest luminosity bin is in common with their faintest one. However, in the redshift bin where our redshift distribution peaks and our data cover a wider luminosity range (i.e. 2.5 < z < 3.5), our LF is higher than the S2CLS one at bright luminosities (e.g. at L250 > 1011L ),
while it shows good agreement with the Lapi et al. (2011) H-ATLAS derivation (although it is almost complementary and was calculated in somewhat different redshift bins). Both our LFs and the Herschel ones indicate a more prominent bright end (i.e. more luminous sources) than derived from SCUBA-2. The con-sistency between our 250 µm LFs and theLapi et al.(2011) ones (derived from a different sample and instrument, using a differ-ent template SED to fit the data and a far-IR based method to derive photometric redshifts) gives us confidence that, at least in the common redshift intervals, the photo-z uncertainties do not significantly affect our computation.
On the other hand, the underestimated bright end by the
Koprowski et al. (2017) S2CLS LF had previously been noted byGruppioni & Pozzi(2019) regarding the total IR LF (obtained with the same SCUBA-2 data used for the 250 µm derivation) at z = 2–3, and likely ascribed to the use of different template SEDs (i.e. they considered a low temperature SED, T ' 35 K) to compute the 8–1000 µm luminosity as well as to incomplete-ness issues. A similar difference is now also observed with our monochromatic derivation at similar redshifts, although these are the redshifts at which our data are less affected by SED
extrapo-lations. Therefore, it is likely that incompleteness issue in S2CLS data are the principal cause of the observed discrepancy.
At z > 4.5 no comparison data from the literature are avail-able, with our derivation providing the first ever determination of the luminosity and density distribution of dusty galaxies at such high redshifts. What is really surprising is that, even excluding the two sources at the same redshifts of the ALPINE targets, and despite the large uncertainties, at 4.5 < z < 6 there are no hints of a significant decrease in the volume density of dusty galax-ies (i.e. in the LF normalisation) with respect to the epoch com-monly considered to have experienced major galaxy activity (i.e. cosmic noon, z ∼ 1–3). A comparison between the LFs obtained with and without the two sources is shown in the next section for the total IR LF.
4.3. The total infrared luminosity function
In order to derive the total IR luminosities (and LFs), we inte-grated the best fit SED of each source over the 8 ≤ λrest ≤
1000 µm (LIR = L[8–1000 µm]) range. This integration for most
of our sources was performed on well-constrained SEDs covered by data in several bands (see Fig.6), while for a few sources, an extrapolation of the SED with no data constraining the far-IR peak was required (thus reflecting large uncertainties in LIR).
We computed the total IR LFs in the same redshift bins consid-ered for the monochromatic LFs at 250 µm (i.e. 0.5 < z < 1.5, 1.5 < z < 2.5, 2.5 < z < 3.5, 3.5 < z < 4.5, and 4.5 < z < 6), and we used the same method (1/Vmax) described in the previous
section.
As already mentioned, we studied the impact of redshift uncertainties on the total IR LFs by performing a set of Monte Carlo simulations. We iterated the computation of the monochro-matic and total IR LFs 100 times, each time varying the photo-metric redshift of each source (i.e. assigning a randomly selected value, according to the probability density function, PDF, asso-ciated with each redshift). Each time, we then recomputed the monochromatic and total IR luminosities, as well as the Vmax,
but keeping the previously found best fitting template for each object (i.e. we did not perform the SED fitting again, since the effect of the k-correction is not significant in the sub-mm wavelength range). For the total uncertainty in each luminosity
Fig. 12.Rest-frame 250 µm LF estimated with 1/Vmaxmethod from ALPINE continuum sample (green boxes and black filled circles). The
lumi-nosity bins have a width of 0.5 dex in L250 µm, and step through the luminosity range in stages of 0.25 dex. For this reason, the individual bins are
not statistically independent. The error bars in the data points represent the uncertainties obtained from the simulations (as described in Sect.4.3). The deep-pink triangles and dashed curves are the SCUBA-2 250 µm LFs byKoprowski et al.(2017), while the blue filled squares are the Herschel ATLAS 250 µm LFs byLapi et al.(2011), the latter being in slightly different redshift intervals. The vertical dotted line shows the completeness limit of our continuum survey, estimated as described in the text by considering the nominal 860 µm limiting flux of 0.3 mJy (Béthermin et al. 2020).
bin, we assumed the larger dispersion between that provided by the Monte Carlo simulations and the Poissonian one (following
Gehrels 1986), although the effect of the photometric redshift uncertainty on the error bars is larger than the simple Poissonian value in the majority of cases.
The values of our ALPINE total IR LFs in each redshift and luminosity bin, with their total uncertainties, are reported in Table4. The alternately independent luminosity bins are shown in italics and bold face, as in Table3.
4.3.1. Comparison with previous results from the literature In Fig.13, the total IR LFs obtained from the ALPINE sample are shown and compared with other derivations available in the literature at similar redshifts. The Herschel (e.g.Gruppioni et al. 2013), SCUBA-2 (e.g.Koprowski et al. 2017), and ALMA (e.g.
Hatsukade et al. 2018) LFs are reported in the common or simi-lar redshift ranges.
We stress that this is the first total IR LF derivation reaching such faint luminosities and high redshifts: thanks to ALMA and
the depth reached by the ALPINE survey, we are finally able to sample IR luminosities typical of “normal” (i.e., main-sequence) forming galaxies, rather than only those of extreme star-bursts. We are therefore able to shape the LFs over a large luminosity range, by joining the ALMA data to the somewhat complementary Herschel and SCUBA-2 ones, at least up to z ' 4. Globally, data from different surveys and wavelengths agree relatively well over the common z-range (up to z. 4–4.5): despite the large redshift and SED extrapolation uncertainties, the total IR LF derived from the ALPINE data is in broad agree-ment with those obtained in previous works. No continuum sur-vey data are available for comparison at z > 4.5, since our IR LF is the first at such high redshifts. We can only compare our data with line LFs at those redshifts.
We observe a difference with previous data in the lower red-shift bin, 0.5–1.5, where both the Herschel and SCUBA-2 LFs are higher at the faint end and lower at the bright end, with their knee occurring at slightly fainter LIR. Indeed, the low-LIR
dis-crepancy (i.e. at <1011.5L
) with Herschel is mostly determined