transcription factor binding modalities
The MIT Faculty has made this article openly available. Please share
how this access benefits you. Your story matters.
Citation
Kang, Daniel et al. “DNase-Capture Reveals Differential
Transcription Factor Binding Modalities.” Edited by Deyou Zheng.
PLOS ONE 12, 12 (December 2017): e0187046 © 2017 Kang et al
As Published
http://dx.doi.org/10.1371/journal.pone.0187046
Publisher
Public Library of Science
Version
Final published version
Citable link
http://hdl.handle.net/1721.1/113253
Terms of Use
Creative Commons Attribution 4.0 International License
RESEARCH ARTICLE
DNase-capture reveals differential
transcription factor binding modalities
Daniel Kang1☯, Richard Sherwood2☯
, Amira Barkal2, Tatsunori Hashimoto1,
Logan Engstrom1, David Gifford1*
1 Computer Science and Artificial Intelligence Laboratory, Massachusetts Institute of Technology, Cambridge, Massachusetts, United States of America, 2 Division of Genetics, Department of Medicine, Brigham and Women’s Hospital and Harvard Medical School, Boston, Massachusetts, United States of America
☯These authors contributed equally to this work. *[email protected]
Abstract
We describe capture, an assay that increases the analytical resolution of DNase-seq by focusing its DNase-sequencing phase on selected genomic regions. We introduce a new method to compensate for capture bias called BaseNormal that allows for accurate recovery of transcription factor protection profiles from DNase-capture data. We show that these nor-malized data allow for nuanced detection of transcription factor binding heterogeneity with as few as dozens of sites.
Introduction
DNase-seq is a genomic technique that profiles chromatin accessibility. In DNase-seq, intact nuclei are exposed to the DNase I enzyme. The DNase I enzyme is sterically hindered by com-pacted chromatin, tightly wound histones, and bound transcription factors and thus produces DNA cuts primarily in the accessible genome. These DNase I cuts result in a pool of molecules that represents the accessible part of the genome that is then sequenced [1]. The resulting DNase-seq data have been used to identify active portions of the genome [1], prioritize genomic variants from genome wide association studies [2], and estimate the transcription factor occupancy of the genome in a single experiment [3,4]. However, DNase-seq is limited by the current cost of sequencing, resulting in inadequate read counts and thus incomplete biological discovery.
Here we introduce DNase-capture, a method that focuses DNase-seq analysis on selected genomic regions, resulting in a substantial increase in region-specific sequencing coverage. The consequential increased analytical resolution allows for the nuanced detection of tran-scription factor binding modes that are associated with differences in the bound genomic sequences. We also introduce BaseNormal, a base-pair resolution approach to normalization that corrects biases from DNase-capture data. Previously, Stergachis et al. [5] introduced a DNase-capture approach without normalization.
Results and discussion
DNase-capture extends DNase-seq using an analog of an exome capture protocol [6]. In DNase-capture, a DNase-seq library is mixed with biotin-tagged bait RNA sequences that are
a1111111111 a1111111111 a1111111111 a1111111111 a1111111111 OPEN ACCESS
Citation: Kang D, Sherwood R, Barkal A,
Hashimoto T, Engstrom L, Gifford D (2017) DNase-capture reveals differential transcription factor binding modalities. PLoS ONE 12(12): e0187046.https://doi.org/10.1371/journal. pone.0187046
Editor: Deyou Zheng, Yeshiva University Albert
Einstein College of Medicine, UNITED STATES
Received: March 2, 2017 Accepted: October 12, 2017 Published: December 28, 2017
Copyright:© 2017 Kang et al. This is an open access article distributed under the terms of the
Creative Commons Attribution License, which permits unrestricted use, distribution, and reproduction in any medium, provided the original author and source are credited.
Data Availability Statement: Data is available from
Gene Expression Omnibus with accession numbers GSE53776, GSM912896, GSM912908, and GSE106217. All other relevant data are within the paper and its Supporting Information files.
Funding: This work was funded by the NIH
National Human Genome Institute,
1U01HG007037 (https://www.genome.gov/). The funders had no role in study design, data collection and analysis, decision to publish, or preparation of the manuscript.
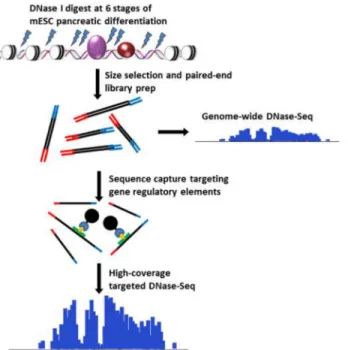
complementary to regions of interest. In a hybridization reaction, target DNA is captured away from background DNA through streptavidin bead binding, and the captured target DNA is sequenced (Fig 1). To determine whether capture can increase the resolution of DNase-seq, we designed a DNase-capture bait library targeting 91 genomic loci spanning 300 kb of geno-mic space and using 18,000 bait probes. We definetiling density as the number of baits that
overlap each base in a design, and thus at a 2X tiling density each base is covered by two dis-tinct baits. Because the transcription factor CTCF is known to leave a strong, spatially stereo-typed DNase I footprint when bound [7], we tiled baits at fifty 1 kb regions centered on known CTCF binding sites. The fifty regions were tiled at densities of 2X, 3X, 4X, 6X, and 8X (10 loci were tiled at each density) to determine if tiling density affects capture strength or fidelity. We additionally tiled at 3X density 41 genomic loci encompassing regulatory regions near genes with dynamic expression during mouse embryonic stem cell (mESC) differentiation. Baits in highly repetitive regions were eliminated to prevent non-specific capture. We then performed hybrid capture on previously sequenced DNase-seq libraries from mESC [3].
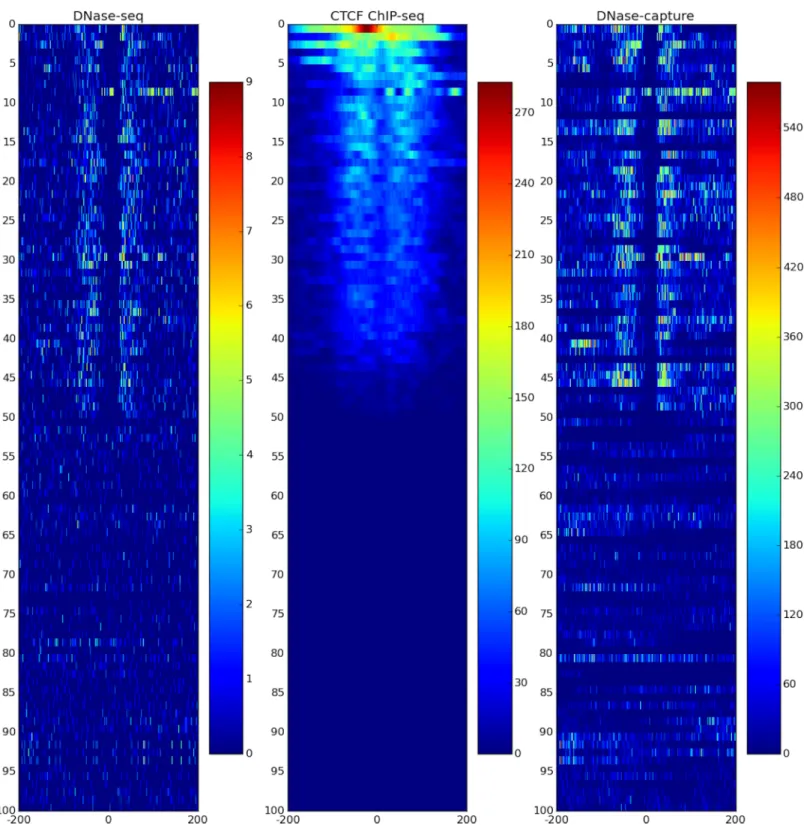
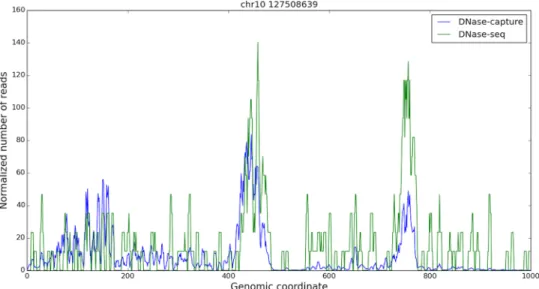
DNase-capture substantially and consistently improves sequencing coverage of targeted regions, with over a 145-fold enrichment in read counts compared to experiments without enrichment with the same overall sequencing depth. DNase-capture consistently shows more reads per base on targeted regions compared to regular DNase-seq (Fig 2). We hypothesized that the increased coverage of DNase-capture would allow for qualitative improvements in observed DNase accessibility profiles [3]. To test our hypothesis, we examined the difference in data from capture regions that had CTCF binding events and motifs as a positive set and CTCF motifs with no binding events as a negative set to ensure DNase-capture did not intro-duce artifacts. We observed that stereotypical CTCF DNase accessibility profiles containing a center footprint underlying the motif and flanking regions of increased hypersensitivity are significantly better defined in the DNase-capture data at individual binding site instances than in the DNase-seq data (Fig 3). Lines 4, 34, 44, and 45 in particular inFig 3represent such foot-prints. The observed DNase-capture signal is largely concordant with regular DNase-seq signal in matched regions (Fig 4,Fig 5).
Fig 1. DNase-capture protocol. This figure shows the stages of the DNase-capture protocol.
https://doi.org/10.1371/journal.pone.0187046.g001
Competing interests: The authors have declared
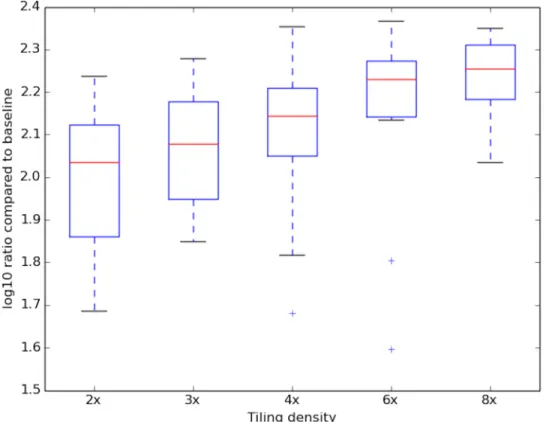
With the improved resolution of DNase-capture data comes coverage bias that must be computationally normalized for proper analysis. Coverage bias results from different effective tiling densities at different genomic regions, the elimination of certain bait sequences for lack of specificity, and bait-specific capture bias. The effect of tiling density on observed DNase-capture read count is shown inFig 6. Since DNase-seq analysis depends upon base-pair resolu-tion DNase profiles, existing segmentaresolu-tion-based capture normalizaresolu-tion techniques developed for copy number variation and SNP detection [8,9] are insufficient. Existing normalization methods for exome capture [8,9] divide the genome into discrete segments that are indepen-dently normalized and applying such methods would introduce artifacts when DNase-seq pro-files overlap a segment boundary.
BaseNormal is a base-pair resolution approach to normalization that corrects DNase I cut bias [10,11], missing bait bias, tiling density bias, genomic cut-rate bias, and read tower bias. Read towers result from a small number of bases that have abnormally high DNase-capture read counts. We perform base-level correction in four steps. First, BaseNormal uses linear Fig 2. DNase-capture has more reads per base. Reads per base, excluding bases with no reads, for the forward reads. The x- and y-axes are in log 10 scale. The DNase-capture reads were truncated at 1000 reads for visualization purposes. Reads from all tiling densities were aggregated in this plot.
https://doi.org/10.1371/journal.pone.0187046.g002
Fig 3. DNase-capture clarifies CTCF DNase profiles. DNase-seq (left), DNase-capture (right), and CTCF ChIP-seq data (center) CTCF motif hits ranked by the number of CTCF ChIP-seq reads in the region. Many DNase-capture profiles are clearer than their DNase-seq counterparts. The bottom half shows CTCF motif matches, but are not called by GEM. The data pre-correction was used here. The legend in the figure shows the motif hit counts scale, with dark red representing more hits, and dark blue representing fewer hits. Note that the footprints represented in lines 4, 34, 44, and 45 are significantly better defined in the DNase-capture data than in the DNase-seq data.
Fig 4. DNase-seq and DNase-capture appear concordant. A one kilobase capture region in chromosome 10, starting at base 127508639. The reads are smoothed in a 5bp window, and only the forward reads are shown for visualization purpose. The DNase-capture reads counts were scaled so they could be shown on the same plot as the DNase-seq reads. The data pre-correction was used here.
https://doi.org/10.1371/journal.pone.0187046.g004
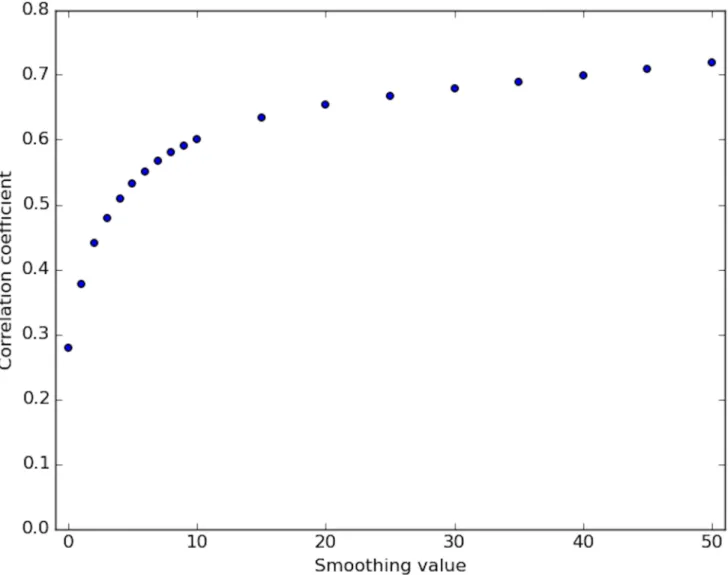
Fig 5. Correlation of DNase-capture and DNase-seq. Correlation coefficient values of the DNase-capture vs the DNase-seq data at various smoothing window sizes in the selected genomic loci. Data pre-normalization was used.
https://doi.org/10.1371/journal.pone.0187046.g005
regression with DNase-capture reads as the independent variable and DNase-seq reads as the dependent variable. The predicted values from the linear regression represent bias con-trolled estimates for accessibility. The linear regression is performed on (1) DNase-capture reads +/- 15bp of the base to be predicted, and (2) genomic DNase-capture reads +/- 15bp of the base to be predicted (the genomic DNase-capture reads are used to control for bait affinity). Fig 6. Increased tiling density produces more coverage. Log enrichment of the DNase-capture reads at a given tiling density compared to the number of DNase-seq reads over the same regions. Data
pre-normalization data was used.
https://doi.org/10.1371/journal.pone.0187046.g006
Fig 7. Reduction of two-mer bias in DNase-seq data. Histogram of the median centered two-mer bias of the regular DNase-seq and the correction, after applying the 6-mer correction. The left panel is the DNase-seq data and the right panel is the DNase-capture data. 2-mer bias is reduced after the correction.
We use a truncation indicator based on the genomic DNase-capture reads to control for read tower biases. The truncation indicator is set for any base where the number of genomic capture reads were above the 95th percentile of the genomic capture reads. Second, we correct for DNase-I cut bias [10,11] by normalizing the number of reads at each 6-mer to the average num-ber of reads starting at the same 6-mer in a prior naked DNase-I digestion experiment [11]. The effects of correcting for sequence bias on the DNase-cut frequency for various dinucleotides are shown (Fig 7). We hypothesize that the substantial increase in sequencing coverage increased bias reduction in DNase-capture data in the capture regions. Third, since certain highly repeti-tive baits were not synthesized, bases within +/- 10bp of these baits were not considered in the regression. Fourth, to account for regions with different tiling densities, BaseNormal performs a region-by-region adjustment of the average DNase-capture reads per base, adjusting them to be proportional to the average reads per base from a non-capture DNase-seq experiment. This nor-malization adjusts all of the read counts in a given region identically. The corrected DNase-cap-ture signal is largely concordant with the regular DNase-seq signal (Fig 8,Fig 9).
We posited that if we clustered the profiles of accessibility data around a factor’s binding site we would discover distinct classes of DNase profiles that reflect distinct binding modes for certain factors. To explore this idea, we identified CTCF binding sites in the capture regions from mouse ChIP-seq datasets using GEM [12]. We excluded binding events without strong motifs so that binding sites could be aligned at the base pair level, and we excluded events within 200bp of a capture region edge. Each binding site was identified with a transcription factor specific DNase-capture profile, and we trained a Bernoulli naïve Bayes classifier on the Fig 8. Corrected DNase-capture and DNase-seq appear concordant. A one kilobase capture region in chromosome 10, starting at base 127508639. The reads are smoothed in a 5bp window, and only the forward reads are shown for visualization purpose. The DNase-capture reads counts were scaled so they could be shown on the same plot as the DNase-seq reads. Data normalization was used here.
https://doi.org/10.1371/journal.pone.0187046.g008
individual bases surrounding a binding site to predict the DNase-capture profile cluster of each binding event. We measured the classifier’s performance by area under the receiver oper-ating curve (AUROC) using leave-one-out cross validation.
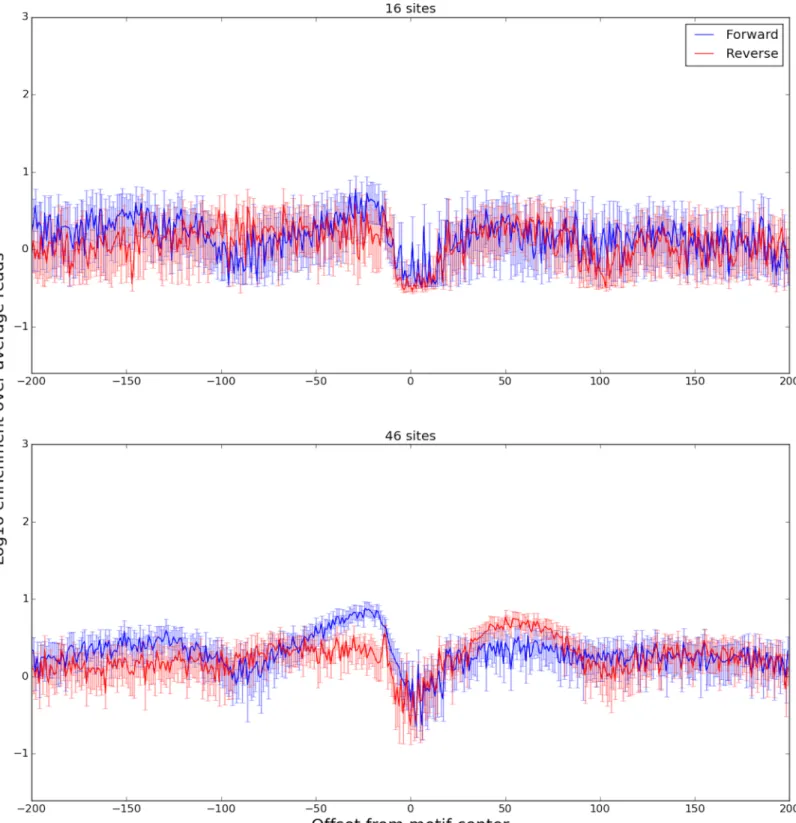
We found that the DNase-capture profiles of 62 motif present CTCF binding events clus-tered into two different DNase profiles that represent different binding modes (Fig 10). Our classifier was able to predict the membership of a binding event in its cluster based upon genome sequence with an AUROC of 0.85 with a p-value of 0.049 (Supplementary Methods). The classifier revealed two distinct CTCF binding modes based on the 5’ sequence components of its CC(C/A)(C/T)C central motif. Prior work has shown that CTCF binding was disrupted [13] when the 5’ CCAC binding site sequence was changed to ATAT. Consistent with this observation we found that the 5’ flanking motif sequence was the most important feature for predicting a site’s DNase profile cluster (Fig 10). Consistent patterns were found in the ChIP-seq profiles for the same clusters (Fig 11). We hypothesize that small changes in the flanking sequence affect binding affinity, which in turn is inversely related to the number of DNase-seq reads observed at that location.
Fig 9. Correlation of corrected DNase-capture and DNase-seq. Correlation coefficient values of the DNase-capture vs the DNase-seq data at various smoothing window sizes in the pre-selected genomic loci. Data normalization was used here.
Fig 10. Aggregate plots of two DNase-capture CTCF clusters. The plots show enrichment over the DNase-capture baseline. The bottom panel shows a normal accessibility profile of a transcription factor, with a characteristic dip in the center and a rise on both sides. The top panel shows a novel CTCF accessibility profile, where the left side has the characteristic difference between the forward and reverse strands, but the right side does not. The 95% confidence bounds are calculated through bootstrapping.
https://doi.org/10.1371/journal.pone.0187046.g010
Fig 11. Aggregate plots of two ChIP-seq CTCF clusters. The plots show raw ChIP-seq read counts over the two CTCF clusters. The ChIP-seq profiles are consistent with the DNase-seq profiles ofFig 10.
Conclusion
DNase-capture followed by BaseNormal normalization offers a high-resolution view of tran-scription factor binding at individual sites. This increased resolution allows discovery of dis-tinct sequence-specific binding modalities by individual TFs.
Supporting information
S1 Text. Supplementary materials and methods. The text includes supplemental information on the protocol, DNA sequence processing, accession codes, BaseNormal correction, ChIP-seq peak calling, and AUROC p-value computation.
(PDF)
Author Contributions
Conceptualization: Daniel Kang, Richard Sherwood, Amira Barkal, Tatsunori Hashimoto, David Gifford.
Data curation: Daniel Kang, Richard Sherwood, Amira Barkal, Tatsunori Hashimoto. Formal analysis: Daniel Kang, Richard Sherwood, Amira Barkal, Tatsunori Hashimoto,
Logan Engstrom, David Gifford.
Funding acquisition: Daniel Kang, Richard Sherwood, David Gifford.
Investigation: Daniel Kang, Richard Sherwood, Amira Barkal, Tatsunori Hashimoto, Logan Engstrom, David Gifford.
Methodology: Daniel Kang, Richard Sherwood, Amira Barkal, Tatsunori Hashimoto, David Gifford.
Project administration: Richard Sherwood, David Gifford. Resources: Daniel Kang, Richard Sherwood, David Gifford. Software: Logan Engstrom.
Supervision: David Gifford.
Validation: Daniel Kang, Logan Engstrom, David Gifford. Visualization: Daniel Kang, Logan Engstrom, David Gifford.
Writing – original draft: Daniel Kang, Richard Sherwood, David Gifford. Writing – review & editing: Logan Engstrom, David Gifford.
References
1. Boyle A, Davis S, Shulha H, Meltzer P, Margulies E, Weng Z, et al. High-Resolution Mapping and Char-acterization of Open Chromatin across the Genome. Cell 132, 311–322 (2008).https://doi.org/10. 1016/j.cell.2007.12.014PMID:18243105
2. Degner J, Pai A, Pique-Regi R, Veyrieras J, Gaffney D, Pickrell J, et al. DNase I sensitivity QTLs are a major determinant of human expression variation. Nature 482, 390–394 (2012).https://doi.org/10. 1038/nature10808PMID:22307276
3. Sherwood R, Hashimoto T, O’Donnell C, Lewis S, Barkal A, Van Hoff J, et al. Discovery of directional and nondirectional pioneer transcription factors by modeling DNase profile magnitude and shape. Nat. Biotechnol. 32, 171–178 (2014).https://doi.org/10.1038/nbt.2798PMID:24441470
4. Boyle A, Song L, Lee B, London D, Keefe D, Birney E, et al. High-resolution genome-wide in vivo foot-printing of diverse transcription factors in human cells. Genome Res. 21, 456–464 (2011).https://doi. org/10.1101/gr.112656.110PMID:21106903
5. Stergachis A, Haugen E, Shafer A, Fu W, Vernot B, Reynolds A, et al. Exonic transcription factor bind-ing directs codon choice and affects protein evolution. Science 342, 1367–72 (2013).https://doi.org/10. 1126/science.1243490PMID:24337295
6. Mamanova L, Coffey A, Scott C, Kozarewa I, Turner E, Kumar A, et al. Target-enrichment strategies for next-generation sequencing. Nat. Methods 7, 111–118 (2010).https://doi.org/10.1038/nmeth.1419 PMID:20111037
7. Fu Y, Sinha M, Peterson C & Weng Z. The Insulator Binding Protein CTCF Positions 20 Nucleosomes around Its Binding Sites across the Human Genome. PLoS Genet 4, e1000138 (2008).https://doi.org/ 10.1371/journal.pgen.1000138PMID:18654629
8. Magi A, Tattini L, Pippucci T, Torricelli F & Benelli M. Read count approach for DNA copy number vari-ants detection. Bioinformatics 28, 470–478 (2012).https://doi.org/10.1093/bioinformatics/btr707PMID: 22199393
9. Yoon S, Xuan Z, Makarov V, Ye K & Sebat J. Sensitive and accurate detection of copy number variants using read depth of coverage. Genome Res. 19, 1586–1592 (2009).https://doi.org/10.1101/gr.092981. 109PMID:19657104
10. He H, Meyer A, Hu S, Chen M, Zang C, Liu Y, et al. Refined DNase-seq protocol and data analysis reveals intrinsic bias in transcription factor footprint identification. Nat. Methods 11, 73–78 (2014). https://doi.org/10.1038/nmeth.2762PMID:24317252
11. Lazarovici A, Zhou T, Shafter A, Dantas Machado A, Riley T, Sandstrom R, et al. Probing DNA shape and methylation state on a genomic scale with DNase I. Proc. Natl. Acad. Sci. U. S. A. 110, 6376–6381 (2013).https://doi.org/10.1073/pnas.1216822110PMID:23576721
12. Consortium T. An integrated encyclopedia of DNA elements in the human genome. Nature 489, 57–74 (2012).https://doi.org/10.1038/nature11247PMID:22955616
13. Kanduri C, Pant V, Loukinov D, Pugacheva E, Qi C, Wolffe A, et al. Functional association of CTCF with the insulator upstream of the H19 gene is parent of origin-specific and methylation-sensitive. Curr. Biol. CB 10, 853–856 (2000). PMID:10899010