Publisher’s version / Version de l'éditeur:
Vous avez des questions? Nous pouvons vous aider. Pour communiquer directement avec un auteur, consultez la première page de la revue dans laquelle son article a été publié afin de trouver ses coordonnées. Si vous n’arrivez pas à les repérer, communiquez avec nous à [email protected].
Questions? Contact the NRC Publications Archive team at
[email protected]. If you wish to email the authors directly, please see the first page of the publication for their contact information.
https://publications-cnrc.canada.ca/fra/droits
L’accès à ce site Web et l’utilisation de son contenu sont assujettis aux conditions présentées dans le site LISEZ CES CONDITIONS ATTENTIVEMENT AVANT D’UTILISER CE SITE WEB.
Canadian Journal of Civil Engineering, 13, 3, pp. 270-277, 1986-06
READ THESE TERMS AND CONDITIONS CAREFULLY BEFORE USING THIS WEBSITE. https://nrc-publications.canada.ca/eng/copyright
NRC Publications Archive Record / Notice des Archives des publications du CNRC : https://nrc-publications.canada.ca/eng/view/object/?id=0013163c-a5e7-4285-aba4-fd3d64d3fcbb https://publications-cnrc.canada.ca/fra/voir/objet/?id=0013163c-a5e7-4285-aba4-fd3d64d3fcbb
NRC Publications Archive
Archives des publications du CNRC
This publication could be one of several versions: author’s original, accepted manuscript or the publisher’s version. / La version de cette publication peut être l’une des suivantes : la version prépublication de l’auteur, la version acceptée du manuscrit ou la version de l’éditeur.
Access and use of this website and the material on it are subject to the Terms and Conditions set forth at
Dynamic behaviour of a gymnasium floor
Ser
THl
N21d
O .
1409
Natronal
Research
Consdl
natlond
c.
2
I+
CoundlCan*
*,BchdwsCN(*
BIlDG
. p~- -
Institute for
lnstitut de
Research in
recherche en
Construction
construction
Dynamic Behaviour
of
a Gymnasium Floor
by J.H. Rainer and J.C. Swallow
Reprinted from
Canadian Journal of Civil Engineering
Vol. 13, No. 3, June 1986
p. 270- 277
(IRC Paper No. 1409)
Price $2.00
NRCC 26403
N R a-
crsnBLDG. RES.
L I B R A R Y
86- 11-
2
4
BIBLIOIH~QUE
"*:c)t.BStim.
j C ;I%RC-
T h i s paper i s being d i s t r i b u t e d i n r e p r i n t form by t h e I n s t i t u t e f o r Research i n C o n s t r u c t i o n . A l i s t of b u i l d i n g p r a c t i c e and r e s e a r c h p u b l i c a t i o n s a v a i l a b l e from t h e I n s t i t u t e may be o b t a i n e d by w r i t i n g t o t h e P u b l i c a t i o n s S e c t i 6 n , I n s t i t u t e f o r Research i n C o n s t r u c t i o n , N a t i o n a l Research C o u n c i l of C a n a d a , O t t a w a , O n t a r i o ,
K1A 0R6.
C e document est d i s t r i b u e sous forme de t i r 6 - 8 - p a r t p a r 1 ' I n s t i t u t de r e c h e r c h e e n c o n s t r u c t i o n . On p e u t o b t e n i r une
l i s t e
d e s p u b l i c a t i o n s d e 1 ' I n s t i t u t p o r t a n t s u r
les
t e c h n i q u e s oules
r e c h e r c h e s e nmatisre
d e batiment e n B c r i v a n t
B
l a S e c t i o n d e s p u b l i c a t i o n s , I n s t i t u t -- d e r e c h e r c h e - - enc o n s t r u c ' r e c h e r c h f
Dynamic behaviour of a gymnasium floor
J. H. RAINERDivision of Building Research, National Research Council of Canada, Ottawa, Ont., Canada KIA OR6
AND
J. C. SWALLOW
Barman Coulter Swallow Associates, Rexdale, Ont., Canada M9W 1C8
Received April 16, 1985
Revised manuscript accepted October 25, 1985
Ten mode shapes, natural frequencies, and modal damping values have been measured for a steel-joist concrete-slab floor spanning 32.1 m. From ambient vibrations and steady-state shaker tests the frequency of the fundamental mode was determined to be 3.5 Hz, and the modal damping ratio to be approximately 1% of critical. A comparison of vibration criteria in Appendix
G of CAN3-S16.1-M84 confirms satisfactory performance for walking, but for other rhythmic exercises disturbing vibrations developed. These occurred primarily at the forcing frequency of the exercises and not at floor resonance frequencies. Values of dynamic load factors, a, for rhythmic loadings of this floor were evaluated in accordance with the guidelines on floor vibrations in the Commentary to the National Building Code of Canada 1985.
Key words: floors, gymnasiums, vibration tests, resonant frequencies, mode shapes, dynamic loads, dynamic response. Dix modes de vibration, les frCquences naturelles et les valeurs des amortisements correspondants ont CtC mesurks dans le cas d'une dalle de bCton reposant sur des poutres a h e ajourCe de 32,1 m de portke. A partir de la vibration occasionnCe par un usage normal et d'essais de vibration continue, la frkquence du premier mode fut trouvCe kgale a 3,5 Hz et le degrC d'amortissement correspondant Cgal approximativement a 1% de I'amortissement critique. La comparaison au critere de vibration de l'appendice G de la norme CAN3-S16.1-M84 montre que ce critkre est satisfaisant dans le cas de vibration occasionnCe par la marche mais ne tient pas compte de vibrations additionnelles dans le cas d'exercices rythmiques. Ces vibrations additionnelles apparaissent principalement la frCquence forcke des exercices et non a la frequence de rCsonance du plancher. Pour le plancher analysC, les coefficients dynamiques, a, furent CvaluCs pour une charge rythmCe en accord avec les directives concernant les vibrations des planchers dCcrites dans les commentaires du Code National du BLtiment du Canada de 1985.
Mots clks: planchers, gymnases, essais de vibration, frCquences de resonance, modes de vibration, charges dynarniques, amplification dynamique.
[Traduit par la revue] Can. J. Civ. Eng. 13, 270-277 (1986)
Introduction
Strong materials and efficient structural configurations have resulted in wider use of long-span floor systems. Unfor- tunately, their low mass and generally low inherent damping have made them more prone to dynamic excitation than pre- vious, heavier types of construction. For many floor systems it is therefore necessary to consider dynamic loadings as-a design condition in order to derive satisfactory performance for an intended occuDancv.
.
.
Design criteria for long-span floors are available for walking vibrations (Allen and Rainer 1976; Canadian Standards Associ- ation 1984) and for coordinated activities (Allen et al. 1985; Supplement to the National Building Code of Canada 1985). There is, however, an ongoing need for evaluation of these criteria and for possible improvements. As well, basic parame- ters required in the design and analysis of floors subjkcted to dynamic loads need to be defined and verified. These include values for natural frequencies, mode shapes, and damping characteristics, as well as properties of the loading functions. This paper evaluates the results of field measurements of the dynamic behaviour of a suspended gynmasium floor according to two parts: (1) dynamic properties of the floor, and (2) behav- iour of the floor under dynamic loads.
NOTE: Written discussion of this paper is welcomed and will be received by the Editor until September 30, 1986 (address inside front cover).
@
32.10 rn (105'-4") (JOISTS 5 TO 21)w
1
5 1 rnm (2")I BEADBOARD, .CONCRETE
Frc. l a . Cross section of floor construction.
Description of floor
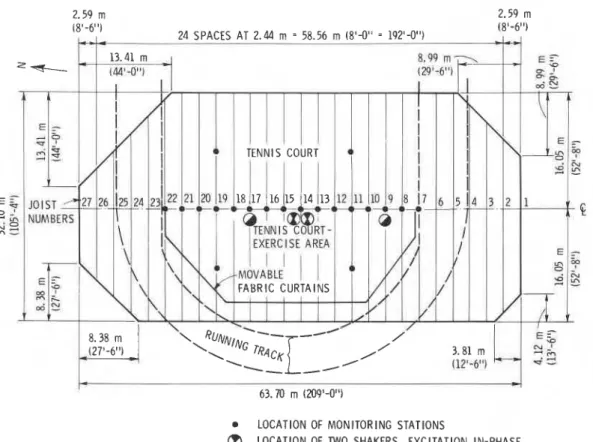
The suspended gymnasium floor consists of 2.08 m deep open-web joists spanning 32.10 m, centred at 2.44 m and carrying a double concrete slab. A 127 mm concrete slab on
38 mm steel decking is covered by a layer of 5 1 mm beadboard thermal insulation topped by another concrete slab 114 rnrn thick. A cross section is shown in Fig. l a and a plan view of the layout, in Fig. l b . Further structural details of the joist- and-slab construction are available (Swallow 1984). The floor
RAINER AND SWALLOW
LOCATION OF MONITORING STATIONS
0
LOCATION OF TWO SHAKERS, EXCITATION IN-PHASE @ LOCATION OF TWO SHAKERS. EXCITATION 180" OUT-OF-PHASE FIG. Ib. Layout of floor and measuring stations.carries a portion of the running track, as shown in Fig. Ib, and two tennis courts located side by side. The tennis courts can be separated from each other and from the track by means of movable plastic curtains. The exercise area occupies roughly one-half the span in the centre area of the floor.
The floor was designed according to the criteria contained in Appendix C of CAN3-S16.1 (Canadian Standards Association 1984) for walking vibrations and performs well under this type of excitation. When coordinated activities were performed on the floor, however, the resulting vibrations were disturbing. Investigation of the nature and underlying causes of complaint revealed that the objectionable vibrations arose from a forced vibration resulting from rhythmic activities at a dominant fre- quency below the fundamental frequency of the floor.
Measurements of floor properties
Natural frequencies and mode shapes and modal damping were investigated. The test procedure included an evaluation of tuned mass dampers, but their detailed vibration behaviour is not reported here. Two methods were used: steady-state shaker excitation and an ambient vibration survey. The steady-state resonance search was conducted using two "Electroseis" elec- trodynamic shakers with maximum rated force output of 133 N and a maximum stroke of 16.5 cm. After a preliminary fre- quency sweep had located the modal frequencies, sinusoids separated in frequency by small increments were applied to the shaker and the detailed steady-state response curve was deter- mined for each mode. At each resonance frequency the mode shape was mapped by moving an accelerometer to various grid points on the floor and recording the amplitude and phase of the response relative to a stationary accelerometer. The two shakers were positioned as shown in Fig. Ib, and were driven
in-phase for modes 1 and 3 and 180" out-of-phase for modes 2 and 4. After each determination of mode shape the shaker was stopped abruptly and the vibration decay of the floor was recorded for calculation of the damping ratio.
For ambient vibrations five servo-accelerometers with a sen-
sitivity of 5 V/g were employed. The signals were low pass-
filtered at 25 Hz, amplified by 20 dB, and recorded on a
7-channel "Racal" FM tape recorder. The transducer stations are shown in Fig. l b by solid circles. Five transducers were placed at adjacent positions, starting at number 7, and succes- sive setups employed one overlapping station for continuity and scaling purposes. Each recording session lasted about an hour. Only locations 7-22 could be monitored because the track was in use; activities there and on the easterly tennis court provided much of the ambient excitation for the floor. One other setup was employed, shown by circles at quarter-span in line with locations 19 and 1 1, for purposes of identifying points of inflection that might occur at the centre line and for possible scaling of other transducer setups.
For analysis of vibration signals a Hewlett-Packard 5423A structural dynamic analyser was used to compute spectra and phase among the various stations.
Results
Mode shapes and natural frequencies
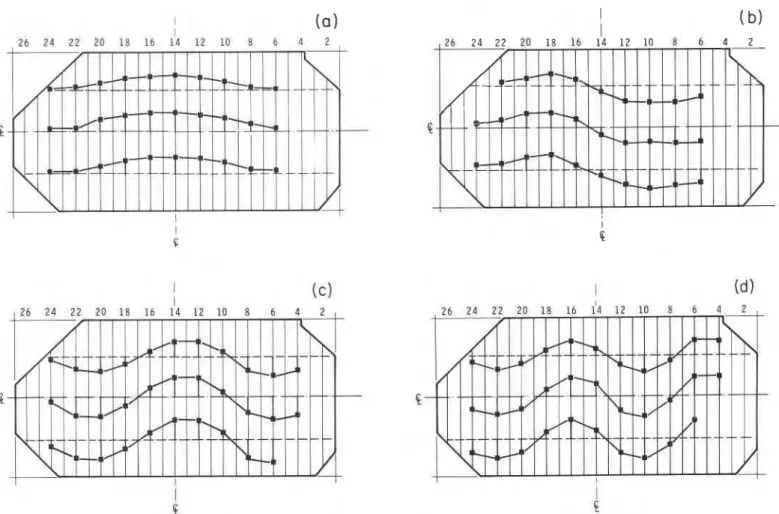
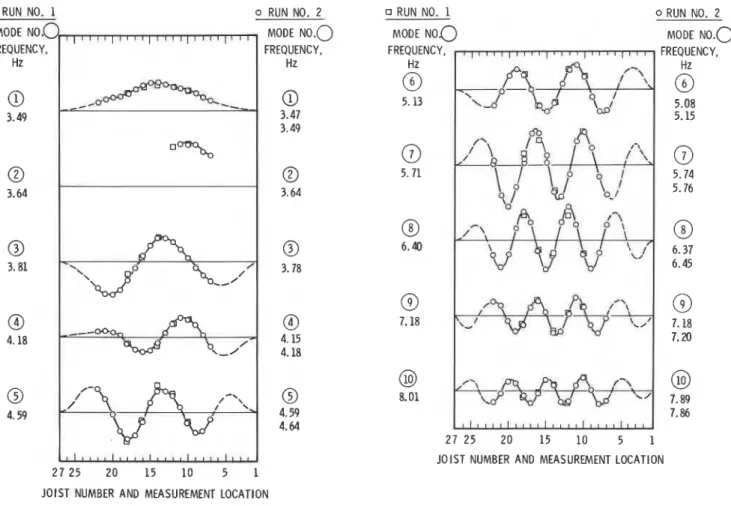
The first four mode shapes and frequencies of the floor obtained from the shaker tests are shown in Fig. 2. Comparable results for the first 10 modes determined from ambient vibra- tions are shown in Fig. 3, arranged in ascending order of fre- quency. The circled numbers represent data from recording sessions with the tuned mass dampers in place; the relevant measured frequencies are given under run No. 2. The dampers
CAN. I. CIV. ENG. VOL. 13, 1986
(a)
FIG. 2. Measured mode shapes and natural frequencies for bare floor from steady-state shaker tests: (a) first mode, at 3.54 Hz; (b) second mode, at 3.65 Hz; (c) third mode, at 3.82 Hz; (d) fourth mode, at 4.19 Hz.
were difficult to tune, but because of time constraints they could not be removed for all tests. As a result there was some uncertainty as to which mode (if any) they would affect. To investigate this, measurements performed initially without the tuned mass dampers were analysed. They are indicated in Fig. 3 by squares, with the applicable natural frequencies given on the left side of the mode shapes under run No. 1.
The identified modes follow a regular pattern of increasing number of nodes with increasing frequency. Mode 2 could not be identified readily from the ambient vibration survey because it was weakly excited and its frequency is too close to that of adjacent modes. The agreement of frequency and mode shape for the data points before and after installation of the tuned mass damper is generally good. The largest deviation in fre- quency is for mode 10, amounting to approximately 2%. Small variations in natural frequency were observed for successive setups, as shown in Fig. 3, possibly caused by changes in loading. As data points towards the edges of the floor were not available, they were extrapolated on the basis of judgement and previous experience, as indicated by the dashed lines in Fig. 3. Agreement between the steady-state shaker method and the ambient vibration method was excellent, and the natu- ral frequencies from the various methods (Table 1) compare favourably
.
The results for the quarter-span monitoring stations (Fig. lb) of the ambient vibration survey indicate no inflection points along the length of the joists up to a frequency of 9 Hz; there- after, a succession of densely spaced modes with inflection points at the centre span commenced.
Modal damping
In the steady-state shaker tests the damping ratio,
P,
was evaluated by means of the half-power bandwidth method for the resonance curves shown in Fig. 4:wheref, and& are upper and lower frequencies corresponding to half-peak power and f, is the resonance frequency of mode n.
In the other method of evaluating damping from the shaker tests the rate of decay from the steady-state resonance test was monitored in each mode. Here,
where yo and y, are the peak amplitudes separated by m cycles of vibration decay. A sample decay curve for both linear and logarithmic scales is shown in Fig. 5. The logarithmic plot is useful for obtaining a straight-line fit and thereby for deter- mining whether any deviation occurs from the commonly assumed velocity-dependent damping model for the structure being tested. All results for this floor showed a good straight- line fit.
With ambient vibrations, damping can be evaluated from the half-power bandwidth of the power spectrum (or the width at 0.707 times the peak amplitude of the Fourier amplitude spec- trum) according to [I], or from a single-degree-of-freedom curve fitting procedure that is part of the spectrum analyser
RAINER AND SWALLOW 273
RUN NO. 1 0 RUN NO. 2
MODE
NO,^
, , , ,,
,
,
I I u 1 I 1 !dl0DENO.O
FREQUENCY. FREQUENCY. Hz Hz-
2 7 25 20 15 10 5 1 JOIST NUMBER AND MEASUREMENT LOCATIONRUN NO. 1 MODE NOQ FREQUENCY, Hz
(9
5. 13 0 RUN NO. 2 MODE ~ 0 . 0 FREQUENCY, Hz@
5.08 5.15 27 25 20 15 10 5 1JOIST NUMBER AND MEASUREMENT LOCATION
RUN NO. 1: BARE FLOOR; RUN NO. 2: TUNED MASS DAMPERS I N PLACE
FIG. 3. Measured mode shapes and natural frequencies of floor from ambient vibrations.
I F R E Q U E N C Y . H z
1
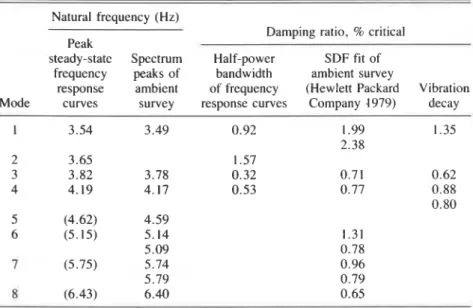
FIG. 4. Floor response to steady-state shaker excitation.(Hewlett Packard Company 1979). The results obtained by means of the various methods are presented in Table 1.
It may be observed that for modes 1, 3, and 4 the damping ratios from the steady-state shaker tests are somewhat smaller than for those from either the rundown curves or the ambient vibrations. The latter gives the highest value of damping for mode 1, possibly because people act as dampers at various times or because there are small variations in natural frequency owing to the added mass of the people.
Response to heel impact
Calculations of floor response to simulated heel impact, as presented in CSA S16.1-1984 as part of the criterion for walking vibrations, give the following:
Natural frequency
where E = modulus of elasticity of steel = 200 000 MPa, I, = moment of inertia of transformed section = 3.99 x 10" mm4, and w = dead weight per unit length of joist = 14.9 N/mm.
Initial peak acceleration
where L = span length in m = 32.10 m, tc = effective concrete thickness in mm = 222 mm, and g = acceleration due to gravity. Thus, the calculated initial peak acceleration, %, is 0.128% g. A comparison with the criterion for walking vibra- tions in CSA S16.1-1984 shows that this floor is well within the satisfactory range.
The measured value of the fundamental natural frequency was 3.5 Hz, which is in good agreement with the calculated value of 3.33 Hz. For the measured initial acceleration, 4, of the heel impact, a sharp peak was present in the unfiltered signal. This is thought to originate with the localized response of the top layer of concrete. The displacement signal, however, gave a reasonably regular decay. curve, which was used to obtain initial peak displacement. Multiplication by ( 2 ~ f o ) ~ then gave an approximation of the initial acceleration corresponding to the fundamental mode, fo.
From an average of five tests the measured values of 6 were 0.144% g for a person weighing 75 kg and 0.197% g for one
274 CAN. 1. CIV. ENG. VOL. 13, 1986
TABLE I. Comparison of frequencies and damping ratios obtained by various methods Natural frequency (Hz)
Damping ratio, % critical Peak
steady-state Spectrum Half-power SDF fit of frequency peaks of bandwidth ambient survey
response ambient of frequency (Hewlett Packard Vibration
Mode curves survey response curves Company 1979) decay
I 3.54 3.49 0.92 1.99 1.35 2.38 2 3.65 1.57 3 3.82 3.78 0.32 0.71 0.62 4 4.19 4.17 0.53 0.77 0.88 0.80 5 (4.62) 4.59 6 (5.15) 5.14 1.31 5.09 0.78 7 (5.75) 5.74 0.96 5.79 0.79 8 (6.43) 6.40 0.65
NOTES: ( I ) All ambient results were determined by the "cursor band method" of the H.P. 5423A
analyser. Multiple entries for some modes denote independent determinations. (2) Ambient reso- nance frequencies differ slightly from those presented in Fig. 3 since there the resonance frequencies were determined from the "spectrum peak cursor method." (3) Natural frequencies in parentheses were identified by matching peaks of frequency response curves with spectrum peaks of ambient vibrations, but mode shapes were not determined.
TABLE 2. Response of floor to exercise class
Exercise Activity
Lowest
dominant Other Peak Peak dynamic
response major response acceleration displacement frequency frequencies at location 16 at location 16
(Hz) (Hz) (% g) (mm)
- -
Skipping on spot Jumping on alternate feet Jumping with arm movement
Jumping with raising of alternate knees Rushing from edge to centre
Jumping and raising of alternate feet Running counterclockwise round tennis court On-spot jumping, both feet, hands up and down Jumping and twisting of body and stretching of arms Quick step
Concentric inward and outward movement of participants "Twist" dance step
NOTES: ( 1 ) Dominant peaks in the Fourier amplitude spectrum of the acceleration signal are underlined. Feeble peaks are presented in parentheses. (2) An average of 64 persons participated, about evenly distributed over the tennis court within the exercise area indicated in Fig. Ib.
weighing 87 kg, both values being larger than the calculated one of 0.128% g. One reason for this discrepancy could be that the displacement record still contains some high-frequency component in the initial peak response and therefore gives higher values of Q than would be obtained if only the response
of the fundamental mode were present. Response of floor to coordinated activity
When a structure is subjected to dynamic loading, it re- sponds according to (I) the frequency content and amplitude of the load and (2) the dynamic properties of the structure,
i.e., natural frequencies and mode shapes plus damping properties (Clough and Penzien 1975). While the dynamic properties of structures are generally available from either mea- surements or calculations, the characteristics of the loading function are relatively poorly defined.
To obtain a better understainding of the response of a floor to dynamic loadings, two exercise (or dancercize) classes were scheduled and the resulting response was measured. Only the portion designated "exercise area" in Fig. l b was occupied and the vibrations were measured at two points on the centre line of the joist span. Representative samples of Fourier amplitude
RAINER A N D SWALLOW ( a ) LINEAR SCALE M O D E 1 m 7a (b)LOGARITHMICSCALE - 1 2 0 . 0 0 l L 1 " l 0 5 1 0 T I M E , s
FIG. 5. Vibration decay for mode 1 at 3.5 Hz (locations 14 and 17). spectra and acceleration time records of the floor vibrations are presented in Figs. 6-8. Additional results are available (Swallow 1984; Rainer 1984). Table 2 is a summary of the values for one exercise class; the lowest significant spectrum peak is noted and the largest frequency component underlined. Also shown are maximum accelerations and displacements for each record analysed. Table 3 shows corresponding average maximum accelerations at the forcing frequency, f, for two floor locations.
It may be seen by comparing the columns for peak acceler- ation at location 16 in Tables 2 and 3 that the acceleration response amplitudes at the lowest dominant forcing frequency are smaller than the response amplitude of the total signal in Table 2 and Fig. 6 by factors varying from 1.4 to 4.2. This is because a major portion of the acceleration signal consists of higher harmonics of the lowest dominant excitation frequency, as illustrated in the spectrum in Fig. 7. For displacements at location 16, presented in Table 2 but not explicitly in Table 3,
the components that correspond to the lowest dominant forcing frequency are smaller than the total displacement signal by factors of 1.05- 1.6. These increases are smaller than those for acceleration because the displacement for a sinusoidal response is proportional to the inverse of the frequency squared.
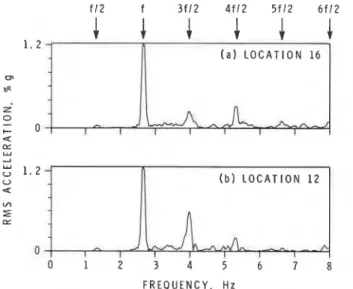
A significant acceleration response also occurs at 1.5 times the lowest dominant excitation frequency, f , as shown in the spectra in Figs. 7 and 8. This points to the presence of a subharmonic forcing frequency at one-half the lowest dominant frequency, f . Indeed, a careful examination of the Fourier spec- tra in Fig. 8 and similar spectra for other exercises shows a
L
.!-i
( a ) ACCELERATION
FIG. 6. Floor response at location 16 due to jumping and twisting of torso and arm stretching (exercise 9, class I ) , 6 Hz low pass filter.
0 1 2 3 4 5 6 7 8
F R E Q U E N C Y . H z
FIG. 7. Fourier amplitude spectra of accelerations from jumping
and twisting of torso and arm stretching (exercise 9, f = 2.33 Hz).
1 . 2 1
( a ) L O C A T I O N 1 6
rn
6=
F R E Q U E N C Y . H z
FIG. 8. Fourier amplitude spectra of accelerations from jumping,
with raising of alternate knees (exercise 4, f = 2.66 Hz).
very small component at frequency f/2. The major responses are seen to be at harmonics of 2, 3, 4, 5, and 6 times the subharmonic frequency f/2.
The explanation for the presence of this subharmonic frequency component is as follows. The dominant lowest-
276 CAN. J. CIV, ENG. VOL. 13, 1986
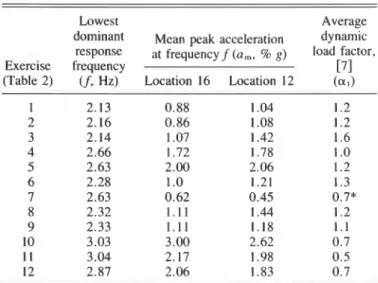
TABLE 3. Accelerations and dynamic load factors for lowest dorni- nant response of exercise class
Lowest Average
dominant Mean peak acceleration dynamic response at frequency f (a,, % g) load factor,
Exercise frequency [71
(Table 2) (f, Hz) Location 16 Location 12 (a,)
*This is double the value obtained from [5] since only about half the number of people were running at the centre of the floor.
frequency component corresponds to the "beat of the music," and derives from an impact produced by alternate feet; each foot strikes the floor "on the music beat" with frequency f. Thus, if one or the other foot is emphasized consistently in terms of its size of impact, then a further excitation compo- nent at one-half the "music beat" frequency is introduced. Such an uneven loading can be involuntary if one leg is fa- voured as the stronger one, or voluntary if participants are requested for a stronger response from one leg than from the other. There are many other activities in which the strength of every second forcing pulse differs naturally from the other, for example, skipping or jumping with feet placed alternately apart and together.
The largest response in acceleration and displacement was obtained from exercise 11, where two components at closely spaced frequencies formed a beat. The nonresonant component of 3.04 Hz and the near-resonant portion of mode 1 at 3.44 Hz each contributed about half the total response. The Fourier amplitude spectrum peaks for the exercise class, locations 12 and 16 in Table 3, show only slightly different amplitudes for the lowest excitation frequency, but often give significant amplitude variations for frequency peaks of higher harmonics. This could be due to spatial variations in the excitation charac- teristics or to a difference in the modal response of the floor.
Evaluation of dynamic load factors
A method of determining the dynamic response of floors to coordinated dynamic loading has been presented (Allen et al.
1985; Supplement to the National Building Code of Canada 1985) in which the dynamic loading function is described as a summation of the Fourier components of various harmonics:
m
[5] F(t) = a,,w, sin (2.srnft
+
+,)1 1 = 1
where n refers to the nth harmonic,
+
is the phase angle, and other terms are defined below. For the fundamental component, i.e., n = 1,[6] F(t) = alwp sin 2nft
where f is the frequency of excitation, w, = weight of people
per unit area, and al is the dynamic load factor for the lowest dominant harmonic of the loading pulse. Knowing the dynamic properties of the floor and the loading conditions permits an evaluation of the dynamic load factor a, (Allen et al. 1985),
where a, = peak acceleration, g = acceleration due to gravity,
w, = total weight of floor per unit area = dead load
+
wp,fo =fundamental natural frequency of floor, f = dominant lowest- frequency component of dynamic loading, and
P
= damping ratio, fraction of critical.An adjustment in the weight of people per unit area, w,, had to be made to account for partial loading of the floor span. The peak acceleration, a,, was obtained from the amplitude of spectrum peaks and therefore represents an average value over a 32 s duration. Values of the dynamic load factor, a,, thus obtained are given in Table 3. The results show that a, varies from about 0.7 to 1.6 for the fundamental component. Higher- order components of the dynamic load factor cannot be eval- uated reliably from this example because their frequencies generally coincide with or are close to those of the higher modes of the floor. The calculations from [7] then become very sensitive to small variations in the relevant parameters. This is illustrated by the second peak in the spectra in Fig. 7, where the floor responds significantly at the fundamental mode at 3f/2 as a result of a higher harmonic of the jumping excitation.
Discussion
The results obtained for the dynamic properties of a gym- nasium floor demonstrate that mode shapes can be successfully determined from existing ambient vibrations. Although similar results can also be obtained from sinusoidal shaker tests, the latter require sufficient shaker force and low levels of back- ground vibration. That is, all activities on and near the floor have to cease. For the ambient vibration method, however, these activities can continue provided they are not too dominant at any one frequency.
The response of the floor to the exercise classes has shown that disturbing vibrations are primarily the forced response at a frequency lower than the fundamental frequency of the floor. This means that remedial measures effective in reducing vibra- tions at natural frequencies would probably be ineffective in this case. For example, increased damping or a damper tuned to any of the natural frequencies would not effect any notice- able reduction in the amplitude of floor response that corre- sponds to the dominant excitation frequency.
The behaviour of this gymnasium floor also shows that although the criteria for walking vibrations are satisfied, ex- cessive vibration response can still occur under coordinated rhythmic activities such as physical exercise or jumping to music (Allen et al. 1985; Supplement to the National Building Code 1985).
Summary and conclusions
Steady-state shaker tests to determine mode shapes of a floor have proved to be efficient in isolating the four lowest modes and their damping values. Sufficient shaker force is required, however, to excite the floor to a reasonable level, and the background vibrations must be kept to a minimum.
The ambient vibration method was successful in identifying 10 successive modes ranging in natural frequency from 3.5 to
RAINER AND SWALLOW 277
8.0 Hz, although mode 2 was too feeble for a satisfactory definition. Where the common reference transducer locations in successive setups coincide with small modal amplitudes poor amplitude scaling was obtained. For this reason, an additional transducer setup differing from those used previously is needed to establish proper scaling. There is good agreement in natural frequencies and mode shapes between steady-state shaker results and those from ambient vibrations.
The vibration decay curves of single-frequency mode exci- tation yielded damping values for modes 1, 3, and 4 of 1.35, 0.62, and 0.88% of critical, respectively. For modes 3 and 4, damping values calculated from ambient vibrations agreed well with those obtained from vibration decay curves, while for mode 1 somewhat larger damping values of 2.0-2.4% were obtained. The modal damping ratios from steady-state shaker tests were in all cases smaller than those from ambient vibra- tions or the decay method.
The calculated and measured fundamental frequencies show good agreement at 3.33 and 3.5 Hz, respectively. The mea- sured initial peak accelerations of 0.144 and 0.197% g due to heel impact are higher than that calculated as 0.128% g; this is probably due to high-frequency components in the record. For walking vibrations the floor falls well within the satis- factory range.
The results for the exercise class showed that the maximum response often occurred at the driving frequency, not at the resonant frequency of the floor. This is in contrast with many observations of floor vibrations in which modal response governed. It is clear, therefore, that simple avoidance of reso- nance does not preclude problems of perceptible or annoying vibration.
The lowest dominant excitation frequencies varied between 2 and 3.2 Hz. The floor acceleration response occurred not only at that frequency but also at higher harmonics, with resulting acceleration amplitudes up to 4.2 times larger than those for the lowest dominant excitation frequency. On the other hand, and as would be expected, displacements were less affected by these higher harmonics, contributing from 5 to 60% more than the displacements at the lowest forcing frequency.
An examination of the Fourier spectra of floor response
shows that the lowest-frequency component of the forcing function is generally at one-half the frequency of the "music beat." Although the amplitude of this component is very small, the response produced by the harmonics can be com- parable to the response at the music beat when the harmonic coincides with or is close to the frequency of the lowest mode of the floor. The dynamic load factor, a,, for the lowest dom- inant frequency component of the rhythmic exercise activities varied from 0.7 to 1.6.
Acknowledgement
The cooperation of the Department of Athletics and Recrea- tion and the Department of Physical Plant, University of Toronto, in making the measurements is gratefully acknowl- edged.
This paper is a contribution from the Division of Building Research, National Research Council of Canada.
ALLEN, D. E., and RAINER, J. H. 1976. Vibration criteria for long- span floors. Canadian Journal of Civil Engineering, 3(2), pp. 165-173.
ALLEN, D. E., RAINER, J. H., and PERNICA, G. 1985. Vibration criteria for assembly occupancies. Canadian Journal of Civil Engineering, 12(3), pp. 617-623.
CANADIAN STANDARDS ASSOCIATION. 1984. Steel structures for buildings-Limit states design, Appendix G: Guide on floor vibrations. CSA S 16.1-1984, Rexdale, Ont.
CLOUGH, R. W., and PENZIEN, J. 1975. Dynamics of structures. McGraw-Hill, New York, NY, 634 p.
HEWLETT PACKARD COMPANY. 1979. Structural dynamics analyzer 5423A, user's guide.
RAINER, J. H. 1984. Dynamic response of a gymnasium floor. National Research Council of Canada, Division of Building Research, Ottawa, Ont., Building Research Note 213.
SWALLOW, J. C. 1984. An investigation of gymnasium floor vibration at the University of Toronto. Contract OSR83-00051, National Research Council of Canada, Division of Building Research, Ottawa, Ont.
SUPPLEMENT TO THE NATIONAL BUILDING CODE OF CANADA. 1985. Commentary A. Serviceability criteria for deflections and vibra- tions. Associate Committee on the National Building Code, National Research Council of Canada, Ottawa, Ont., pp. 146- 152.