Characterization of Ion Cluster Fragmentation
in Ionic Liquid Ion Sources
by
Catherine Elizabeth Miller
Submitted to the Department of Aeronautics and Astronautics
in partial fulfillment of the requirements for the degree of
Doctor of Philosophy in Aeronautics and Astronautics
at the
MASSACHUSETTS INSTITUTE OF TECHNOLOGY
June 2019
c
○ Massachusetts Institute of Technology 2019. All rights reserved.
Author . . . .
Department of Aeronautics and Astronautics
May 23, 2019
Certified by . . . .
Paulo C. Lozano
M. Alemán-Velasco Professor of Aeronautics and Astronautics, MIT Thesis Supervisor
Certified by . . . .
Manuel Martínez-Sánchez
Professor Emeritus, MIT Committee Member
Certified by . . . .
Juan Fernández de la Mora
Professor of Mechanical Engineering and Materials Science, Yale University Committee Member
Accepted by . . . .
Sertac Karaman
Associate Professor of Aeronautics and Astronautics, MIT Chair, Graduate Program Committee
Characterization of Ion Cluster Fragmentation
in Ionic Liquid Ion Sources
by
Catherine Elizabeth Miller
Submitted to the Department of Aeronautics and Astronautics on May 23, 2019, in partial fulfillment of the
requirements for the degree of
Doctor of Philosophy in Aeronautics and Astronautics
Abstract
Ion electrospray propulsion is a cutting-edge micropropulsion technology that could revolutionize the capabilities of microsatellites. Ion electrospray thrusters could also be used on large spacecraft for precision attitude control applications such as gravity wave detection and exoplanet imaging. Novel room temperature molten salts, called ionic liquids, are used as propellant, which are composed purely of positive and neg-ative molecular ions. When exposed to strong electric fields, ions and metastable clusters of ions are evaporated from the bulk liquid surface. The free ions and ion clusters can be accelerated to high velocities, producing thrust at high specific im-pulse. The performance of ion electrospray thrusters is affected by the composition of the ion beam and the amount of ion clusters that break apart during the acceleration phase. To improve thruster performance, a better understanding of the fundamental physics of ion evaporation and cluster break-up is needed.
The break-up of ion clusters, also called fragmentation, is not a well understood phenomenon. It has been observed in past experiments, but the rates of break-up have not been measured. The focus of this work is to experimentally investigate fragmentation more deeply than ever before. To accomplish this, a specialized in-strumentation suite has been designed, built, and tested to measure fragmentation characteristics in unprecedented detail. A full-beam, spherical geometry retarding potential analyzer is used to measure the rates of fragmentation of ion clusters both outside the thruster and within the acceleration region for the first time. A narrow-beam, high time-resolution time of flight mass spectrometer is used to measure the beam composition. Single emitters based on resorcinol formaldehyde carbon xerogels were used as ion sources. Four ionic liquids spanning a wide range of liquid proper-ties were characterized: EMI-FAP, EMI-Im, EMI-BF4, and BMI-I. Analytical models
were also developed to enhance the interpretation of the experimental results. The experimental measurements show that the amount of fragmentation increases with distance from the thruster and follows a constant rate equation. The mean life-times of ion clusters outside of the thruster range from 1-6 𝜇s, indicating that these clusters are quite unstable. It is observed that the fragmentation throughout most
of the acceleration region is linear with respect to electric potential, which can be understood using analytical models. Rapid fragmentation likely occurs immediately after evaporation due to the strong electric fields near the emission site, which has significant implications for thruster performance. It is also observed that clusters of complex molecular ions which consist of many atoms tend to be the most stable. The initial temperature of ion clusters, which range from 520 K - 790 K, were estimated using analytical methods. The effect of liquid temperature on the rates of fragmen-tation was also investigated. In conclusion, the work in this thesis provides a greatly enhanced understanding of ion cluster fragmentation, particularly how it is affected by ionic liquid properties, liquid temperature, and electric fields.
Thesis Supervisor: Paulo C. Lozano
Acknowledgements
Life does not exist in a vacuum. Modern society might have convinced us that we are separate, isolated individuals living our own lives, but this illusion couldn’t be farther from the truth. All of life is an interconnected web without beginning or end. Our lives belong to each other and we belong to each other. The work in this thesis is not something I could have accomplished on my own, so I express my humble gratitude to all who have supported me on my journey.
I would first like to thank my advisor, Prof. Paulo Lozano, for giving me the opportunity to do this fascinating research! I am deeply grateful for his kindness, patience, encouragement, and endless enthusiasm. I am truly blessed to have had such a wonderful thesis advisor who made graduate school much more fun than frustrating! Next I would like to thank the members of my thesis committee, Prof. Manuel Martínez-Sánchez and Prof. Juan Fernández de la Mora, for their time, support, and expertise. Thank you to Prof. Carmen Guerra Garcia and Dr. Rainer Dressler for reading my thesis draft and providing thorough revisions that greatly improved the final document.
This research was supported by a NASA Space Technology Research Fellowship. Thank you to John Dankanich for supporting me as a NASA Space Technology Re-search Fellow. Thank you also to Dr. Kurt Polzin and Dr. John Ziemer for mentoring me while I visited NASA MSFC and NASA JPL. This research was also made pos-sible by NASA, other US government agencies, and the Zonta International Amelia Earhart Fellowship.
I would also like to thank the Aero Astro staff for their support and encouragement. Thank you to Beth Marois for answering all of my questions and thank you to Jean Sofronas for helping me schedule meetings, completing all of my purchase orders, and doing those long travel reimbursements! Thank you to Todd Billings for teaching me how to work in the machine shop - my experiments would have never gotten off the ground without all of your help!
I have had the privilege of working with several undergraduate students through the UROP program who were a huge help in building my experiments. Thank you to Amy Vanderhout - her efforts were absolutely essential in developing and building the spherical RPA! Thank you to KJ Hardrict for all his hard work synthesizing BMI-I - I’m glad we made the right liquid! Thank you also to Solan Megerssa for his hard work machining many of the components for the TOF amplifier.
Thank you to all of the students, postdocs, and research scientists in the Space Propulsion Lab. I am so grateful to have had the opportunity to work with such amaz-ing people! Thank you in particular to Fernando Mier-Hicks, Carla Perez-Martinez, David Krejci, Tom Coles, Bjarni Kristinsson, Dakota Freeman, and Dan Getty for all of their help with my experiments!
I would also like to thank all of my Aero Astro friends. Thank you to Charlotte Lowey for being such an amazing plant-growing, tea-making friend and office mate! Thank you Angie Crews for being a great friend and for making it fun to stay up late working on problem sets! Thank you to Elaine Petro for all of your support,
encouragement, and enthusiasm over the years - it has been so awesome to work with you!
Thank you to my long-distance friends whom I greatly miss! Nicole DePasquale, thank you for always supporting me on this crazy roller coaster we call life! I would also like to thank Iulia Jivanescu for being such a supportive friend and wonderful office mate. Thank you Samantha Hansen for always keeping it real - Roll Tide!
I would also like to thank the staff at the MIT Medical Mental Health and Coun-seling Center for their support. To help remove the stigma of mental health issues I would like to say that, during a part of my graduate studies, I experienced severe anxiety and needed help to overcome it. I am incredibly grateful for all of the support I have received and I encourage anyone who is struggling to seek help - you are not alone. Thank you to Sara Koch for helping me navigate the valleys and for always reminding me to stay true to myself! Thank you to Beth Szabo for helping me recon-nect with my inner strength and guidance and for inspiring me to believe in a force much greater than myself. Thank you also to all of my Health Yoga Life friends for being amazing, kind souls and for encouraging me to follow my dreams.
I would like to thank my family for their unconditional love and support. Thank you to all of my aunts, uncles, cousins, and grandparents for always cheering me on! Thank you Mom and Dad for believing in me and for always being there for me especially when life was challenging and overwhelming. Caroline, thank you for always encouraging me, making me laugh, and reminding me to be silly! I am so blessed to have you as a sister. Grandpa, the thought never occurred to me that you wouldn’t be there in person for my graduation. Thank you for being my guardian angel - I know that you will be with me always. I love you all so much :)
Last, but certainly not least, I would like to thank Philip. I didn’t think the universe would send someone quite like you into my life so soon, but you said "hi" to me in the elevator of building 37 and the rest is history! I often look at you and feel overwhelmed with gratitude for your presence in my life. Your love, kindness, support, and silliness have been such a blessing. I’m so excited to start a new chapter with you and finally realize our dream of living a quiet life in nature! Je t’aime :)
Contents
1 Introduction 25
1.1 Motivation . . . 25
1.2 Ion Electrospray Propulsion . . . 26
1.3 Focused Ion Beam Applications . . . 29
1.4 Current Electrospray Research . . . 29
1.5 Thesis Objectives and Contributions . . . 30
2 Literature Review 33 2.1 Cone-jet Electrosprays . . . 33
2.2 The Mixed Ion-Droplet Regime . . . 36
2.3 The Pure Ion Regime . . . 37
2.4 Ion Cluster Fragmentation . . . 42
2.5 Thesis Motivation and Objectives . . . 48
3 Analytical and Numerical Modeling of ILIS Beams 51 3.1 Analysis of Ion Beam Dynamics for RPA and TOF Techniques . . . . 52
3.1.1 Dynamics . . . 53
3.1.2 Retarding Potential Analysis . . . 56
3.1.3 Time of Flight Mass Spectrometry . . . 59
3.1.4 Probability of Fragmentation in the Acceleration Region . . . 62
3.2 Performance of Ionic Liquid Ion Sources . . . 70
3.2.2 The Effect of Non-Uniform Beam Composition on Thruster
Per-formance . . . 73
3.2.3 The Effect of Fragmentation on Thruster Performance . . . . 76
3.2.4 The Effect of Fragmentation on Focused Ion Beam ILIS Perfor-mance . . . 80
3.3 Fragmentation Physics . . . 81
3.3.1 Ion Fragmentation Model . . . 81
3.3.2 Ion Fragmentation in the Presence of an External Electric Field 84 3.3.3 Analytical Model of the Acceleration Region Electric Field . . 86
3.3.4 Numerical Model of the Acceleration Region Electric Field . . 88
4 Experimental Methods 95 4.1 Ionic Liquid Selection . . . 96
4.2 Ion Source . . . 98
4.2.1 Material Selection . . . 98
4.2.2 Ion Source Design . . . 99
4.2.3 Temperature Control . . . 103
4.2.4 Ion Beam Pointing . . . 104
4.2.5 Thruster Preparation . . . 105
4.3 Retarding Potential Analysis . . . 107
4.3.1 RPA Geometry . . . 108
4.3.2 Spherical RPA Development . . . 109
4.3.3 Final RPA Design . . . 114
4.3.4 List of Measurement Electronics . . . 119
4.4 Time of Flight Mass Spectrometry . . . 120
4.4.1 TOF Theory . . . 120
4.4.2 TOF Collector . . . 121
4.4.3 TOF Gate . . . 124
4.4.4 TOF Amplifier Electronics . . . 127
4.5 Final Experimental Set-Up . . . 134
4.5.1 Laser Alignment . . . 135
4.5.2 Solenoid Interaction with Ion Beam . . . 136
5 Methods of Experimental Data Analysis 143 5.1 Retarding Potential Analysis . . . 143
5.1.1 RPA Data Collection . . . 143
5.1.2 RPA Data Analysis . . . 143
5.1.3 Measurement of the Fragmentation Rates of Ion Clusters in the Field-Free Region . . . 147
5.1.4 Measurement of the Fragmentation Slopes of Ion Clusters in the Acceleration Region . . . 151
5.2 Time of Flight Mass Spectrometry . . . 157
5.2.1 TOF Data Collection . . . 157
5.2.2 TOF Data Analysis . . . 157
6 Summary of Experimental Results 163 6.1 EMI-FAP Results . . . 164
6.1.1 EMI-FAP RPA Data . . . 164
6.1.2 EMI-FAP TOF Data . . . 168
6.2 EMI-Im Results . . . 171
6.2.1 EMI-Im RPA Data . . . 171
6.2.2 EMI-Im TOF Data . . . 174
6.3 EMI-BF4 Results . . . 175
6.3.1 EMI-BF4 RPA Data . . . 175
6.3.2 EMI-BF4 TOF Data . . . 178
6.4 BMI-I Results . . . 181
6.4.1 BMI-I RPA Data . . . 181
6.4.2 BMI-I TOF Data . . . 184
6.5 EMI-BF4 Results for Varying Temperatures . . . 186
7 Analysis and Discussion 191
7.1 Fragmentation in the Acceleration Region . . . 191
7.2 Fragmentation in the Field-Free Region . . . 197
7.3 Estimation of Ion Temperature . . . 201
7.4 Temperature Dependence of Dimer Fragmentation Rates . . . 203
7.5 Acceleration Region Fragmentation Model . . . 205
8 Conclusions and Future Work 213 8.1 Summary and Conclusions . . . 213
8.2 Thesis Contributions . . . 216
8.3 Future Work . . . 216
A Ionic Liquid Properties 219 B Derivation of the Polydispersive Efficiency of ILIS Beams 221 C Spreading in Spherical RPA Measurements 225 D RPA Secondary Electron Model 229 E TOF Circuit Diagrams 239 F Supplementary RPA Data 245 F.1 EMI-FAP . . . 246
F.2 EMI-Im . . . 252
F.3 EMI-BF4 . . . 256
F.4 BMI-I . . . 260
List of Figures
1-1 Ion electrospray thruster schematic. [15] . . . . 27
2-1 Single capillary colloid thruster. . . 35
2-2 1-ethyl-3-methylimidazolium tetrafluoroborate. [16, 17, 58] . . . . 38
2-3 Tungsten needle single emitter ILIS.[59] . . . 40
2-4 Monomers and dimers for EMI-BF4. [16, 17, 58] . . . 42
2-5 Fragmentation of a negative EMI-BF4 dimer. [16, 17, 58] . . . 43
2-6 Molecular structure of various anions. [17, 57] . . . 47
3-1 Diagram of the acceleration region in an ionic liquid ion source. . . . 52
3-2 Idealized RPA curves.[59] . . . 59
3-3 Idealized TOF curves. . . 62
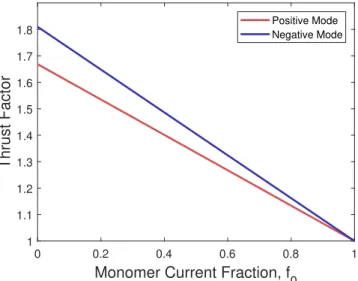
3-4 Effect of beam composition on EMI-BF4 ILIS thrust. . . 75
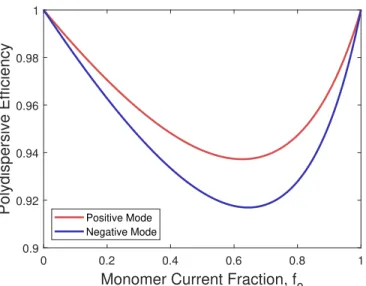
3-5 Effect of beam composition on EMI-BF4 ILIS efficiency. . . 76
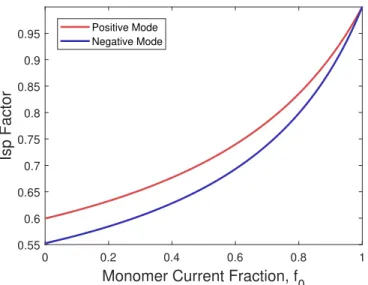
3-6 Effect of beam composition on EMI-BF4 ILIS specific impulse. . . 77
3-7 Effect of fragmentation on EMI-BF4 performance. . . 79
3-8 Effect of ion energy on Einzel lens focal distance. . . 80
3-9 Dimer temperature as a function of mean lifetime. [80] . . . . 83
3-10 Schematic of the mirror charge model for ion evaporation. . . 85
3-11 Diagram of prolate spheroidal coordinate system. [51] . . . . 87
3-12 Electric field and electric potential distribution in the acceleration re-gion: Analytical model. . . 88
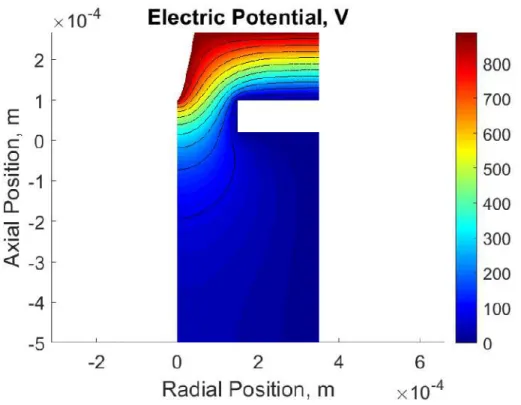
3-14 Electric potential distribution within the acceleration region of an ion
electrospray thruster. . . 90
3-15 Electric field and electric potential distribution in the acceleration re-gion: Numerical model. . . 91
3-16 Diagram of a Taylor cone. . . 92
3-17 Electric field as a function of distance from the emission region. . . . 93
4-1 Parameter space of ionic liquid ions. . . 97
4-2 Molecular structure of anions for the selected ionic liquids. [17, 57] . . . 98
4-3 Molecular structure of cations for the selected ionic liquids.[17, 57] . . 98
4-4 Scanning electron microscope images of an externally wetted tungsten needle. . . 100
4-5 Schematic of an ion Electrospray Propulsion System. [37] . . . 100
4-6 Photos of thruster preparation: (a) raw material with skin (before sanding), (b) after sanding, (c) on silicon frame. . . 101
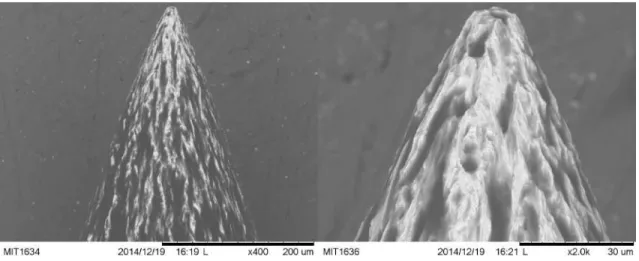
4-7 Images of a patterned thruster. . . 102
4-8 SEM images of a single emitter tip. . . 102
4-9 Schematic of the temperature control circuit. [57] . . . . 103
4-10 Photograph of an ion electrospray thruster on the anodized test mount. 104 4-11 Ion source mounted to the vacuum chamber flange. . . 106
4-12 Retarding potential analyzer with planar grids. [59] . . . 107
4-13 Fully spherical RPA. . . 110
4-14 Mixed geometry RPA with spherical retarding grids. [59] . . . 111
4-15 RPA with mixed geometry. . . 111
4-16 RPA scans for an EMI-BF4 ILIS at 1800 V. [59] . . . 112
4-17 RPA scans for an EMI-BF4 ILIS at various electron repelling grid volt-ages. . . 113
4-18 RPA with mixed geometry and high transparency grids. . . 113
4-19 High-transparency mixed geometry RPA scans for varying electron re-pelling grid voltages in 1V increments. . . 114
4-20 Spherical RPA with high transparency tungsten grids. . . 115
4-21 Side view of spherical RPA with high transparency tungsten grids in mounting rings. . . 116
4-22 Solenoid assembly used for opening and closing RPA collector aperture (door closed). . . 116
4-23 Solenoid assembly used for opening and closing RPA collector aperture (door open). . . 117
4-24 Spherical RPA scans for varying electron repelling grid voltages. . . . 118
4-25 Spherical RPA scans for a shielded and unshielded source. . . 118
4-26 Time of flight mass spectrometry for ILIS characterization. [58] . . . . 120
4-27 Schematic of a Channeltron electron multiplier. [57] . . . . 123
4-28 Photograph of the Channeltron 5900 Magnum electron multiplier. [57] 124 4-29 Photograph of the TOF detector before it was mounted to the cham-ber.[57] . . . 125
4-30 Schematic of a deflector gate. [57] . . . 125
4-31 Time of flight gate. [57] . . . 126
4-32 Circuit schematic for Channeltron electron multiplier in positive ion detection mode. [57] . . . . 128
4-33 Circuit schematic for Channeltron electron multiplier in negative ion detection mode. [57] . . . . 128
4-34 Circuit schematic for TOF amplifier with high voltage isolation. [57] . 129 4-35 Conceptual schematics of time of flight measurement electronics. . . . 130
4-36 Time of flight measurement electronics. . . 131
4-37 Step response of time of flight amplifier. . . 132
4-38 Linearity response of time of flight amplifier. . . 133
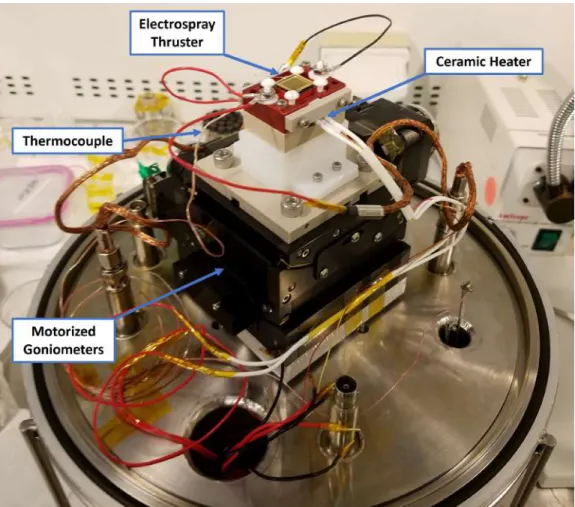
4-39 Schematic of experimental set-up. . . 135
4-40 Experimental instrumentation viewed from the side. . . 137
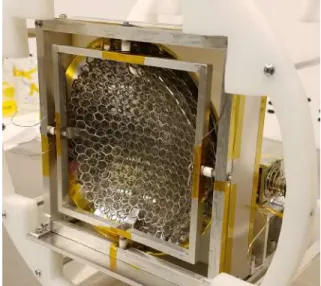
4-41 Experimental instrumentation viewed from the back. . . 138
4-42 Experimental instrumentation in the vacuum chamber viewed from the front. . . 139
4-43 Experimental instrumentation in the vacuum chamber viewed from the
back. . . 140
4-44 Laser alignment tools. . . 141
4-45 Laser alignment confirmation. . . 141
5-1 Smoothing spline fit of RPA monoenergetic step. . . 145
5-2 Derivatives of the monoenergetic step. . . 145
5-3 Analyzed RPA curve: field-free region fragmentation. . . 146
5-4 Analyzed RPA curve with steps marked. . . 146
5-5 Idealized RPA curves at various source-to-detector distances. [59] . . . 148
5-6 Fragmentation of EMI-BF4 dimers in field-free space.[59] . . . 149
5-7 RPA curves at various source to detector distances for EMI-BF4 oper-ating at 𝑇 = 30∘C, 𝑉 = 859V, and 𝐼 = 324nA. . . 150
5-8 Height of dimer to monomer fragmentation step as a function of distance.151 5-9 Fitted RPA curves for regions of fragmentation in the acceleration region.152 5-10 Acceleration region electric field and ion trajectory. . . 153
5-11 Percentage of dimers that fragment in the acceleration region. Note that the solid line corresponds to potentials for which the measured fragmentation slope is valid. . . 154
5-12 Rate of fragmentation and approximate lifetime of dimers in the accel-eration region. . . 155
5-13 Theoretically estimated rate of fragmentation and approximate lifetime of dimers in the acceleration region. . . 156
5-14 Fits of TOF curves: monoenergetic species. . . 160
5-15 Fits of TOF curves: broken ions. . . 160
5-16 Analyzed TOF curve with steps marked. "AR" designates acceleration region and "FF" designates field-free region. . . 161
6-1 RPA curves at various source to detector distances for EMI-FAP op-erating at 𝑇 = 60∘C, 𝑉 = 809V, and 𝐼 = 84nA. . . 164
6-2 Field-free region fragmentation curves for EMI-FAP operating at 𝑇 = 60∘C, 𝑉 = 809V, and 𝐼 = 84nA. . . 165 6-3 RPA curves at various source to detector distances for EMI-FAP
op-erating at 𝑇 = 60∘C, 𝑉 = −778V, and 𝐼 = −49nA. . . 166 6-4 Field-free region fragmentation curves for EMI-FAP operating at 𝑇 =
60∘C, 𝑉 = −778V, and 𝐼 = −49nA. . . 166 6-5 Time of flight curve for EMI-FAP operating at 𝑇 = 30∘C, 𝑉 = 809V,
and 𝐼 = 89nA. . . 168 6-6 Time of flight curve for EMI-FAP operating at 𝑇 = 30∘C, 𝑉 = 778V,
and 𝐼 = 77nA. . . 168 6-7 Time of flight curve for EMI-FAP operating at 𝑇 = 60∘C, 𝑉 = 809V,
and 𝐼 = 91nA. . . 169 6-8 Time of flight curve for EMI-FAP operating at 𝑇 = 60∘C, 𝑉 = 859V,
and 𝐼 = 103nA. . . 169 6-9 RPA curves at various source to detector distances for EMI-Im
oper-ating at 𝑇 = 30∘C, 𝑉 = 767V, and 𝐼 = 351nA. . . 171 6-10 Field-free region fragmentation curves for EMI-Im operating at 𝑇 =
30∘C, 𝑉 = 767V, and 𝐼 = 351nA. . . 172 6-11 RPA curves at various source to detector distances for EMI-Im
oper-ating at 𝑇 = 30∘C, 𝑉 = −759V, and 𝐼 = −281nA. . . 172 6-12 Field-free region fragmentation curves for EMI-Im operating at 𝑇 =
30∘C, 𝑉 = −759V, and 𝐼 = −281nA. . . 173 6-13 Time of flight curve for EMI-Im operating at 𝑇 = 30∘C, 𝑉 = 656V,
and 𝐼 = 154nA. . . 174 6-14 RPA curves at various source to detector distances for EMI-BF4
oper-ating at 𝑇 = 30∘C, 𝑉 = 859V, and 𝐼 = 324nA. . . 175 6-15 Field-free region fragmentation curves for EMI-BF4 operating at 𝑇 =
30∘C, 𝑉 = 859V, and 𝐼 = 324nA. . . 176 6-16 RPA curves at various source to detector distances for EMI-BF4
6-17 Field-free region fragmentation curves for EMI-BF4 operating at 𝑇 =
30∘C, 𝑉 = −859V, and 𝐼 = −319nA. . . 177 6-18 Time of flight curve for EMI-BF4 operating at 𝑇 = 30∘C, 𝑉 = 859V,
and 𝐼 = 318nA. . . 178 6-19 Time of flight curve for EMI-BF4 operating at 𝑇 = 30∘C, 𝑉 = 940V,
and 𝐼 = 462nA. . . 178 6-20 Time of flight curve for EMI-BF4 operating at 𝑇 = 30∘C, 𝑉 = −859V,
and 𝐼 = −281nA. . . 179 6-21 Time of flight curve for EMI-BF4 operating at 𝑇 = 30∘C, 𝑉 = −940V,
and 𝐼 = −438nA. . . 179 6-22 RPA curves at various source to detector distances for BMI-I operating
at 𝑇 = 50∘C, 𝑉 = 757V, and 𝐼 = 198nA. . . 181 6-23 Field-free region fragmentation curves for BMI-I operating at 𝑇 =
50∘C, 𝑉 = 757V, and 𝐼 = 198nA. . . 182 6-24 RPA curves at various source to detector distances for BMI-I operating
at 𝑇 = 50∘C, 𝑉 = −759V, and 𝐼 = −172nA. . . 182 6-25 Field-free region fragmentation curves for BMI-I operating at 𝑇 =
50∘C, 𝑉 = −759V, and 𝐼 = −172nA. . . 183 6-26 Time of flight curve for BMI-I operating at 𝑇 = 50∘C, 𝑉 = 656V, and
𝐼 = 113nA. . . 184 6-27 Time of flight curve for BMI-I operating at 𝑇 = 50∘C, 𝑉 = 757V, and
𝐼 = 195nA. . . 184 6-28 RPA curves at various source to detector distances for EMI-BF4
oper-ating at 𝑇 = 30∘C, 𝑉 = 718V, and 𝐼 = 314nA. . . 186 6-29 Field-free region fragmentation curves for EMI-BF4 operating at 𝑇 =
30∘C, 𝑉 = 718V, and 𝐼 = 314nA. . . 187 6-30 RPA curves at various source to detector distances for EMI-BF4
oper-ating at 𝑇 = 30∘C, 𝑉 = −697V, and 𝐼 = −215nA. . . 187 6-31 Field-free region fragmentation curves for EMI-BF4 operating at 𝑇 =
7-1 Current fraction of fragmentation (all types) in the acceleration region for various ionic liquids. . . 192 7-2 Current fraction of heavy ion fragmentation in the acceleration region
for various ionic liquids. . . 192 7-3 Current fraction of trimer to dimer to monomer fragmentation for
var-ious ionic liquids. . . 193 7-4 Current fraction of trimer to dimer to monomer fragmentation for
var-ious ionic liquids. . . 194 7-5 Dimer rate of fragmentation in the acceleration region for various ionic
liquids. . . 194 7-6 Monoenergetic fraction of the ion beam for various ionic liquids. . . . 195 7-7 Scaled dimer rate of fragmentation in the acceleration region for various
ionic liquids. . . 196 7-8 Scaled dimer rate of fragmentation in the acceleration region as a
func-tion of anion degrees of freedom. . . 197 7-9 Mean lifetimes of dimers in the field-free region for various ionic liquids.197 7-10 Mean lifetimes of dimers in the field-free region as a function of anion
degrees of freedom. . . 199 7-11 Current fraction of dimers at the start of the field-free region for various
ionic liquids. . . 200 7-12 Estimated beam fraction of dimers for various ionic liquids. . . 200 7-13 Mean lifetimes of dimers in the field-free region for EMI-FAP at various
temperatures. . . 203 7-14 Mean lifetimes of dimers in the field-free region for EMI-BF4 at various
temperatures. . . 204 7-15 Model of electric potential and electric field in the acceleration region. 205 7-16 Mean rate of dimer fragmentation in the acceleration region as a
func-tion of flight distance for various ionic liquids. . . 206 7-17 Dimer mean lifetime in the acceleration region for various ionic liquids. 207
7-18 Mean rate of dimer fragmentation in the acceleration region as a
func-tion of electric field for various ionic liquids. . . 207
7-19 Amount of dimer fragmentation in the acceleration region as a function of flight distance for various ionic liquids. . . 208
7-20 Amount of dimer fragmentation in the acceleration region as a function of potential drop for various ionic liquids. . . 210
7-21 Mean rate of dimer fragmentation in the acceleration region as a func-tion of potential drop for various ionic liquids. . . 210
7-22 Residence time as a function of flight distance for various ionic liquids. 212 C-1 Schematic of ion beam geometry at non-optimal distance from a spher-ical RPA. . . 226
C-2 Idealized spherical RPA scans for a monoenergetic ion beam with var-ious spacings between the source and detector. . . 228
D-1 High-transparency mixed geometry RPA scans for varying electron re-pelling grid voltages in 1V increments. . . 230
D-2 Ion energy distribution in the form of an RPA curve used as an input to the model. . . 234
D-3 Effective secondary electron emission coefficient as a function of im-pacting particle energy for the mixed geometry RPA. . . 235
D-4 Estimated mixed geometry RPA measurement predicted by the model. 236 D-5 Spherical RPA scans for varying electron repelling grid voltages. . . . 236
D-6 EFfective secondary electron emission coefficient as a function of im-pacting particle energy for the spherical RPA. . . 237
D-7 Estimated spherical geometry RPA measurement predicted by the model.237 E-1 High voltage LED amplifier circuit. . . 240
E-2 High voltage LED linear voltage regulator circuit. . . 241
E-3 High voltage amplifier power supply circuits. . . 242
F-1 RPA curves at various source to detector distances for EMI-FAP op-erating at 𝑇 = 30∘C, 𝑉 = 888V, and 𝐼 = 73nA. . . 246 F-2 Field-free region fragmentation curves for EMI-FAP operating at 𝑇 =
30∘C, 𝑉 = 888V, and 𝐼 = 73nA. . . 246 F-3 RPA curves at various source to detector distances for EMI-FAP
op-erating at 𝑇 = 30∘C, 𝑉 = −859V, and 𝐼 = −35nA. . . 247 F-4 Field-free region fragmentation curves for EMI-FAP operating at 𝑇 =
30∘C, 𝑉 = −859V, and 𝐼 = −35nA. . . 247 F-5 RPA curves at various source to detector distances for EMI-FAP
op-erating at 𝑇 = 40∘C, 𝑉 = 910V, and 𝐼 = 92nA. . . 248 F-6 Field-free region fragmentation curves for EMI-FAP operating at 𝑇 =
40∘C, 𝑉 = 910V, and 𝐼 = 92nA. . . 248 F-7 RPA curves at various source to detector distances for EMI-FAP
op-erating at 𝑇 = 40∘C, 𝑉 = −808V, and 𝐼 = −39nA. . . 249 F-8 Field-free region fragmentation curves for EMI-FAP operating at 𝑇 =
40∘C, 𝑉 = −808V, and 𝐼 = −39nA. . . 249 F-9 RPA curves at various source to detector distances for EMI-FAP
op-erating at 𝑇 = 60∘C, 𝑉 = 809V, and 𝐼 = 84nA. . . 250 F-10 Field-free region fragmentation curves for EMI-FAP operating at 𝑇 =
60∘C, 𝑉 = 809V, and 𝐼 = 84nA. . . 250 F-11 RPA curves at various source to detector distances for EMI-FAP
op-erating at 𝑇 = 60∘C, 𝑉 = −778V, and 𝐼 = −49nA. . . 251 F-12 Field-free region fragmentation curves for EMI-FAP operating at 𝑇 =
60∘C, 𝑉 = −778V, and 𝐼 = −49nA. . . 251 F-13 RPA curves at various source to detector distances for EMI-Im
oper-ating at 𝑇 = 30∘C, 𝑉 = 656V, and 𝐼 = 158nA. . . 252 F-14 Field-free region fragmentation curves for EMI-Im operating at 𝑇 =
30∘C, 𝑉 = 656V, and 𝐼 = 158nA. . . 252 F-15 RPA curves at various source to detector distances for EMI-Im
F-16 Field-free region fragmentation curves for EMI-Im operating at 𝑇 = 30∘C, 𝑉 = −658V, and 𝐼 = −131nA. . . 253 F-17 RPA curves at various source to detector distances for EMI-Im
oper-ating at 𝑇 = 30∘C, 𝑉 = 767V, and 𝐼 = 351nA. . . 254 F-18 Field-free region fragmentation curves for EMI-Im operating at 𝑇 =
30∘C, 𝑉 = 767V, and 𝐼 = 351nA. . . 254 F-19 RPA curves at various source to detector distances for EMI-Im
oper-ating at 𝑇 = 30∘C, 𝑉 = −759V, and 𝐼 = −281nA. . . 255 F-20 Field-free region fragmentation curves for EMI-Im operating at 𝑇 =
30∘C, 𝑉 = −759V, and 𝐼 = −281nA. . . 255 F-21 RPA curves at various source to detector distances for EMI-BF4
oper-ating at 𝑇 = 30∘C, 𝑉 = 859V, and 𝐼 = 324nA. . . 256 F-22 Field-free region fragmentation curves for EMI-BF4 operating at 𝑇 =
30∘C, 𝑉 = 859V, and 𝐼 = 324nA. . . 256 F-23 RPA curves at various source to detector distances for EMI-BF4
oper-ating at 𝑇 = 30∘C, 𝑉 = −859V, and 𝐼 = −319nA. . . 257 F-24 Field-free region fragmentation curves for EMI-BF4 operating at 𝑇 =
30∘C, 𝑉 = −859V, and 𝐼 = −319nA. . . 257 F-25 RPA curves at various source to detector distances for EMI-BF4
oper-ating at 𝑇 = 30∘C, 𝑉 = 940V, and 𝐼 = 490nA. . . 258 F-26 Field-free region fragmentation curves for EMI-BF4 operating at 𝑇 =
30∘C, 𝑉 = 940V, and 𝐼 = 490nA. . . 258 F-27 RPA curves at various source to detector distances for EMI-BF4
oper-ating at 𝑇 = 30∘C, 𝑉 = −939V, and 𝐼 = −500nA. . . 259 F-28 Field-free region fragmentation curves for EMI-BF4 operating at 𝑇 =
30∘C, 𝑉 = −939V, and 𝐼 = −500nA. . . 259 F-29 RPA curves at various source to detector distances for BMI-I operating
at 𝑇 = 50∘C, 𝑉 = 656V, and 𝐼 = 113nA. . . 260 F-30 Field-free region fragmentation curves for BMI-I operating at 𝑇 =
F-31 RPA curves at various source to detector distances for BMI-I operating at 𝑇 = 50∘C, 𝑉 = −648V, and 𝐼 = −78nA. . . 261 F-32 Field-free region fragmentation curves for BMI-I operating at 𝑇 =
50∘C, 𝑉 = −648V, and 𝐼 = −78nA. . . 261 F-33 RPA curves at various source to detector distances for BMI-I operating
at 𝑇 = 50∘C, 𝑉 = 757V, and 𝐼 = 198nA. . . 262 F-34 Field-free region fragmentation curves for BMI-I operating at 𝑇 =
50∘C, 𝑉 = 757V, and 𝐼 = 198nA. . . 262 F-35 RPA curves at various source to detector distances for BMI-I operating
at 𝑇 = 50∘C, 𝑉 = −759V, and 𝐼 = −172nA. . . 263 F-36 Field-free region fragmentation curves for BMI-I operating at 𝑇 =
50∘C, 𝑉 = −759V, and 𝐼 = −172nA. . . 263 F-37 RPA curves at various source to detector distances for EMI-BF4
oper-ating at 𝑇 = 30∘C, 𝑉 = 718V, and 𝐼 = 314nA. . . 264 F-38 Field-free region fragmentation curves for EMI-BF4 operating at 𝑇 =
30∘C, 𝑉 = 718V, and 𝐼 = 314nA. . . 264 F-39 RPA curves at various source to detector distances for EMI-BF4
oper-ating at 𝑇 = 30∘C, 𝑉 = −697V, and 𝐼 = −215nA. . . 265 F-40 Field-free region fragmentation curves for EMI-BF4 operating at 𝑇 =
30∘C, 𝑉 = −697V, and 𝐼 = −215nA. . . 265 F-41 RPA curves at various source to detector distances for EMI-BF4
oper-ating at 𝑇 = 50∘C, 𝑉 = 716V, and 𝐼 = 396nA. . . 266 F-42 Field-free region fragmentation curves for EMI-BF4 operating at 𝑇 =
50∘C, 𝑉 = 716V, and 𝐼 = 396nA. . . 266 F-43 RPA curves at various source to detector distances for EMI-BF4
oper-ating at 𝑇 = 50∘C, 𝑉 = −698V, and 𝐼 = −321nA. . . 267 F-44 Field-free region fragmentation curves for EMI-BF4 operating at 𝑇 =
50∘C, 𝑉 = −698V, and 𝐼 = −321nA. . . 267 F-45 RPA curves at various source to detector distances for EMI-BF4
F-46 Field-free region fragmentation curves for EMI-BF4 operating at 𝑇 =
50∘C, 𝑉 = 786V, and 𝐼 = 627nA. . . 268 F-47 RPA curves at various source to detector distances for EMI-BF4
oper-ating at 𝑇 = 50∘C, 𝑉 = −770V, and 𝐼 = −550nA. . . 269 F-48 Field-free region fragmentation curves for EMI-BF4 operating at 𝑇 =
50∘C, 𝑉 = −770V, and 𝐼 = −550nA. . . 269 F-49 RPA curves at various source to detector distances for EMI-BF4
oper-ating at 𝑇 = 70∘C, 𝑉 = 744V, and 𝐼 = 632nA. . . 270 F-50 Field-free region fragmentation curves for EMI-BF4 operating at 𝑇 =
70∘C, 𝑉 = 744V, and 𝐼 = 632nA. . . 270 F-51 RPA curves at various source to detector distances for EMI-BF4
oper-ating at 𝑇 = 70∘C, 𝑉 = −715V, and 𝐼 = −526nA. . . 271 F-52 Field-free region fragmentation curves for EMI-BF4 operating at 𝑇 =
List of Tables
2.1 Properties of common ionic liquids. [18] . . . . 39
2.2 Summary of past dimer fragmentation measurements. [16, 17, 24, 49] . . 47
3.1 Summary of evaporation kinetics measurements of dimers.[80] . . . . 83
4.1 Properties of potential ionic liquids. [18] . . . . 96
4.2 Instruments used for RPA measurements. . . 119 4.3 TOF amplifier component properties. . . 132 4.4 Instruments used for TOF measurements . . . 134
6.1 Dimer fragmentation data for EMI-FAP in the field-free region. . . . 167 6.2 Dimer fragmentation data for EMI-FAP in the acceleration region. . . 167 6.3 TOF-derived beam composition for EMI-FAP. . . 170 6.4 Dimer fragmentation data for EMI-Im in the field-free region. . . 173 6.5 Dimer fragmentation data for EMI-Im in the acceleration region. . . . 173 6.6 TOF-derived beam composition for EMI-Im. . . 174 6.7 Dimer fragmentation data for EMI-BF4 in the field-free region. . . 177
6.8 Dimer fragmentation data for EMI-BF4 in the acceleration region. . . 177
6.9 TOF-derived beam composition for EMI-BF4. . . 180
6.10 Dimer fragmentation data for BMI-I in the field-free region. . . 183 6.11 Dimer fragmentation data for BMI-I in the acceleration region. . . 183 6.12 TOF-derived beam composition for BMI-I. . . 185 6.13 Dimer fragmentation data for supplementary EMI-BF4 in the field-free
6.14 Dimer fragmentation data for supplementary EMI-BF4 in the
acceler-ation region. . . 189
7.1 Estimated temperature of EMI-FAP dimers. . . 202 7.2 Estimated temperature of EMI-Im dimers. . . 202 7.3 Dimer fragmentation slopes for EMI-FAP in the acceleration region. . 211 7.4 Dimer fragmentation slopes for EMI-Im in the acceleration region. . . 211
A.1 Bulk properties of tested ionic liquids. . . 219 A.2 Ionic liquid ion properties. [18] . . . . 220
Chapter 1
Introduction
There is nothing in a caterpillar that tells you it’s going to be a butterfly.
R. Buckminster Fuller
1.1
Motivation
Since the late 1990s it has become possible to scale down the vast majority of space-craft subsystems to smaller sizes and power levels. Satellites that can be held by a single human hand have now become a reality, creating a paradigm shift in spacecraft design. Microsatellites and nanosatellites can have many of the same capabilities as previous generations of much larger spacecraft at significantly lower cost. Cubesats, satellites based on modular 10 cm cubes, provide a standard platform for nanosatellite development achievable with modest budgets. Universities and small companies now have access to space, something not possible without the miniaturization of electron-ics. Microsatellites and nanosatellites allow for the rapid development and testing of new technologies in space, bringing in a new era of space exploration.
Of the hundreds of Cubesats that have flown in space, few have had propulsion systems[65]. It is extremely challenging to scale down propulsion systems to sizes and power levels compatible with microsatellites and nanosatellites. Electric propulsion (EP) is likely the best choice for most small satellite missions since it offers higher
payload mass fractions than chemical propulsion. While chemical rockets can pro-vide high thrust for impulsive maneuvers, they require high propellant mass fractions as well as complicated and bulky propellant storage and feed systems. In contrast, electric propulsion thrusters are naturally fuel efficient. However, since the electric power on-board a spacecraft is limited, they are used for low-acceleration, constant thrust maneuvers over long periods of time. EP is also safer since energetic chemicals are not used as propellants. Electric propulsion can be used on microsatellites and nanosatellites for main propulsion as well as attitude control, which would dramati-cally enhance their capabilities and broaden their potential mission objectives.
The most mature electric propulsion technologies are gridded electrostatic ion thrusters and Hall Effect thrusters. Both technologies use noble gases such as xenon or argon as propellant, which require pressurized tanks and an active propellant feed system. The gas is ionized in a large region, called the ionization chamber, using either energetic electrons from a cathode or electromagnetic radiation from a radio antenna. The ions are accelerated to high velocities using an electrostatic field, producing low thrust at high specific impulse. To scale down ion engines, Hall thrusters, and other plasma propulsion devices, the plasma density must be increased in order to maintain the same ionization fraction [36]. A high density plasma environment within the thruster leads to increased frequency of particle collisions with the internal surfaces, enhancing erosion rates. Most plasma thrusters require the use of magnetic fields for electron confinement, which must be made stronger when scaling down to small sizes[36], adding another challenge to the design of plasma thrusters for microsatellites. As a result, scaled down ion engines and Hall thrusters suffer from reduced system lifetime and efficiency [36], a major drawback that motivates the development of new microelectric propulsion technologies.
1.2
Ion Electrospray Propulsion
Ion electrospray propulsion is naturally suited to small scales, offering an attractive solution for microsatellites and nanosatellites. Ion electrospray thrusters use
electro-static fields to accelerate ions to high velocities just as ion engines and Hall thrusters do. The key difference is that ion electrospray thrusters use novel substances called ionic liquids as propellant instead of a neutral gas. Ionic liquids are molten salts at room temperature that consist entirely of positive and negative molecular ions. Very strong electric fields, on the order of 1 billion volts per meter, can be used to induce field-evaporation of ions from the liquid surface [47]. The free ions can then
be accelerated to high velocities using the same electric field, producing thrust. The ion electrospray thrusters developed at the MIT Space Propulsion Lab consist of an array of hundreds of sharp tips, ∼100 micrometers in size, etched into a 1 cm2, 1 mm thick chip of porous material that is internally wetted by the ionic liquid propellant. Figure 1-1 shows a schematic of an ion electrospray thruster with only 9 tips to bet-ter illustrate the design [15]. An extractor plate with hundreds of apertures, one for
each tip, is placed less than 100 micrometers from the porous substrate. Modest voltages, on the order of 1 kilovolt, applied between the tips and extractor are used to fire the thruster since the sharp emitter geometry enhances the local electric field. Ion evaporation occurs at a highly localized region within a radius of a few tens of nanometers at the tip. As a result, ion electrospray thrusters are well-suited to small scale applications.
Figure 1-1: Ion electrospray thruster schematic. [15]
Ion electrospray thrusters have many advantages over traditional plasma thrusters. They do not require bulky pressurized gas tanks, a large ionization chamber, or magnetic fields. The propellant feed system for ion electrospray thrusters is passive,
which is a much simpler, more efficient design than the active feed systems required by plasma thrusters. Since the ions are already available in the liquid, ion electrospray thrusters do not have to pay the cost of ionization that plasma thrusters do. Also ion electrospray thrusters do not require a neutralizer, which consumes most of the power in plasma thrusters. Both positive and negative voltages can be applied to ion electrospray thrusters, which results in the extraction of either positive or negative ions. By alternating the polarity, a net neutral beam can be achieved [46]. This is a vastly different situation from plasma thrusters, which emit positive ions that must be neutralized by an electron beam. Since ion electrospray thrusters can operate in both polarities, very little propellant is wasted. The utilization efficiency of ion engine and Hall thruster plasmas is typically less than 80%, so neutral gas slowly leaks out of the thruster, which is a waste of propellant that negatively impacts the efficiency and specific impulse. Finally ion electrospray thrusters are highly volume efficient, much better than plasma thrusters [43]. Therefore ion electrospray thrusters have the
potential to revolutionize the propulsive capabilities of microsatellites.
Cubesats and microsatellites could accomplish more advanced missions spanning longer durations if they had propulsion systems. Most Cubesats are deployed in low Earth orbit where they experience atmospheric drag that de-orbits the space-craft after several months to a year. Ion electrospray propulsion could provide low thrust over long periods of time to compensate for the drag and extend the lifespan of Cubesats [20]. Additionally Cubesats launched to higher orbits need a de-orbiting mechanism at the end of their mission, something that could be accomplished using ion electrospray thrusters [5]. Main propulsion enables orbit changes as well as inter-planetary trajectories. A Cubesat with ion electrospray thrusters could spiral climb to geostationary orbit, to the Moon, to Mars, and perhaps beyond. The thrusters can also be used for attitude control and fine positioning, allowing for precision pointing of instruments, drag-free spaceflight, and formation flight. The potential mission objec-tives enabled by micropropulsion span an enormous range and could be accomplished at low cost with only a few years of development time.
1.3
Focused Ion Beam Applications
Ion electrospray technology can also be used on Earth in focused ion beam (FIB) applications for micromachining, material deposition, and imaging[88, 64]. Ionic liquid
ion source ion beams spread spherically outwards from the emitter tip with a half angle of ∼ 20∘ [47]. Ion beams can be focused to small spot sizes using electrostatic lenses. The spot size determines the size of features that can be micromachined as well as the size of features that can be imaged. Recent work by Perez-Martinez estimates that ILIS beams could be focused to sub-100 nm spot sizes [64]. Perez-Martinez also demonstrated that an ILIS can be used to etch materials such as gold, silicon, and gallium nitride. Ionic liquid ion sources are of particular interest for focused ion beam applications because there is an abundance of ionic liquid ion species available [64].
Ionic liquids can be selected based on the properties of the ions, such as reactivity, for a particular FIB application.
1.4
Current Electrospray Research
Current research is focused on improving the lifetime and efficiency of ion electrospray thrusters. The latest generation of thrusters developed at MIT have 480 tips etched into a 1 cm2 piece of porous borosilicate glass housed in a 1 mm thick micromachined silicon frame [15, 37]. The longest firing duration is approximately 172 hours and
the propulsive efficiency is 36% when using EMI-BF4 as a propellant [38]. Many of
the performance losses can be attributed to the porous glass material, which has non-uniformities and large pores [37]. The larger pores allow for higher liquid flow rates than desired, which facilitates the emission of charged droplets instead of pure ions [69]. The presence of heavy droplets in the thruster exhaust leads to reduced specific impulse and efficiency [37, 45]. Additionally, the large flow rates result in hot
spots of high emission current that can cause erosion of the extractor grid as well as shorts between the tips and the extractor [32]. Both are potential life-limiting
focused on the development and testing of new porous materials more well-suited for ion electrospray thrusters. Recently carbon xerogels have been used successfully in single emitter ionic liquid ion sources [64]. Carbon xerogels are highly uniform and have smaller pores than borosilicate glass, making them a potential solution for improving thruster lifetime and efficiency.
In addition to the ongoing materials science research, work is focused on the fun-damental science of ionic liquid ion sources (ILIS). ILIS beams typically consist of pure ions as well as ion clusters of various sizes [47]. The ion clusters are metastable and can break apart mid-flight before they exit the thruster, a process referred to in this thesis as fragmentation [49]. Different ionic liquids produce ILIS beams with dif-fering compositions and amounts of fragmentation[16, 24, 49, 57], which leads to varying
levels of thruster performance [17, 48]. The relationship between the beam character-istics, particularly fragmentation, and ionic liquid properties is not well understood and is the focus of this work. The propulsive efficiency, specific impulse, and thrust are functions of the composition of the ion beam and the amount of ion clusters that break apart within the acceleration region. Past computational [17] and experimen-tal[57]investigations support the hypothesis that ion clusters composed of molecularly
complex ions are less likely to break apart than clusters made of simpler ionic species. However to thoroughly address this technical problem, ionic liquids with a wide range of properties must be characterized in the same experimental setup under highly con-trolled and repeatable conditions.
1.5
Thesis Objectives and Contributions
The goal of this thesis is to better understand the physics of fragmentation of ion clusters, with a focus on the relationship between ionic liquid properties and fragmen-tation in ILIS beams. Retarding potential analysis (RPA) will be used to measure the amount of fragmentation and the rates of fragmentation in great detail. Time of flight (TOF) mass spectrometry will be used to determine the composition of the ion beam, which will be used to check the operation regime of the source and
con-tribute to the interpretation of the RPA data. The major experimental challenges are obtaining repeatable and consistent measurements as well as measurements that accurately represent the true beam properties, which is why much research has been dedicated to developing the RPA and TOF detectors. Several ionic liquids that span a wide range of ionic liquid properties will be characterized using the experimental set up. The fragmentation rates both inside and outside the thruster will be determined, such that the stability of ion clusters for various ionic liquids can be compared. Ad-ditionally the temperature dependence of fragmentation rates will be investigated to further understand the fundamental physics of cluster break-up. With an enhanced understanding of the fragmentation process, ionic liquids can be efficiently selected or perhaps designed for particular applications.
The contributions of this thesis are as follows:
∙ Measured the fragmentation rates of dimers in the field-free region for several ionic liquids, the first measurement of its kind. Determined the fragmentation rates of dimers in the acceleration region as a function of the electric potential. Using analytical models, the relationship between the electric field and rate of fragmentation was investigated.
∙ Analytical models were used to investigate the relationship between ion frag-mentation rates and liquid temperature. These models were also used to esti-mate the temperature of evaporated dimers for various ionic liquids.
∙ Investigated the hypothesis about the relationship of ion cluster stability and ion complexity using the high-quality RPA data.
∙ Designed, built, and tested a combined spherical, full-beam retarding potential analyzer and a narrow-beam, high-time-resolution time of flight mass spectrom-eter for the characterization of ionic liquid ion source ion beams. The RPA provides data such that the fragmentation characteristics are clearly distin-guished. The TOF detector is capable of detecting both positive and negative ILIS beams by using a high-bandwidth, high-voltage opto-isolation amplifier that was specifically designed for this application.
Chapter 2
Literature Review
Look deeply into Nature, and then you will understand everything better.
Albert Einstein
2.1
Cone-jet Electrosprays
While ion electrospray propulsion is a cutting-edge micropropulsion technology, droplet-mode electrosprays have been studied for over a century. Scientists observed that when conductive liquids, such as electrolyte solutions, were sufficiently electrically stressed, the liquid surface collapsed into a conical structure ending in a jet spray of liquid [85, 86]. It was not until the 1960s that a theory was developed to explain the
conical structure. G. I. Taylor supposed that the liquid cone forms as a result of the perfect balance between the surface tension pressure of the liquid and the electrostatic pressure of the applied field [77]:
1 2𝜖0𝐸𝜃
2 = 𝛾∇ · ⃗𝑛 (2.1)
where 𝜖0 is the electrical permittivity of free space, 𝐸𝜃 is the electric field normal to
the liquid surface, 𝛾 is the surface tension of the liquid, and ⃗𝑛 is the surface normal vector. He found that an equilibrium solution existed for any liquid and any applied
voltage: an equipotential cone with a half angle 𝛼 = 49.3∘, now referred to as a Taylor cone [77]. This theoretical prediction was in remarkable agreement with experimental
observations of the time[77].
Taylor’s theory does not account for the dynamic behavior of cone-jet electrosprays since he assumed that the fluid was static. Cone-jet electrosprays operate by the application of back pressure to force liquid through a thin capillary, thus the fluid motion cannot be neglected. Taylor’s solution predicts that the electric field normal to the liquid surface is inversely proportional to the distance from the tip [77]:
𝐸𝜃 =
√︂ 2𝛾 cot 𝛼 𝜖0𝑟
(2.2)
where 𝑟 is the distance from the apex along the liquid surface. This leads to an infi-nite electric field at the tip, a singularity that surely cannot exist in reality. Taylor’s theory assumes that the liquid is a perfect conductor, in which case the charged par-ticles in the fluid can respond to the applied electric field instantaneously. A surface charge layer is immediately formed to everywhere balance the electric field, creating an equipotential surface. However, electrolyte solutions have finite conductivity, so the charges take a non-zero amount of time to respond to the field. Close to the tip, where the fluid velocity is high due to the conservation of mass flow rate, the surface charge layer does not have time to form and the electric pressure dominates. This forces the formation of a liquid jet that breaks up into charged droplets.
Electrosprays were considered as an alternative to gridded electrostatic ion engines for large satellite main propulsion during 1960-1975[51]. Some of the first electrospray
thrusters were developed by Krohn in the early 1960s [39, 40]. Colloid thrusters typi-cally consist of an array of capillary tubes aligned with apertures on a downstream extraction plate as shown in Figure 2-1. Depending on the conditions, a single capil-lary can produce approximately 1 𝜇N of thrust [51]. Thousands of capillary emitters
would be needed to produce the milli-Newton levels of thrust required for spacecraft of that era. At the time, the minimum droplet mass to charge ratio that could be produced with an electrospray was quite high, necessitating the use of high electric
potentials on the order of 10-100 kV for operation [51]. The stringent electrical iso-lation requirements coupled with the lack of micromachining techniques made the design and fabrication of colloid thrusters so challenging that development efforts dwindled by the late 1970s [51]. If micropropulsion had been a desired technology
at that time, perhaps development would have continued. Fortunately electrosprays were studied throughout the 1980s and 1990s for biological applications, resulting in the discovery of electrospray ionization mass spectrometry[26].
Figure 2-1: Single capillary colloid thruster.
Cone-jet electrosprays operating in the pure droplet regime were very well char-acterized by the late 1990s. The current, 𝐼, emitted by an electrospray operating in the droplet mode scales by the following relation [22]:
𝐼 ∝ √︂
𝛾𝑘𝑄
𝜖 (2.3)
where 𝑘 is the electrical conductivity, 𝑄 is the flow rate, and 𝜖 is the electrical per-mittivity. A cone-jet electrospray can be modeled using Taylor’s theory up until the transition region where the fluid residence time is on the order of the charge relax-ation time. The characteristic size of the region where Taylor’s model breaks down is given by [22]: 𝑟* = (︃ 𝜖𝜖0𝑄 𝑘 )︃1/3 (2.4)
the cone apex and by assuming that the charges are fully relaxed to the surface at the transition point. Interestingly the current is independent of the applied voltage, capillary size, and fluid viscosity. The relation in Equation 2.3 was experimentally verified by Fernández de la Mora and Loscertales [22]. Many electrolyte solutions
of varying salt concentrations, or electrical conductivities, were tested in a capillary electrospray. It was found that the non-dimensional current, 𝜉, is proportional to the non-dimensional flow rate, 𝜂, by a factor that depends on the electrical permittivity of the fluid [22]: 𝜉 = 𝑓 (𝜖)𝜂 (2.5) where 𝜉 = 𝐼 𝛾√𝜖0/𝜌 , 𝜂 = √︁ 𝜌𝑘𝑄
𝛾𝜖𝜖0, and 𝜌 is the fluid density. It is quite remarkable that
the behavior of cone-jet electrosprays in the pure droplet mode can be predicted using this simple scaling relation. With further research, scaling laws for the jet diameter and droplet charge to mass ratio distributions were also formulated [23, 27].
At this time it was possible to produce much smaller mass to charge ratio droplets, which reduced operating voltages to a more manageable 1-5 kV [51]. Despite the
lessened electrical isolation requirements, colloid thrusters still faced design challenges due to the volatility of electrolyte solutions. Operation in the vacuum of space would result in evaporation of the propellant at the end of the capillaries. Reducing the capillary diameter to ∼10 micrometers would abate the loss of propellant but at the expense of significant manufacturing challenges[51]. As a result, colloid thrusters were not heavily pursued as an alternative to mature electric propulsion technologies like gridded ion engines. However colloid thrusters using ionic liquid propellants have found a niche in micropropulsion and were used for drag-free spaceflight on the LISA Pathfinder mission [87].
2.2
The Mixed Ion-Droplet Regime
It was observed that under certain conditions, electrosprays of electrolyte solutions emitted ions in addition to charged droplets [40]. This phenomenon, referred to as
tension solutions are electrosprayed at low flow rates[29]. This has been experimentally observed and characterized using retarding potential analysis and time of flight mass spectrometry[28, 29]. Ion emission from charged droplets as well as from the jet break-up region contribute to the total ion current [30, 44, 45].
In the pure droplet regime, the beam current decreases with decreasing flow rate [22]. However, in the mixed ion-droplet regime, at some point the current
in-creases with decreasing flow rate due to the increasing ion current fraction [28]. One
might suppose that a beam of pure ions could be achieved if liquids are electrosprayed at low enough flow rates. However, capillary electrosprays only produce dynamically stable electrified menisci when the non-dimensional flow rate is greater than one[22, 45].
Thus the ion current fraction for a given liquid cannot be increased indefinitely. Un-fortunately the propulsive efficiency of the mixed ion-droplet regime is poor due to the presence of both low mass, high velocity ions and high mass, low velocity droplets in the beam [45]. It was supposed that reducing the flow rate further would allow for
the transition to a beam of pure ions, which would significantly improve performance. However, this was never observed with electrolyte solutions in capillary electrosprays.
2.3
The Pure Ion Regime
Ion evaporation from a liquid surface can be induced by very strong electric fields. The electric field strength required for ion evaporation can be approximated by [53]:
𝐸* ≈ 4𝜋𝜖0 𝑞3 ∆𝐺
2
(2.6)
where 𝜖0 is the permittivity of free space, 𝑞 is the ion charge, and ∆𝐺 is the solvation
energy of the ion. This expression can be found using the mirror charge model in which the work required to remove an ion from the liquid surface is the work required to separate the ion from its image charge [35]. Typical ion solvation energies are on the order of 1 eV, which results in ∼1 billion V/m electric field strengths required for ion evaporation [47].
A pure ion beam emanating from a capillary electrospray was first observed in 2003 by Romero et al. using a room-temperature ionic liquid called EMI-BF4 [69].
EMI-BF4 is short for 1-ethyl-3-methylimidazolium tetrafluoroborate. Both positive
and negative polarities can be applied to the source to extract positive and negative ions respectively. Figure 2-2 shows the molecular structure of EMI-BF4, which is
the most well-tested ionic liquid in ionic liquid ion sources [16, 47, 57, 59]. These
liq-uids, developed in the 1980s and 1990s [83], have many advantageous properties over traditional electrolyte solutions. Ionic liquids have relatively high electrical conduc-tivities on the order of 1 Si/m and negligible vapor pressures, making them suitable for vacuum applications [47]. Table 2.1 lists the chemical compositions of ionic
liq-uids mentioned in this chapter. See Appendix A for an expanded list of ionic liqliq-uids and their properties. When EMI-BF4 was used in a capillary electrospray, the beam
was a mixture of ions and droplets at high flow rates and transitioned to a beam of pure ions at low flow rates [69]. This behavior had never been observed with low
conductivity liquids before and is referred to as the pure ionic regime (PIR). Note that liquid metal ion sources (LMIS) regularly operate in the PIR due to their very high electrical conductivities and surface tensions, which are typically ∼ 106 Si/m and ∼ 700 dyn/cm respectively [47].
Figure 2-2: 1-ethyl-3-methylimidazolium tetrafluoroborate. [16, 17, 58]
While much was understood about the droplet and mixed ion-droplet modes of cone-jet electrosprays of electrolytes, very little was known about the pure ion mode. The PIR requires high electric fields to induce ion evaporation. The maximum electric
Table 2.1: Properties of common ionic liquids. [18]
Cation Anion
Name Formula Mass Atoms Formula Mass Atoms
EMI-DCA C6N2H11 111.2 19 N(CN)2 66 5 EMI-BF4 C6N2H11 111.2 19 BF4 86.8 5 EMI-GaCl4 C6N2H11 111.2 19 GaCl4 211.5 5 EMI-FeCl4 C6N2H11 111.2 19 FeCl4 197.7 5 EMI-C(CN)3 C6N2H11 111.2 19 C(CN)3 90 7 EMI-Im C6N2H11 111.2 19 C2NS2)4F6 280 15 EMI-Beti C6N2H11 111.2 19 (C2F5SO2)2N 380 21 EMI-FAP C6N2H11 111.2 19 (C2F5)3PF3 445 25 BMI-I C8N2H15 139.2 25 I 126.9 1 C5MI-FAP C9N2H17 153 28 (C2F5)3PF3 445 25
field on the surface of the liquid meniscus is proportional to [28, 52]:
𝐸𝑚𝑎𝑥 ∝ 𝑓 (𝜖)1/3 (︃ 𝛾3𝑘 𝜖𝑄 )︃1/6 (2.7)
where 𝜖 is the relative electrical permittivity, 𝛾 is the surface tension, 𝑘 is the electrical conductivity, and 𝑄 is the liquid flow rate. High electrical conductivity, high surface tension fluids and low flow rates allow for strong electric fields to develop, which may induce ion evaporation from the liquid surface. Only a few ionic liquids, namely EMI-BF4, EMI-GaCl4, EMI-C(CN)3, and EMI-N(CN)2, were able to achieve the PIR at
room temperature [31, 69]. Many other low conductivity ionic liquids used in capillary electrosprays could not reach the PIR as it was not possible to stabilize the source at the required low flow rates [31]. Interestingly, the PIR was achieved with an EMI-Beti capillary electrospray operated at temperatures in excess of 119∘C[71]. Increasing the
liquid temperature increases the electrical conductivity, which allows for the formation of a sharper liquid meniscus, resulting in stronger electric fields at the tip. Many other ionic liquids were electrosprayed at elevated temperatures to show that the PIR can be attained by increasing the conductivity [72].
Traditional capillary sources are pressure-fed at relatively high flow rates, which is not ideal for achieving the PIR. Capillaries are used for electrolyte solutions since the capillary wall prevents the solvent from evaporating in vacuum. Ionic liquids, with
their negligible vapor pressures, do not need to be contained in such a way. Passively-fed, externally wetted emitters based on those used in LMIS were developed in 2004 by Lozano and Martínez-Sánchez[47]. A schematic of a single emitter ionic liquid ion source (ILIS) that uses an electrochemically etched, chemically roughened tungsten needle is shown in Figure 2-3. Fascinatingly, the ionic liquids with poor conductivities and surface tensions that operated in the mixed ion-droplet regime using a capillary source were able to reach the PIR using an externally wetted tungsten emitter [7, 8]. The emitted currents, and liquid flow rates, achieved with the passively fed emitters are much lower than those observed with capillary sources [7]. This suggests that the architecture of externally wetted tips allows stable electrified menisci to form at much lower flow rates than achievable with a capillary emitter. In addition, it was found that the ion energy spread for externally wetted emitters is much narrower than that of capillary sources [7].
Figure 2-3: Tungsten needle single emitter ILIS. [59]
Since the discovery of the PIR, much research has been conducted to characterize ionic liquid ion sources. Time of flight (TOF) mass spectrometry is one of the most commonly used experimental techniques, the details of which are covered more
thor-oughly in Section 4.4. In summary, one can obtain the mass distribution of an ion beam by periodically interrupting the beam and measuring the current downstream with a collector. TOF has been used to quantify the ion and droplet populations of capillary electrosprays operating in the mixed ion-droplet regime[29, 45] as well as the
populations of ions emitted by ILISs [42, 47, 49]. Early TOF measurements were con-ducted to uncover the differences between capillary and externally wetted sources [7]
and to determine how electrical conductivity and surface tension affect the operation regime of electrosprays[31]. More recent TOF experiments have been focused on
iden-tifying the specific ion species in ILIS beams for various ionic liquids [24, 42, 49, 57, 76]. With increasing detector resolution, the diverse population of ILIS beam ions, which have a spectrum of masses and energies, can be studied in greater detail.
The beam composition of ionic liquid ion sources consists of single ions and ion clusters [47]. Single ions are referred to as monomers, such as single EMI+ ions for
EMI-BF4 in the positive mode. A single ion attached to a cation-anion pair, or a
single neutral cluster, is called a dimer. For example EMI+(EMI-BF
4) is the positive
dimer for an EMI-BF4ILIS. Figure 2-4 shows the molecular structure of both positive
and negative monomers and dimers for an EMI-BF4 ILIS. Typically EMI-BF4 ILIS
beams consist of ∼ 50% monomers and ∼ 50% dimers [47]. It is also possible to have heavier ion clusters in the beam, such as a single ion attached to two neutral pairs, called a trimer, and so on. Several other ionic liquids have been characterized using time of flight mass spectrometry, such as EMI-Im, EMI-FAP, EMI-FeCl4,
EMI-GaCl4, BMI-I, and EMI-Beti [31, 42, 49, 57]. It was found that ILIS beams produced
by different ionic liquids have different beam compositions. In addition to liquid properties, it also appears that the source voltage, current, and emitter geometry affect the beam composition [9, 57]. The presence of ion clusters in addition to the
monomers has a significant effect on the propulsive performance of ILISs, which is covered in Chapter 3.
In addition to time of flight mass spectrometry, several other methods of character-ization have been employed to better understand ionic liquid ion sources. Retarding potential analysis (RPA), the subject of Section 4.3, has been used to measure the
Figure 2-4: Monomers and dimers for EMI-BF4.[16, 17, 58]
beam energy distribution of electrosprays [28, 45, 49]. Retarding potential analysis
pro-vides a wealth of information including the energy spread of ILISs. Lozano found that an EMI-Im ILIS beam was nearly monoenergetic with an energy only a few percent lower than the acceleration potential [49]. Retarding potential analysis has also been used to study the stability of ion clusters in ILIS beams, which is the subject of the next section[16, 49, 57, 59]. In addition to RPA and TOF measurements, much research has been conducted to characterize ILIS current stability[62], beam divergence[47, 62],
and electrochemistry[5, 46].
2.4
Ion Cluster Fragmentation
The ion clusters produced by electrosprays are unstable and may break apart into lighter ions and neutral clusters. Figure 2-5 shows a negative EMI-BF4 dimer
break-ing apart into a monomer and a neutral pair. A quantitative treatment of this phe-nomenon is provided in Chapter 3 since the break-up of ion clusters could have a strong effect on the performance of ILISs for both propulsion and micromachining
applications. The break-up of ion clusters, which we refer to as fragmentation, was first observed for a sodium iodide doped formamide capillary electrospray operating in the mixed ion-droplet regime [12]. A quadrupole mass spectrometer was used to select ions of varying degrees of solvation and retarding potential analysis was used to measure the energy distribution of the selected ion species. It was found that ions with lower degrees of solvation had unusual energy distributions, where signifi-cant fractions had lower energies than expected. These low energy components were attributed to the fragmentation of ions of higher degrees of solvation, an indication of the metastability of the ion clusters [12]. Note that fragmented ion species have less kinetic energy than their parent ions since some of the energy is lost to the neutral cluster. The ions with higher degrees of solvation were more monoenergetic, which may imply that they formed through the break-up of even larger clusters[12, 13].
Fragmentation can also be viewed as evaporation of a neutral pair from the larger cluster. As neutrals are evaporated, the main cluster is cooled, which may reduce the probability of future fragmentation [12, 13].
Figure 2-5: Fragmentation of a negative EMI-BF4 dimer. [16, 17, 58]
In general, the dissociation of molecules and clusters of molecules has been stud-ied using both theoretical and experimental techniques. A common method to ex-perimentally measure the dissociation energies is called collision-induced dissociation (CID)[67]. In this method, the molecules are prepared and accelerated into a gas-filled section where they collide with the gas atoms and dissociate [6]. The mass spectrum
of the molecules is measured after the collisions to determine how many dissociated, which is related to the dissociation energy [6]. Theoretical methods to estimate the