HAL Id: inserm-00951439
https://www.hal.inserm.fr/inserm-00951439
Submitted on 24 Feb 2014HAL is a multi-disciplinary open access archive for the deposit and dissemination of sci-entific research documents, whether they are
pub-L’archive ouverte pluridisciplinaire HAL, est destinée au dépôt et à la diffusion de documents scientifiques de niveau recherche, publiés ou non,
Combining Ca2+ imaging with -glutamate photorelease.
Marco Canepari, Michel de Waard, David Ogden
To cite this version:
Marco Canepari, Michel de Waard, David Ogden. Combining Ca2+ imaging with -glutamate photore-lease.: Ca2+ Imaging and Glutamate Photorelease. Cold Spring Harbor protocols, Cold Spring Har-bor, NY : Cold Spring Harbor Laboratory Press, 2013, 2013 (12), pp.1165-8. �10.1101/pdb.prot073122�. �inserm-00951439�
PROTOCOL 2 Title page
Combining Ca
2+Imaging with
L
-glutamate Photorelease
SHORT TITLE: Ca2+ Imaging and Glutamate Photorelease
Marco Canepari
1,2, Michel De Waard
1,2, David Ogden
31
Inserm, U836, Team 3, BP 170, Grenoble Cedex 09, F-38042, France
2
Université Joseph Fourier, Grenoble Institut des Neurosciences, France
3 Laboratoire de Physiologie cérébrale, UMR8118, Université Paris Descartes, 75006 Paris, France
Address correspondence to: marco.canepari@ujf-grenoble.fr
ABSTRACT
We describe simple configurations and methods to measure optical Ca2+ signals in response to photorelease of L-glutamate. This photostimulation allows activation of postsynaptic glutamate receptors without activation of voltage-gated Ca2+ channels permitting the separation and the analysis of different Ca2+ components. We give details of basic microscopy configurations and of tools to efficiently illuminate the preparation while preserving the healthy conditions of the tissues. We also suggest methodological procedures and we discuss protocols of linear optics to achieve simultaneous imaging and uncaging in relation to protocols using two photon illumination.
MATERIALS
Reagents
• Artificial cerebral-spinal fluid (ACSF). <R> • Internal solution for patch clamp. <R>
• 4-methoxy-7-nitroindolinyl (MNI)-caged L-glutamate purchased from Tocris, Bristol, UK. <R> • A Fluo, an Oregon Green or a Calcium Green dye purchased from Invitrogen – Molecular Probes
(Carlsbad, CA). Available dyes at different dissociation constants are: Fluo-3, Fluo-4, Fluo-5F, Fluo-5N, Fluo-4FF, Oregon Green 488 BAPTA-1, Oregon Green 488 BAPTA-6F, Oregon Green 488 BAPTA-5N, Calcium Green-1, Calcium Green-5N. <R>
Equipment
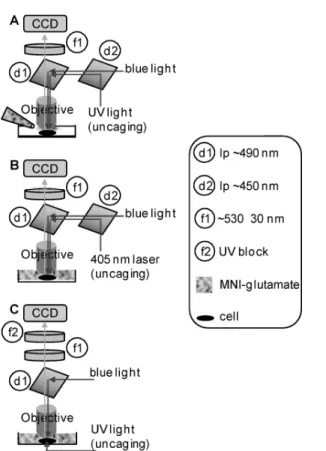
For experiments on brain slices, use an upright microscope equipped for patch-clamp recordings and epifluorescence. Fig. 1A shows a first configuration suitable for bath concentrations of MNI-glutamate at <0.3 mM or local application of higher concentrations through a puffer pipette. In Fig. 1A, UV and blue light are provided through the epifluorescence port. Use a 470 nm LED to excite Ca2+ fluorescence (indicated as “blue light” in the figure) and a 365 nm LED or a 355 nm laser for uncaging (“UV light” in the figure). The two light beams are combined using a ~450 nm long-pass dichroic mirror (d2, for instance the FF458-Di from Semrock, Rochester, NY) and an adaptor, available for all main commercial microscopes from Cairn Research, Faversham, UK; Rapp OptoElectronic, Hamburg, Germany; or TILL Photonics, Munich, Germany. The same companies also provide several light sources both for fluorescence excitation and uncaging. The two light beams are then reflected onto the preparation using a ~490 nm long-pass dichroic mirror with range extended into the near-UV (d1, for instance the FF495 from Semrock or T495 from Chroma). Fluorescence emission is band-pass filtered at ~530±30 nm (f1, use for instance the FF01-530/55 from Semrock). An implementation of this configuration is given by Auger and Ogden (2010).
If bath application of MNI-glutamate at concentrations >0.3 mM is used, we propose two solutions. 1. For laser spot photolysis use a 405 nm laser for uncaging (Fig. 2B) since this wavelength can still
efficiently photorelease glutamate, but is also significantly less absorbed by the caged compound in the optical pathway (Trigo et al. 2009).
2. For wide-field photolysis illuminate with UV light from the bottom of the microscope, i.e. from the pathway of the transmitted light (Fig. 1C). In this case, it is better to use a silica condenser to transmit near-UV (Canepari et al. 2001b) and to further reduce the UV component of the emission by a second filter (f2, use for instance the FF02-409/LP from Semrock).
For fluorescence acquisition, some of the companies commercializing suitable CCD or EMCCD cameras are RedshirtImaging LLC, Decatur, GA; Andor, Belfast, UK; QImaging, Surray, Canada; Photometrics, Tucson, AZ; PCO, Kelheim, Germany.
Figure 1. Configurations for simultaneous Ca2+ imaging with green fluorescent dyes and uncaging. (A) UV and blue light beams are via the epifluorescence port using an adaptor and a ~450 nm long-pass dichroic mirror (d2). The two beams are reflected to the objective via a ~490 nm dichroic mirror (d1). Ca2+ fluorescence is filtered by a ~530 ± 30 nm band-pass filter (f1) and acquired by a CCD camera. The caged compound is applied only locally using a pipette. (B) Same microscope configuration of A, but caged compound applied in the bath. A 405 nm is used for uncaging. (C) Caged compound applied in the bath, but UV light from the same pathway of the transmitted light. UV block (f2) added in the emission pathway.
Methods
1. The caged compound is used extracellularly at concentrations generally of 0.5 -2 mM (to obtain near physiological concentrations of released glutamate). The precise concentration of MNI-glutamate in the bath can be determined after the experiment by UV-visible absorption spectroscopy using the molar absorption coefficient 4300 M-1cm-1 at 330 nm (Trigo et al. 2009). 2. Bath application of MNI-glutamate rather than ‘puffer’ application is necessary to quantify the
calibration see Trigo et al. 2009; Canepari et al. 2001a). To limit consumption of the cage one can use a small recirculation system or apply the caged compound in HEPES buffered static solution while applying hydrated O2 or air on the bath surface to maintain the condition of the
slice (Canepari et al. 2001b; 2004; Canepari and Ogden 2003; 2006). In this case evaporation of the bath solution requires partial replacement every 15-30 min. The mixing of the cage added in the bath is also important and is aided considerably by the oxygenation stream applied to the surface. Near-UV light for photolysis is strongly absorbed by the caged compound; hence, the caged compound in the optical path between the objective and the slice surface absorbs light and reduces its intensity because the working distance of objectives used for electrophysiology is >2 mm. To overcome this problem use photolysis at 405 nm; applying the caged compound locally using a pipette is effective, but cannot be quantitative because the concentration of cage varies even close to the pipette (Trigo et al. 2009).
3. Imaging experiments are done by synchronising the image acquisition with the uncaging stimulation, i.e. by recording images before and after a glutamate photorelease event.
RECIPES
• ACSF (mM): 125 NaCl, 26 NaHCO3, 20 glucose, 3 KCl, 1 NaH2PO4, 2 CaCl2 and 1 MgCl2,
bubbled with 95% O2 and 5% CO2.
• HEPES buffered ACSF: (mM): 132 NaCl, 4 KCl, 2.5 NaHCO3, 10 Hepes, 25 glucose, pH 7.3,
usually with 1 mM MgCl2 and 2 mM CaCl2.
• Suggested internal solution (mM): 125 KMeSO4, 5 KCl, 5 MgSO4, 5 Na2-ATP, 0.3 Tris-GTP, 12
Tris-Phosphocreatine, 20 HEPES, adjusted to pH 7.35 with KOH.
• Use of MNI-glutamate. Prepare a stock solution of MNI-caged L-glutamate using extracellular solution without glucose and CaCl2 at the concentration of 20-30 mM. Although stable to
hydrolysis it is recommended to make single use aliquots and keep them at -20ºC protected from light. Make a final solution containing MNI-glutamate at 1 mM concentration in extracellular solution. It is important to check that the solution is clear after thawing and the bath is well mixed after addition; the gas stream is efficient for mixing by agitating the surface. The concentration can be determined from the molar absorption coefficient 4300 M-1 cm-1 at 330 nm.
• Use of Ca2+ indicators. Prepare a stock solution in intracellular solution at 10 mM concentration. Make single use aliquots and keep them at -20ºC. Before the experiment, dilute the dye in internal solution at desired concentration.
REFERENCES
AugerC, Ogden D. 2010. AMPA receptor activation controls type I metabotropic glutamate receptor signalling via a tyrosine kinase at parallel fibre-Purkinje cell synapses. J Physiol 588: 3063-3074. Canepari M, Auger C, Ogden D. 2004. Ca2+ ion permeability and single channel properties of the
parallel fibre metabotropic slow EPSC of rat Purkinje neurons. J Neurosci 24: 3563-3573.
Canepari M, Nelson L, Papageorgiou G, Corrie JE, Ogden D. 2001a. Photochemical and pharmacological evaluation of 7-nitroindolinyl-and 4-methoxy-7-nitroindolinyl-amino acids as novel, fast caged neurotransmitters. J Neurosci Meth 112: 29-42.
Canepari M, Papageorgiou G, Corrie JE, Watkins C, Ogden D. 2001b. The conductance underlying the parallel fibre slow EPSP in rat cerebellar Purkinje neurones studied with photolytic release of L-glutamate. J Physiol 533: 765-772.
Canepari M, Ogden D. 2003. Evidence for protein tyrosine phosphatase, tyrosine kinase, and G-protein regulation of the parallel fiber metabotropic slow EPSC of rat cerebellar Purkinje neurons. J
Neurosci 23: 4066-4071.
Canepari M, Ogden D. 2006. Kinetic, pharmacological and activity-dependent separation of two Ca2+ signalling pathways mediated by type 1 metabotropic glutamate receptors in rat Purkinje neurons.
J Physiol 573: 65-82.
Trigo FF, Corrie JE, Ogden D. 2009. Laser photolysis of caged compounds at 405 nm: photochemical advantages, localisation, phototoxicity and methods for calibration. J Neurosci Meth 180: 9-21.