HAL Id: hal-00303220
https://hal.archives-ouvertes.fr/hal-00303220
Submitted on 21 Dec 2007HAL is a multi-disciplinary open access
archive for the deposit and dissemination of sci-entific research documents, whether they are pub-lished or not. The documents may come from teaching and research institutions in France or abroad, or from public or private research centers.
L’archive ouverte pluridisciplinaire HAL, est destinée au dépôt et à la diffusion de documents scientifiques de niveau recherche, publiés ou non, émanant des établissements d’enseignement et de recherche français ou étrangers, des laboratoires publics ou privés.
Morphology of the tropopause layer and lower
stratosphere above a tropical cyclone: A case study on
cyclone Davina (1999)
F. Cairo, C. Buontempo, A. R. Mackenzie, C. Schiller, C. M. Volk, A.
Adriani, V. Mitev, R. Matthey, G. Di Donfrancesco, A. Oulanovsky, et al.
To cite this version:
F. Cairo, C. Buontempo, A. R. Mackenzie, C. Schiller, C. M. Volk, et al.. Morphology of the tropopause layer and lower stratosphere above a tropical cyclone: A case study on cyclone Davina (1999). Atmo-spheric Chemistry and Physics Discussions, European Geosciences Union, 2007, 7 (6), pp.18319-18360. �hal-00303220�
ACPD
7, 18319–18360, 2007 TTL and LS over cyclone Davina F. Cairo et al. Title Page Abstract Introduction Conclusions References Tables Figures ◭ ◮ ◭ ◮ Back CloseFull Screen / Esc
Printer-friendly Version Interactive Discussion
EGU Atmos. Chem. Phys. Discuss., 7, 18319–18360, 2007
www.atmos-chem-phys-discuss.net/7/18319/2007/ © Author(s) 2007. This work is licensed
under a Creative Commons License.
Atmospheric Chemistry and Physics Discussions
Morphology of the tropopause layer and
lower stratosphere above a tropical
cyclone: A case study on cyclone
Davina (1999)
F. Cairo1, C. Buontempo1,*, A. R. MacKenzie2, C. Schiller3, C. M. Volk4, A. Adriani1,**, V. Mitev5, R. Matthey5, G. Di Donfrancesco6, A. Oulanovsky7, F. Ravegnani1, V. Yushkov7, M. Snels1, C. Cagnazzo8, and L. Stefanutti8,***
1
Istituto di Scienze dell’Atmosfera e del Clima, CNR, Roma, Italy
2
Environmental Science Department, Lancaster University, Lancaster, UK
3
Institute for Stratospheric Research, Forschungszentrum J ¨ulich GmbH, J ¨ulich, Germany
4
Institute for Atmosphere and Environment, J. W. Goethe University, Frankfurt, Germany
5
ACPD
7, 18319–18360, 2007 TTL and LS over cyclone Davina F. Cairo et al. Title Page Abstract Introduction Conclusions References Tables Figures ◭ ◮ ◭ ◮ Back CloseFull Screen / Esc
Printer-friendly Version Interactive Discussion
EGU
6
Ente per le Nuove Tecnologie, l’Energia e l’Ambiente, Frascati, Rome, Italy
7
Central Aerological Observatory, Dolgoprudny, Russia
8
Istituto Nazionale di Geofisica e Vulcanologia, Boulogne, Italy
9
Airborne Platform for earth Observation, Comitato di Gestione, Florence, Italy
∗
now at: United Kingdom Meteorological Office, Exeter, UK
∗∗
now at: Istituto di Fisica dello Spazio Interplanetario, INAF, Rome, Italy
∗∗∗
now at: Geophysica Gruppo Europeo di Interesse Economico, Florence, Italy
Received: 14 November 2007 – Accepted: 3 December 2007 – Published: 21 December 2007 Correspondence to: F. Cairo ([email protected])
ACPD
7, 18319–18360, 2007 TTL and LS over cyclone Davina F. Cairo et al. Title Page Abstract Introduction Conclusions References Tables Figures ◭ ◮ ◭ ◮ Back CloseFull Screen / Esc
Printer-friendly Version Interactive Discussion
EGU
Abstract
During the APE-THESEO mission in the Indian Ocean the Myasishchev Design Bu-reau stratospheric research aircraft M55 Geophysica performed a flight over and within the inner core region of tropical cyclone Davina. Measurements of total water, water vapour, temperature, aerosol backscattering, ozone and tracers were made and are
5
discussed here in comparison with the averages of those quantities acquired during the campaign time frame.
Temperature anomalies in the tropical tropopause layer (TTL), warmer than average in the lower part and colder than average in the upper TTL were observed. Ozone was strongly reduced compared to its average value, and thick cirrus decks were present up
10
to the cold point, sometimes topped by a layer of very dry air. Evidence for meridional transport of trace gases in the stratosphere above the cyclone and the perturbed water distribution in the TTL is illustrated and discussed.
1 Introduction
The amount of water vapour and trace gases present in the uppermost part of the
15
tropical troposphere is an important parameter to quantify because it is mainly from that region that air enters the stratosphere, where water vapour plays a major role in regulating chemistry and temperatures (Holton et al., 1995). For instance, water vapour in the stratosphere is involved both in the production of the important OH hy-droxyl radicals and in the formation of polar stratospheric clouds which subsequently
20
help to destroy ozone (Kirk-Davidoff, 1999). Understanding the balance of processes that govern the exchange of air across the tropical tropopause is thus a major priority for stratospheric meteorology and Earth system science. It has long been recognized that as air passes the tropical tropopause it dehydrates to a value approximately equal to the value of the saturation vapor mixing ratio dictated by the cold temperature of
25
ACPD
7, 18319–18360, 2007 TTL and LS over cyclone Davina F. Cairo et al. Title Page Abstract Introduction Conclusions References Tables Figures ◭ ◮ ◭ ◮ Back CloseFull Screen / Esc
Printer-friendly Version Interactive Discussion
EGU how much water vapor stays in the air, and how much is removed by condensation and
sedimentation processes, are still under debate. Several processes on different time scales may affect the exchange of air between the stratosphere and the troposphere in the tropics. In particular, the balance between the slow tropical upwelling driven by the Brewer-Dobson circulation and the rapid upwelling in deep convection is not well
5
known (Dessler, 2002; Danielsen, 1982). Although in the upper tropical troposphere dehydration and vertical movement into the stratosphere need not be linked, at least on small timescales, and horizontal advection seems to play the major role in the dehy-dration (Fueglistaler et al., 2004; Holton and Gettelman, 2001), evaluating the impact of organized convection on the tropical upper troposphere is still crucial.
10
In recent years, the study of the upper tropical troposphere developed the concept of a tropical tropopause layer (TTL) (Atticks and Robinson 1983; Highwood and Hoskins, 1998), as a border region between the convective-radiative equilibrium of the tropo-sphere and the radiative equilibrium of the stratotropo-sphere. In this transition zone both stratospheric and tropospheric processes interact. In the troposphere below
approxi-15
mately 14 km the radiative cooling is balanced by latent heat release by convection, while above approximately 16 km the radiative heating balances the stratosphere-driven upwelling. Cumulus tops are rarely observed above 14 km, and this implies an abrupt reduction of convective mass flux above that level. The ozone concentration starts to increase there well below the cold point tropopause (Folkins et al., 1999;
Fu-20
jiwara et al., 2000; Mackenzie et al., 2006; Vaughan et al., 2007) and the lapse rate starts to move away from wet adiabats below 14 km (Folkins and Braun, 2001). In the lower part of the TTL a mixing barrier exists (Folkins et al. 1999; Folkins et al., 2000) so that the residence time of air in the TTL is greater than in any other level of the tropo-sphere. In fact, following Gettelman et al. (2002), the probability that a convective cloud
25
penetrates the TTL above 14 km is about 1%, this estimate only slightly increased by Alcala and Dessler (2002) using satellite data.
Part of the deep convection in the tropics occurs in the organized structure of cy-clones. In fact, the cumulus convection associated with the central part of a tropical
ACPD
7, 18319–18360, 2007 TTL and LS over cyclone Davina F. Cairo et al. Title Page Abstract Introduction Conclusions References Tables Figures ◭ ◮ ◭ ◮ Back CloseFull Screen / Esc
Printer-friendly Version Interactive Discussion
EGU cyclone is probably the most organized form of convection present in the tropics and
its effect on the upper troposphere and lower stratosphere may reflect this collective behaviour. This self organization is responsible for the extreme temperature reached in the core (warm anomalies) and in the lower stratosphere overlaying the eye of the storm (cold anomalies). The coldest cloud top temperatures ever recorded were
asso-5
ciated directly or indirectly to cyclone convection (Ebert and Holland, 1991). Further-more during the developing stage of a tropical cyclone it is extremely likely to observe deep overshooting around the eye wall. The lifetime and size of cyclones also implies that their impact on the TTL could be significant on the regional scale.
The present paper addresses the effects of tropical cyclones on the upper tropical
10
troposphere and lower stratosphere. We present and discuss observations taken in the TTL and lower stratosphere in and above a tropical cyclone, by the instrumented research aircraft Geophysica during the tropical campaign of the Airborne Platform for Earth observations – THird European Stratospheric Experiment on Ozone (APE-THESEO) project, in 1999. In particular we look for evidence of (i) downward transport
15
of stratospheric air, (ii) upward transport of marine boundary layer air, and (iii) cloud-induced changes to the water content of air throughout the TTL.
The purpose of APE-THESEO was to study the microphysical processes in tropical cirrus and the transport of tracers both across the tropopause and in the lower strato-sphere. The field campaign was carried out from the International Airport of Mah `e,
20
Seychelles (4◦42′S, 55◦30′E) from 15 February to 15 March 1999, and two research aircraft were deployed: the DLR Falcon 20 and the M-55 Geophysica. The DLR Falcon, equipped with the OLEX LIDAR, acted as a pathfinder for the stratospheric airplane, while the Geophysica acquired in-situ data on water substance and trace gases at higher levels. A review of the activities during the campaign can be found in Stefanutti
25
et al. (2004).
The campaign comprised seven local flights from Mah `e, covering the region of the South-western Indian Ocean. One of the seven local flights – on 9 March 1999 – was devoted to sample the TTL above the tropical cyclone Davina, off the coast of La
ACPD
7, 18319–18360, 2007 TTL and LS over cyclone Davina F. Cairo et al. Title Page Abstract Introduction Conclusions References Tables Figures ◭ ◮ ◭ ◮ Back CloseFull Screen / Esc
Printer-friendly Version Interactive Discussion
EGU Reunion island in the southern Indian Ocean
The present work is organized as follows: Sect. 2 presents a review of what is known about the influence of cyclones on the upper troposphere and lower strato-sphere (UTLS). Section 3 describes the instruments, data and methods that will be used in subsequent analysis. Section 4 presents the meteorological situation at the
5
time of the flight, and the data acquired during the M55 flight over the cyclone, in com-parison with the averages acquired in the timeframe of the campaign. In Sect. 5 the observations will be discussed. Section 6 draws conclusions from our study.
2 Cyclones in the UTLS
A general analysis of cyclone organization, behaviour and climatology is beyond
10
the scope of this work, and we address the interested reader to the review of Emanuel (2003) and references therein. Here our attention is focussed on what is known on the structure and effects of cyclones on the UTLS.
The general characteristics of the UTLS above the cyclone are the following (Koteswaram, 1967): the low pressure core extends throughout the troposphere and
15
into the stratosphere, although the horizontal pressure gradient rapidly decreases with height. Winds, which are cyclonic throughout most of the volume occupied by the cy-clone, reverse their sense of rotation near the top of the storm, often losing their axial symmetry and becoming concentrated in some “outflow jets” that curve anticyclonically from the storm core. The upper level outflows ultimately lead to the formation of an
ex-20
tended cirrus deck capping the cyclone, with more elevated clouds close to the eyewall, higher at the front of the cyclone and lower at the rear (Kovacs and McCormick, 2003), and cloud tops decreasing radially outward in a sort of umbrella-shaped shield.
Often, but not always, the lower level warm core gives way to a cold core above 15 km, so that highest and lowest temperature anomalies occur at 8–12 km and near
25
the tropopause, respectively. Rings of warm and cold air extend radially from the tropopause above the cyclone core, which is colder than average and generally bulged
ACPD
7, 18319–18360, 2007 TTL and LS over cyclone Davina F. Cairo et al. Title Page Abstract Introduction Conclusions References Tables Figures ◭ ◮ ◭ ◮ Back CloseFull Screen / Esc
Printer-friendly Version Interactive Discussion
EGU upward. While in the upper troposphere the isentropes are curved downward toward
the centre of the cyclone, in the lower stratosphere isentropes radially undulate from it and are curved upward from the centre of the cyclone. In the tropopause region above the core, therefore, the vertical gradient of potential temperature is reduced. The cold temperature anomaly extends above the tropopause but weakens quickly with height,
5
relaxing in 1–2 km to the average temperature profile (Waco, 1970).
A good indicator of air-mass redistribution and exchanges in and over cyclones are the perturbations in the ozone field. Measurements of upper level ozone in cyclones started in the sixties with the reconnaissance flights of the stratospheric aircraft U2. Penn (1965) showed increased values of ozone in the upper troposphere, from the
10
cloud tops situated at 200 hPa up to the tropopause level, on the weak Ginny cyclone. The same author (Penn, 1966) showed no significant variation in ozone mixing ratio in the lower stratosphere down to the tropopause level above the Isbell cyclone core.
In 1991 the DC-8 sampled the Typhoon Mireille from the boundary layer to the upper troposphere up to 12 km (Newell et al., 1996); the boundary layer eye region showed
15
increased levels of ozone but at higher levels there was no evidence – from ozone lidar cross sections – of increased ozone from downward entrainment of stratospheric air into the eye upper region; this indeed showed low tropospheric values.
No significant amounts of stratospheric mixing into the troposphere above the cy-clone’s eye were also reported by Carsey and Willoughby (2005) who reported low
20
concentrations of ozone in the eyes of hurricanes Georges and Floyd. There, signifi-cant variations of tropospheric ozone mixing ratio between 2 km and 6 km, between the intensifying and weakening regimes of the storms, are reported. During intensification, ozone values indicated only a small descent of air from above flight level, topping at 6 km, or a dilution with low-ozone eyewall air. During weakening, ozone
concentra-25
tions were low throughout the eye and eyewall, consistent with the eyes being filled with boundary layer air. Regions of warm, dry, ozone-rich air that were attributed to mesoscale downdraft, were also detected, but detached from the eye region. This finding of possible stratospheric injection in proximity of cyclones substantiated earlier
ACPD
7, 18319–18360, 2007 TTL and LS over cyclone Davina F. Cairo et al. Title Page Abstract Introduction Conclusions References Tables Figures ◭ ◮ ◭ ◮ Back CloseFull Screen / Esc
Printer-friendly Version Interactive Discussion
EGU work of Baray et al. (1999) that suggested mesoscale transport of air-masses by strong
ageostrophic movements around the cyclone convective area.
Ozone distributions in cyclones have also been studied with the aid of satellites. A recent study of Zou and Wu (2005) shows that variations of column ozone levels are linked to the stages of formation, intensification and movement of a hurricane.They
an-5
alyzed ozone levels in 12 hurricanes and found that the area of a hurricane has typically low levels of ozone from the surface to its top. When the storm intensifies, the ozone levels throughout the storm decrease. Moreover they discovered that ozone levels – although lower than in the unperturbed troposphere – are elevated in the eye region of tropical cyclones relative to the area outside the eye, due to more likely stratospheric
10
intrusions there. This latter effect, which contrasts with many aircraft measurements, has been questioned by Joiner et al. (2006) who pointed to an incorrect estimation of cloud top pressures in the retrieval of TOVs total column ozone, as a cause of this effect. Stratospheric intrusion indeed occur, but displaced from the cloud-defined eye.
Water vapour and ozone distributions over hurricane Floyd were also studied by
15
Richard et al. (2001), who reported lower water vapour, lower ozone and higher methane mixing ratios during the Floyd overflight between the tropopause and 80 mb (18 km), prompting the authors to suggest that local dehydration was occurring right above the storm, while the lower ozone and higher methane indicated upward transport of tropospheric air. The issue of tropical cyclones as sites of active dehydration of
tropo-20
spheric air entering the stratosphere was addressed in the paper of Danielsen (1993), who, in an analysis of a flight conducted from Darwin, Australia, over cyclone Damien showed that the deep convection induced by the cyclone resulted in clouds upwelling and in a more pronounced elevation of the tropopause. Large thermal inversions were observed above the cold point– analogously to the observations by Waco (1970)–
25
where any vertical velocity difference would easily promote internal gravity waves, ulti-mately producing turbulence and diffusive vertical transport. This rapid vertical trans-port episode was also documented by Radon measurements by Kritz et al. (1993).
in-ACPD
7, 18319–18360, 2007 TTL and LS over cyclone Davina F. Cairo et al. Title Page Abstract Introduction Conclusions References Tables Figures ◭ ◮ ◭ ◮ Back CloseFull Screen / Esc
Printer-friendly Version Interactive Discussion
EGU duce in the UTLS, which may reach a length scale of 3000 km in the upper troposphere
(Merrill, 1988), are suggestive of a distinctive effect they might have on the TTL, differ-ent from that of unorganized deep convection in the tropics. For instance, we may note that the peculiar temperature structure of the UTLS above cyclones, i.e. colder and less stable than the mean background TTL profile, is well suited to test the
convective-5
dehydration mechanisms (Teitelbaum et al., 2000; Vomel et al. 1995; Danielsen 1982). The air that dries to low mixing ratios as it ascends within deep convective towers, may enter the stratosphere when the tropopause is colder than average and high, so that the stratosphere would be drier than the minimum saturation mixing ratio from an average tropical temperature profile.
10
To evaluate the relative importance of tropical cyclones as preferred regions of con-vective overshooting, penetrating the TTL or even above the tropopause, we have used the dataset of the Tropical Rainfall Measurements Mission (TRMM) for the year 1999. TRMM measures cloud-top altitude and rainfall characteristics (Cecil et al., 2005), see Sect. 3 hereafter. This valuable dataset has been already used by
Al-15
cala and Dessler (2002) to asses the general impact of tropical convection upon strato-spheric dehydration. The TRMM tropical cyclone database available through the Japan Aerospace Exploration Agency (http://www.eorc.jaxa.jp/TRMM/typhoon/index e.htm), allowed us to evaluate the fraction of the convection associated with tropical cyclones with respect to the overall convection present in the tropical area.
20
We have used the 2A23 product of the TRMM. In this type of dataset, files store the observations obtained by the Precipitation Radar on board of the satellite. In particular we have used the “rain type” and the “cloud top” products. We have defined as over-shooting any pixel of the radar image that was associated with a convective type of rain and, at the same time, showed a cloud top above 14 km, a level usually considered as
25
a good proxy for the lower edge of the TTL (Sherwood and Dessler, 2001).
In this way we have calculated the fraction of the overall cyclone-related convection that is penetrating the TTL. This fraction is close to 3.5%, a value near the one obtained by Alcala and Dessler (2002) for the overall convection in the tropics. This seems to
ACPD
7, 18319–18360, 2007 TTL and LS over cyclone Davina F. Cairo et al. Title Page Abstract Introduction Conclusions References Tables Figures ◭ ◮ ◭ ◮ Back CloseFull Screen / Esc
Printer-friendly Version Interactive Discussion
EGU indicate that cyclone associated convection is not in general a preferred pathway for
TTL penetration.
Despite this result, in some stage of the cyclone life cycle the overshooting could still lead to more frequent and deeper injection into the TTL. A recent work by Kelley and Stout (2004) subdivided the TRMM cyclone observations with respect to their life
5
stage, and clearly showed that in the cyclone intensification stage, convective towers are more than twice as likely to occur as in the other stages, and that these towers reach higher than at other stages.
However, previous direct in-situ observations documenting the effects of cyclones on the TTL and the LS are too sparse to draw definite conclusions.
10
3 Instruments and methods
We compare the profiles of meteorological parameters (water, clouds, ozone and trac-ers) detected in and over the cyclone Davina with the average profiles acquired during the time frame of the APE-THESEO field campaign. The general meteorological set-ting for the campaign is given in Stefanutti et al. (2004). An analysis of the temperature,
15
ozone, clouds and water vapour profiles acquired during the campaign has been re-ported in MacKenzie et al. (2006). In the present work the focus is on the specific effects of tropical cyclones on the UTLS.
A short introduction to the encounter with cyclone Davina described below, has been published in the Royal Meteorological Society’s Weather magazine (Buontempo et al.,
20
2006); in that work, lidar data from the Falcom F-20 are compared to idealized cyclone structure as predicted by the model of Emanuel (1999).
In the following sections we describe briefly the instruments deployed during the flight and the satellite data we used to interpret the meteorological situation.
ACPD
7, 18319–18360, 2007 TTL and LS over cyclone Davina F. Cairo et al. Title Page Abstract Introduction Conclusions References Tables Figures ◭ ◮ ◭ ◮ Back CloseFull Screen / Esc
Printer-friendly Version Interactive Discussion
EGU 3.1 The M55 payload
Aerosol and cloud detection at the aircraft flight level were provided by the Multiwave-length Aerosol Scatterometer (MAS) (Adriani et al., 1999), a backscattersonde that provided in-situ measurements of volume backscatter ratio and depolarization ratio at 532 nm, with a time resolution of 10 s and an accuracy of 5% on the backscatter ratio.
5
The 2-sigma uncertainty on the depolarization ratio is higher and is estimated to be not smaller than 30% for the flight of 9 March to Davina.
The miniaturized lidar Microjoule Aerosol Lidar (MAL) (Matthey et al., 2000) provided vertical profiles of aerosol and cloud volume backscatter ratio and depolarization ratio at 532 nm, from some tens of meters from the aircraft to 2–3 km upward, with a vertical
10
resolution of 20 m and a time resolution of 80 s.
Total water content was measured by the Fast In situ Stratospheric Hygrometer (FISH), developed at the Forschungszentrum Julich (Germany). The instrument that is based on the Lyman-α photofragment technique, has an overall accuracy of 6%, or 0.3 ppmv in the case of very low mixing ratios. The oversampling of condensed water
15
in clouds was corrected as described in Schiller et al. (1999). Condensed water was also measured by a Tunable Diode Laser (CVI) cell (Toci et al., 2002) that received only evaporated particles that had been able to pass a Counterflow Virtual Impactor (CVI) inlet (Noone et al., 1988). This latter device permitted the passage only of particles with kinetic energy larger than a given value, i.e. with masses equivalent to spherical
20
diameters greater that 1.5 µm. Water vapour was measured by the FLASH instru-ment, an aircraft version of an instrument already deployed on balloons (Yushkov et al., 1998; Peet et al. 2004). While outside of clouds the two instruments give the same result, comparison of the two instruments in clouds gives the amount of condensed water. Ozone was measured with a time resolution of 10 s by the Electro Chemical
25
Ozone Cell (ECOC) (Kyro et al., 2000), a modified electrochemical ozone cell whose data were validated against ozonosondes, and with a time resolution of 1 s by the Fast Ozone ANalyser (FOZAN) (Yushkov et al., 1999), a fast response instrument based on
ACPD
7, 18319–18360, 2007 TTL and LS over cyclone Davina F. Cairo et al. Title Page Abstract Introduction Conclusions References Tables Figures ◭ ◮ ◭ ◮ Back CloseFull Screen / Esc
Printer-friendly Version Interactive Discussion
EGU a chemiluminescent reaction between a dye and the ambient ozone.
A set of long-lived tracers (N2O, CFC-12, CFC-11, Halon-1211, SF6, CO2) were measured by the High Altitude Gas AnalyzeR (HAGAR), a Gas chromatograph, with time resolution of 90 seconds combined with a non-dispersive IR analyzer for CO2with
time resolution of 10 s (Volk et al., 2000).
5
Avionic data were also recorded for scientific use. These included air temperature and pressure, horizontal wind velocity, true air speed, geographical coordinates and altitude. Accuracies of temperature and pressure were tested in previous campaigns by comparison with collocated radiosondes, and were assessed as 0.5 K, and 0.6 hPa respectively. In principle, from the information of the inertial navigation system on
10
aircraft orientation and true air speed, it would be possible to infer the values of air vertical speed which is an order of magnitude smaller than the horizontal components (Scott et al., 1990), but this was, in practice, not possible due to the noise affecting the avionic data.
3.2 Satellites
15
Images from METEOSAT 5 and TRMM were used for the analysis. TRMM data have also been used to evaluate the relevance of tropical storms for the global climate, as discussed in Sect. 2.
In the time frame of the Geophysica deployment, METEOSAT 5 was relocated over the Indian ocean at 63◦E to provide support to the field activities of the concomitant
20
international INDOEX project (Ramanathan et al., 2001). The satellite radiometer ac-quires images simultaneously in the visible, thermal infrared and water vapour IR band, with a frequency of 30 minutes, a total coverage of the Earth disk and a spatial resolu-tion of 5 km at the equator.
TRMM is a joint mission between NASA and JAXA, aiming to accurately measure
25
the spatial and temporal variation of tropical rainfall. The instruments used to measure precipitation are two: i) the Precipitation Radar, (PR) that provides three-dimensional maps of storm structures with a horizontal resolution at the ground of 4 km and a swath
ACPD
7, 18319–18360, 2007 TTL and LS over cyclone Davina F. Cairo et al. Title Page Abstract Introduction Conclusions References Tables Figures ◭ ◮ ◭ ◮ Back CloseFull Screen / Esc
Printer-friendly Version Interactive Discussion
EGU width of 220 km, and has the ability to provide vertical profiles of rain and snow from
the surface up to a height of 20 km, ii) the TRMM Microwave Imager (TMI), a pas-sive microwave sensor based on the design of SSM/I which measures radiation at five separate frequencies with a 780 km wide swath at the ground.
4 Observations
5
4.1 The Davina cyclone
Davina originated on 1 March 1999 in the Mid-Indian Ocean basin, approximately due south of Sri Lanka. It maintained a west-south-west track almost throughout its life, reaching a tropical cyclone grade, as classified by the La Reunion Regional Specialized Meteorological Centre, on 5 March. Its maximum 10-min average wind speed was
10
162 km/h, detected on 7 and 8 March. After passing La Reunion island, it started to weaken and to decelerate, moving then northward and westward for several days. It dissipated over the waters of eastern Madagascar on 12 March.
Dvorak technique estimations (Dvorak, 1975, 1977, 1984) of tropical cyclone inten-sities suggest that the most intense stage of the storm had been reached on 8 March.
15
The Geophysica sampled the cyclone early the following day, at the very beginning of its decaying phase. The onset of decay rapidly led to the disaggregation of the cyclone eye. TRMM data obtained from the DAAC database (in particular the VIRS ra-diance, the TMI radiances, and the TMI derived hydrometeor profiles), indicate that on 9 March 1999 part of such disaggregation had already started. The TMI hydrometeor
20
data showed that the most active part of the storm was located near its southern edge. There, the surface rain due to convection was as high as 30/40 mm/h. Unfortunately the PR swath was located too far south to measure the height of the convective towers near the core of the system.
ACPD
7, 18319–18360, 2007 TTL and LS over cyclone Davina F. Cairo et al. Title Page Abstract Introduction Conclusions References Tables Figures ◭ ◮ ◭ ◮ Back CloseFull Screen / Esc
Printer-friendly Version Interactive Discussion
EGU 4.2 The Geophysica flight
The Geophysica took off from Mahe’ (Seychelles) the 9th of March 1999, at 05:05 local time (Seychelles time is 4 h ahead of UTC), following the DLR F-20 Falcon that took off 30 min earlier to act as a pathfinder. The Geophysica flight lasted for 5 h and 54 s. In the left panel of Fig. 1, a Meteosat image of brightness temperature over the Indian
5
Ocean at the time of the Geophysica flight is shown. The Geophysica flight path is the line connecting Mah ´e with the cyclone’s eye. Points along the line are colour coded in terms of altitude. Seven-day back-trajectories with ending points along the Geophysica flight path, calculated using NCEP reanalysis, showed the presence of a zonal easterly flow in the upper troposphere, in the week preceding the flight. On the same panel,
10
the cyclone trajectory from 3 March to 9 March is also shown and colour coded in terms of storm intensity. The right panel shows the brightness temperature along the Geophysica flight path, derived from the Meteosat picture.
The two aircraft flew close together at their respective cruise altitudes. Approaching the cyclone, the weather radar on board of the Falcon detected a break in the cyclone
15
wall and so it followed the passage and reached the eye wall of Davina. On approach-ing the centre of the cyclone, the OLEX lidar (on board of the Falcon) detected, above flight level, a thick cloud deck. The deck extended radially outward from the cyclone’s eye for 400 km, with clouds at 16 km in the outer boundaries, then sloping downward toward the cyclone’s centre, to reach a cloud height of 8 km there. The Geophysica
fol-20
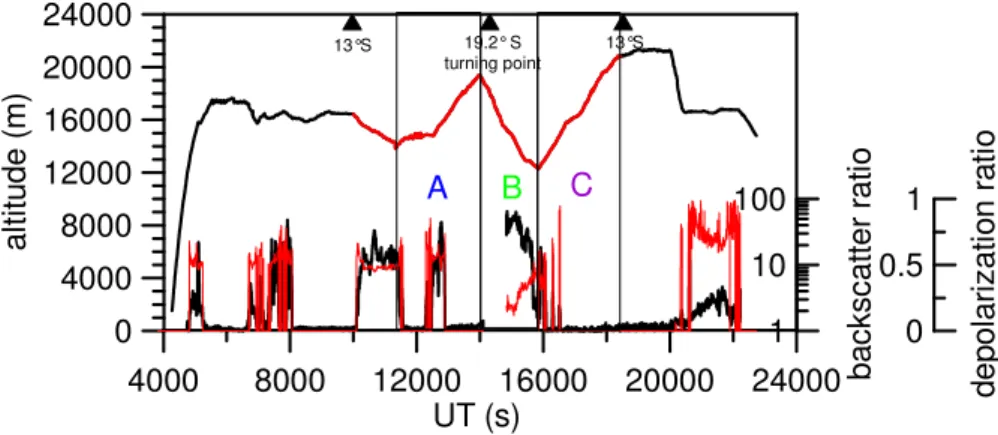
lowed the Falcon above the clouds and entered the cyclone in different areas, directly sampling the cirrus clouds and trace gases. During the cyclone crossing, the cirrus cloud deck that formed a spiral arm of Davina guided the Geophysica, and then a dive was performed at the cyclone wall. Figure 2 is a time plot of the flight altitude profile, (black line), together with MAS backscatter ratio (black line) and MAS depolarization
25
(red line) showing crossings of clouds along the flight path.
The aircraft performed an ascent on approaching the cyclone centre (section A), then dived and turned northward (section B). A third ascent reached the aircraft ceiling
ACPD
7, 18319–18360, 2007 TTL and LS over cyclone Davina F. Cairo et al. Title Page Abstract Introduction Conclusions References Tables Figures ◭ ◮ ◭ ◮ Back CloseFull Screen / Esc
Printer-friendly Version Interactive Discussion
EGU altitude on the way back to Mah ´e (section C).
The ascents and descents were performed with a vertical speed of 4 m/s, sampling a region with horizontal dimension of roughly 350 km. Data acquired along these three vertical profiles will be compared in the following to average profiles acquired in all other flights performed during the campaign. Data acquired during the portion of the
5
flight marked in red, southward of 13◦S, are not part of the dataset used in the subse-quent section to build mean profiles of temperature, ozone and tracers. In figure 3 the backscatter ratio along and above the flight level are colour coded as function of alti-tude and latialti-tude. The cyclone region extended on the southernmost part of the flight. There, cirrus clouds topping at 16 km, were repeatedly crossed by the Geophysica.
10
The thick red lines on the figure connect points of equal potential temperature along the aircraft flight path and are suggestive of isentropes along the latitudinal transect. 4.3 Vertical profiles
Data obtained during portions A, B, and C of the flight are compared with averages obtained from the campaign dataset composed of all the other flights, and the Davina
15
flight data northward 13◦S. The dataset covers a wide variety of atmospheric conditions (see Stefanutti et al., 2004).
Most of this campaign dataset comes from observations northward of 13◦S, i.e. from a region well inside the so-called “tropical pipe” (Plumb, 1996), which is characterised by substantial isolation from the extra tropical lower stratosphere (Volk et al., 1996).
20
The outermost edges of the tropical belt, though, may exhibit more meridional ex-change with the midlatitudes or even lie outside the isolated tropical pipe region. In order to take full account of this possible bias in the average profiles, we also display in the figures, as a separate profile, the subset of the campaign observations composed of data acquired southward of −13◦N (excluding the Davina flight). These came from
25
the flights, conducted on the 6th and 11th of March, under convectively quiescent con-ditions and aimed at performing meridional transects of the tropopause region and the lower stratosphere to study tracer gradients.
ACPD
7, 18319–18360, 2007 TTL and LS over cyclone Davina F. Cairo et al. Title Page Abstract Introduction Conclusions References Tables Figures ◭ ◮ ◭ ◮ Back CloseFull Screen / Esc
Printer-friendly Version Interactive Discussion
EGU Data from instruments with time resolution coarser than 1 s have been linearly
in-terpolated to a 1-s grid, with the exception of HAGAR data for which the original data (sampled every 90 s) are shown. The dataset has been binned in 60-m bins with re-spect to GPS altitude, with an average number of samples per bin of 300, or in 1 K bins with respect to potential temperature, with an average number of samples per bin of
5
roughly 500 (except for HAGAR data).
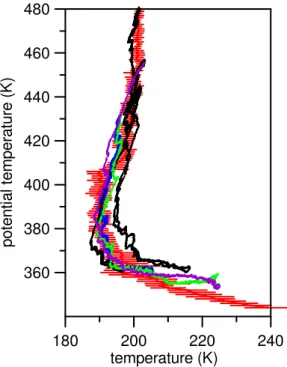
Figure 4 shows temperature (left panel) and potential temperature (right panel) pro-files for the non-Davina campaign mean, the non-Davina campaign subset of obser-vations southward of 13◦S and for the three profiles from Davina. There, and in the following Figs. 5 to 11, the red solid line shows the non-Davina campaign profiles and
10
the range bars indicate one standard deviation. Blue, green and purple solid lines show profiles acquired respectively during portions A, B and C of the Davina flight, as indicated in Fig. 2. Finally the black solid line shows the non-Davina southernmost subset.
From figure 4 we see that temperature profiles in and around the storm are up to 5 K
15
warmer than the non-Davina mean in the lower part of the profile between 12 km and 14 km, then from 14 km up to 17 km they follow the non-Davina mean, while higher up they get some 3–5 K colder than the mean, up to 20 km.
The non-Davina southernmost subset comprises two vertical profiles sampled on the 6th March between 17◦ to 19◦S, and one sampled on the 11th March between 13.5◦
20
and 15◦S. Observations from these profiles are often at the two extremes of the overall campaign distribution for most quantities measured. Concerning temperature, we see that from 15–16 km to the top of the sounding, Davina profiles are 5–10 K colder than the non-Davina southernmost profiles acquired three days earlier, and are comparable to the profile acquired two days later, up to 18 km. Above that altitude, the Davina
25
profile stays colder than all other observations.
The cold point tropopause above the cyclone tends to be higher and colder than the mean, although still within the envelope of cold points observed at other times during the campaign.
ACPD
7, 18319–18360, 2007 TTL and LS over cyclone Davina F. Cairo et al. Title Page Abstract Introduction Conclusions References Tables Figures ◭ ◮ ◭ ◮ Back CloseFull Screen / Esc
Printer-friendly Version Interactive Discussion
EGU Potential temperature profiles around the centre of the hurricane are warmer than
non-Davina means at altitudes below 13 km, then in a layer from 13 km to 16 km the potential temperature vertical gradients are reduced so that above 16 km, up to 19 km, the Davina profiles become some 5–10 K colder than the non-Davina means. The comparison with the non-Davina southernmost subset shows Davina profiles being
5
comparable to the profile sampled on 11th March, but some 5–10 K colder than the southernmost profiles sampled on 6th March in the upper troposphere, and in the lower part of the stratosphere. At the top of the sounding, these profiles merge with the non-Davina means.
In Fig. 5 we plot temperature profiles vs. potential temperature. From the 360 K
10
level upwards, between 15 and 16 km, the Davina profiles follow quite closely the non-Davina mean, suggesting that the temperature anomalies discussed in Fig. 4 are mainly due to adiabatic vertical displacement. Only below 360 K, significant departures of the Davina profiles from the non-Davina mean suggest that diabatic processes be-come important. Hereafter we will generally use potential temperature as a vertical
15
coordinate, to remove the effects of adiabatic motion.
The southernmost non-Davina profiles acquired on the 6th March are warmer than the overall non-Davina campaign mean until 420 K, and warmer than the Davina case throughout the potential temperature range of the Davina profiles (i.e. θ≤450 K), while the southernmost non-Davina profile acquired on the 11th March follow more closely
20
the Davina profiles.
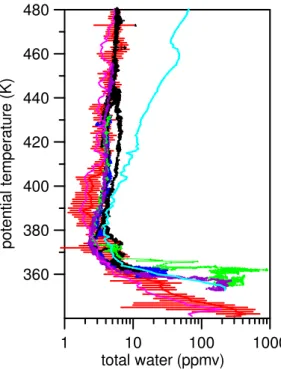
Water profiles are depicted in Fig. 6. As in previous pictures, red lines and range bars show the mean non-Davina total water campaign profile with a range of one standard deviation. Blue, green and purple solid lines show profiles acquired respectively during portions A, B and C of the Davina flight, from FISH. In addition, the cyan solid line
25
represents the water vapour saturation mixing ratio computed from the air temperature during the Davina flight and the violet solid line represents the non-Davina mean water vapour mixing ratio from FLASH.
ACPD
7, 18319–18360, 2007 TTL and LS over cyclone Davina F. Cairo et al. Title Page Abstract Introduction Conclusions References Tables Figures ◭ ◮ ◭ ◮ Back CloseFull Screen / Esc
Printer-friendly Version Interactive Discussion
EGU the TTL region up to 360 K, i.e. up to the top of the cirrus deck. This is particularly
marked on the B profile where the cirrus layer extends even higher than in the other two profiles, up to 375 K. We note, however, above 360 K in profiles A and C and above 375 K in profile B, a distinct water depleted region. That region is substantially subsaturated, except for a single layer on profile A at 380 K, where the water vapour
5
reaches its saturation value.
In general, the Davina profiles differ significantly from the non-Davina means: mixing ratios at the hygropause are comparable but the Davina hygropause is some 20 K lower than for the non-Davina mean. The Davina profiles are dryer up to 385 K, and moister above, merging with the non-Davina means only above the 410 K level.
10
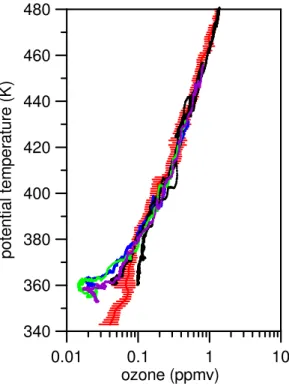
Figure 7 shows the ozone measurements, which are of particular interest: in the Davina ozone profiles, the 360 K level coincides with the centre of a layer, extending upward to the 380 K level, where ozone is strongly reduced, both in comparison with the non-Davina means and with the southernmost non-Davina profiles on 6th March, while the southernmost profile acquired on the 11th shows a reduction of ozone too, although
15
not as severe as in the Davina observations. The depleted ozone in the Davina case is indicative of significant upward transport of ozone-poor marine boundary layer air into the TTL. The mean value of ozone mixing ratio below 850 hPa during the campaign was around 20 ppbv, roughly half of the free troposphere value. Above the 380 K level, the Davina profiles are well within the non-Davina means.
20
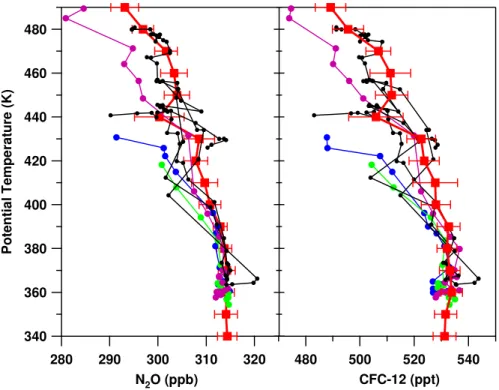
Profiles of the stratospheric tracers N2O and CFC-12 can be seen in Fig. 8. For both
species the profiles A and B show a departure from the non-Davina means from the 400 K level upward, while profile C more closely follows the campaign means. Other long-lived tracers measured by HAGAR show similar behaviour. Noteworthy is further-more the deviation from the non-Davina means at 440 K, apparent in the southernmost
25
profile acquired on the 11th of March.
From the observations described above we can draw the following conclusions: 1. The cyclone induced a variation in the temperature profile of the UTLS, with
ACPD
7, 18319–18360, 2007 TTL and LS over cyclone Davina F. Cairo et al. Title Page Abstract Introduction Conclusions References Tables Figures ◭ ◮ ◭ ◮ Back CloseFull Screen / Esc
Printer-friendly Version Interactive Discussion
EGU than average in the upper TTL; stratospheric temperatures are generally colder
than average, up to 20 km (440 K), which is the highest point reached by the air-craft near Davina.
2. In the tropopause region the vertical gradient of potential temperature is reduced. 3. Ozone is reduced by a factor of ∼5 from at least 360 K (probably lower) up to
5
380 K, which suggests a vigorous uplift of ozone-poor marine-boundary-layer air to those altitudes, (i.e. ∼17 km).
4. There is a significant presence of cirrus clouds in the lower TTL above the cyclone, in one case extending upward to the cold point. The clouds reside in a region which is, as stated, colder than the mean. The Davina profiles are moister than
10
the non-Davina means, implying that the cirrus clouds are forming in air injected into the TTL from below.
5. Tracer profiles stay within tropospheric values up to 385 K. Above that level they show a stratospheric behaviour.
6. Water profiles (were no clouds are present) are dryer below and moister above
15
the 385 K level in comparison to the non-Davina means.
7. In general, Davina observations are closer to observations taken in the same area two days later, than to the overall campaign means and to the southernmost observations acquired three days earlier. This suggests that some of the effects of Davina were still persistent in the area after the storm had passed.
20
5 Discussion
From the previous analysis of ozone and stratospheric tracers, we are led to the conclu-sion that no stratospheric intruconclu-sions into the upper troposphere were observed during
ACPD
7, 18319–18360, 2007 TTL and LS over cyclone Davina F. Cairo et al. Title Page Abstract Introduction Conclusions References Tables Figures ◭ ◮ ◭ ◮ Back CloseFull Screen / Esc
Printer-friendly Version Interactive Discussion
EGU our survey, and that the 380–385 K level marked the upper boundary of a region
sub-ject to insub-jections of boundary layer air during an earlier, more intense, phase of the cyclone. We will continue our analysis by focusing on the regimes below and above this level in turn.
5.1 Below 385 K: dehydration effects
5
In analyzing this set of observations, we were also motivated by the following question: are tropical cyclones active sites of dehydration, and to what extent? A partial answer to this question is that, despite the general effect of hydrating the upper troposphere (Ray et al., 2007), in fact they may be effective in dehydrating the air in the upper TTL. This may occur if the thick cirrus shield is present in a region of temperatures colder
10
than the average, so that sedimenting cirrus particles would fix the water vapour there at a value close to the saturation, which is lower than the average saturation mixing ratio of the TTL elsewhere.
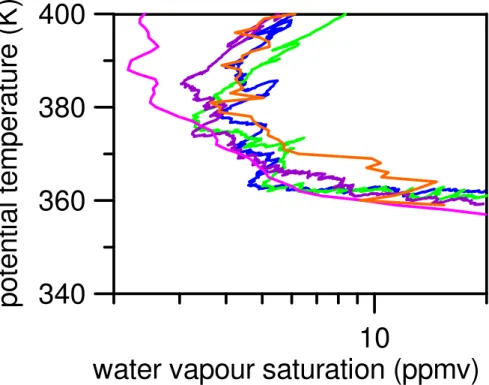
That this may be the case is suggested by an analysis of Fig. 9. There, the orange line represents the non-Davina mean saturation mixing ratio while the pink line
rep-15
resents the non-Davina mean water vapour mixing ratio. As can be seen comparing the two profiles, in general during the campaign the air in the TTL was predominantly under-saturated, as reported in the analysis of MacKenzie et al. (2006). The Davina A, B and C saturation mixing ratio profiles – blue, red and purple lines respectively – are lower than the corresponding non-Davina means, and closer to the actual mean water
20
vapour mixing ratio observed during the campaign.
The observations thus suggest that the upper part of the TTL above the cyclone is a good candidate for a region where the water vapor mixing ratio could be lowered, by freeze drying, to the values observed on average elsewhere, by an active process of freeze drying to the particularly low saturation values encountered there.
25
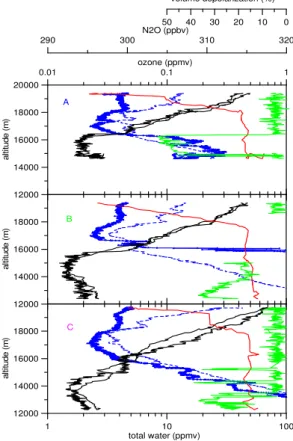
To explore further the water behaviour above the cyclone, we refer now to each single profile separately in figure 10 where N2O, ozone, total water, water vapour saturation mixing ratio and aerosol depolarization ratio are displayed vs. geometrical altitude for
ACPD
7, 18319–18360, 2007 TTL and LS over cyclone Davina F. Cairo et al. Title Page Abstract Introduction Conclusions References Tables Figures ◭ ◮ ◭ ◮ Back CloseFull Screen / Esc
Printer-friendly Version Interactive Discussion
EGU the three Davina vertical soundings. We remind that profiles A and C were acquired in
the northern wall of the cyclone while profile B is closer to the centre.
Common to the three profiles is a dry region between 16.5 km and 18 km. Two ge-ometrically thin layers of condensed water are present lower down in profile C, where total water is at, or only slightly above, the water vapour saturation mixing ratio.
Pro-5
file B shows a thick cirrus up to 16 km. Unfortunately the aerosol depolarization data are missing for the central part of this profile, so we cannot detect whether or not the condensed phase extends up to 16.5 km, where the total water content equals the sat-uration value. Nevertheless, noticeable in the available dataset is the unexpectedly low value of the aerosol depolarization inside that cloud. Such low values are detected in
10
mixed phase clouds, unlikely to be present at those cold temperatures, or in clouds composed of particles of very small radius, probably from very recent nucleation. Sig-nificant presence of small particles inside the cyclone cirrus canopy was reported by Knollenberg et al. (1993) in the case of cyclone Damien.
In the case of high densities of small cloud particles, equilibrium with the water
15
vapour inside the cloud could be established very quickly, thus reducing the amount of water in the gas phase to a value close to its saturation in short times. Yet, the minimum of water vapour found at 17 km in all the three profiles would have required temperatures 2–3 K lower than those actually encountered at the cirrus cloud tops in our sounding.
20
In fact hygropause and cold point (see the minimum in the total water mixing ratio profile) are coincident only in the B case, while both in the A and C profiles they differ, the cold point being higher than the hygropause. In case B, the cold point coincides with the altitude of the computed lapse rate tropopause, while the cold point is higher than the lapse rate tropopause in cases A and C. This all seems to suggest that
de-25
hydration processes are thus not ongoing in our data, except maybe at the top of the cirrus clouds in profile B, and that the dry layer between 16 km and 18 km is a result of what had happened earlier, perhaps in the most active part of the cyclone life cy-cle. During intensification, the cyclone experienced a large drop in its central surface
ACPD
7, 18319–18360, 2007 TTL and LS over cyclone Davina F. Cairo et al. Title Page Abstract Introduction Conclusions References Tables Figures ◭ ◮ ◭ ◮ Back CloseFull Screen / Esc
Printer-friendly Version Interactive Discussion
EGU pressure and it is then that the most intense vertical velocities are usually observed.
This hypothesis was substantiated by the analysis of the available TRMM data that measured the cyclone during different stages of its life cycle, and showed how colder cloud tops were observed 48–72 h earlier than our observations.
An effect probably competing with dehydration may arise from overshooting cloud
5
turrets hydrating that region, as seemed to be the case in profile A, where a tem-perature minimum at 17.5 km is just coincident with a thin layer of enhanced water vapour, reaching its saturation value. Particles in that layer were identified by the slight enhancement observed in the MAS depolarization (green line) and in concomitant en-hancement of the CVI condensed water probe (not shown). Such moisturizing anvil
10
top plumes originating from the cirrus decks above thunderstorms have been first de-scribed from satellite observations by Levizzani et al. (1996). Wang (2003) interpreted these as injections of small particles in the upper levels induced by the breaking of gravity waves; the small particles then moisturize the layer upon evaporation. Turbu-lent mixing induced by breaking gravity waves may be enhanced in the weakly stratified
15
tropopause region above cyclones. Turbulent mixing above ITCZ-type convection lead-ing – on subsequent coollead-ing – to cloud formation, has been described by Santacesaria et al. (2003) for an earlier flight in APE-THESEO, and by Garrett et al. (2004) for mea-surements in the CRYSTAL-FACE campaign.
5.2 Above 385 K: meridional mixing in the lower stratosphere
20
As shown in Fig. 8, stratospheric tracers showed a distinctive behaviour in the vicinity of cyclone Davina between 400 K and 430 K. There, on two out of three profiles the vertical profiles of N2O and CFCs show lower mixing ratios tending toward values that
are typical of the midlatitude stratosphere than of tropical air. The scatterplot of N2O vs. ozone in figure 11 further confirms this feature: while the non-Davina campaign
25
data on average exhibit a correlation slope typical for the isolated tropical regions, the deviations apparent in the Davina profiles tend toward the compact correlation typically observed in the midlatitudes (e.g. Volk et al., 1996). This suggests that stratospheric
ACPD
7, 18319–18360, 2007 TTL and LS over cyclone Davina F. Cairo et al. Title Page Abstract Introduction Conclusions References Tables Figures ◭ ◮ ◭ ◮ Back CloseFull Screen / Esc
Printer-friendly Version Interactive Discussion
EGU air above the cyclone is at least partly of midlatitude origin.
Indeed, HYSPLIT (Draxler and Rolph, 2003; Rolph, 2003) model backtrajectories starting on a 1◦square grid centered at the southernmost point of the Geophysica flight path confirm that, above the cyclone eye and higher than 400 K, air-masses follow two tracks: a purely zonal trak staying well within the tropics and a more meridional track,
5
which is apparent eastward of Madagascar, displacing midlatitude air-masses toward the tropics. This latter flux promoted a 15◦northward displacement of the air-masses in the previous 72 h. If this meridional transport has indeed occurred, it could well account for the observations taken by the Geophysica in the stratosphere above the cyclone.
It needs to be considered here that the observations in question were taken in just
10
the region (13◦ to 19◦S) in which the subtropical barrier is usually found (e.g. Fahey et al., 1996). Air of both typical tropical as well as more midlatitude character may thus be expected in this region, depending on the exact location of the barrier, which is expected to undulate meridionally e.g. under the influence of large-scale waves and which may possess small-scale structure. This would explain the fact that the
non-15
Davina profiles southward of 13◦S exhibit partially typically tropical tracer values (and correlation slope with ozone) and partially similar excursions toward midlatitude values as the Davina profiles (see Figs. 7 and 11). Whether the meridional transport associ-ated with Davina constitutes an irreversible intrusion of midlatitude air into the tropical lower stratosphere or simply a large-scale northward displacement of the subtropical
20
transport barrier, cannot be decided with the data set considered here. However, the cyclone would certainly be expected to interact with the subtropical transport barrier and it is quite conceivable that such interaction would promote irreversible exchange between the tropics and midlatitudes.
6 Conclusions
25
The encounter of the Geophysica research aircraft with cyclone Davina on 9 March 1999 provided in-situ measurements of trace gases, cloud/aerosol properties and
ther-ACPD
7, 18319–18360, 2007 TTL and LS over cyclone Davina F. Cairo et al. Title Page Abstract Introduction Conclusions References Tables Figures ◭ ◮ ◭ ◮ Back CloseFull Screen / Esc
Printer-friendly Version Interactive Discussion
EGU modynamic properties in the tropopause layer and in the lower stratosphere. These
measurements have been used to build a two dimensional picture of the atmosphere above a tropical cyclone. In particular, the measurements have been used to investi-gate the transport processes which could substantially modify the tropical tropopause layer.
5
The dataset acquired is consistent with the hypothesis that tropical cyclones have the potential to dehydrate the upper TTL to a value of the water vapour mixing ratio which is lower than the average saturation mixing ratio in unperturbed conditions.
A plausible mechanism for the dehydration is the formation of cirrus clouds at high levels, and subsequent particle removal by gravitational settling. This would leave the
10
TTL temporarily colder than the mean and with a water vapour mixing ratio reduced to the small values of saturation encountered at the cloud tops there.
Nevertheless observations acquired during our survey, although showing a dehy-drated layer in the upper part of the TTL above the cyclone cirrus canopy, are not conclusive in showing the dehydration mechanism in action. This may be due to the
15
sampling of the cyclone at the onset of its decaying phase, when colder temperatures and higher clouds were already past.
The observations seem to suggest that cyclones may induce horizontal stirring of the lower stratosphere, possibly promoting irreversible entrainment of midlatitude strato-spheric air into the tropical zone. They may thus act to smear out the “tape recorder”
20
profile of water vapour vertically, and the meridional gradients of water and trace gases horizontally.
No attempt has been made to quantify the effects of cyclones on the TTL on a global scale. This might be done by computing the irrotational part of the analysed wind fields at different levels above a cyclone during its lifetime, and scaling this mass flux to the
25
total TTL air-mass, and to the yearly number of cyclones, which is fairly constant. If it turns out that cyclones effects on the TTL are quantitatively not negligible, then an increase of their intensity and duration, as recent papers are suggesting in response to warming of tropical sea surface temperature (Emanuel, 2005), could conversely impact
ACPD
7, 18319–18360, 2007 TTL and LS over cyclone Davina F. Cairo et al. Title Page Abstract Introduction Conclusions References Tables Figures ◭ ◮ ◭ ◮ Back CloseFull Screen / Esc
Printer-friendly Version Interactive Discussion
EGU the TTL and the composition of tropospheric air entering the stratosphere.
Acknowledgements. The APE-THESEO project was funded by the European Commission
un-der the contract ENVSCY97-0533, by the Italian Space Agency (ASI), by the European Sci-ence Foundation and by the German Ministry of SciSci-ence and Education (BMBF), all of whom gratefully acknowledged. Help in-kind was provided by the UK Meteorological Office and the
5
Directorate of Civil Aviation of the Seychelles.
A. R. MacKenzie gratefully acknowledges NERC support under contracts GST/02/2210 and NER/T/S/00977.
This work also informs Activity 2 of the SCOUT-O3 Integrated Project of the European Com-mission (contract 505390-GOCE-CT-2004) as part of that project’s data mining and exploitation
10
of existing data.
References
Adriani, A., Cairo, F., Viterbini, M., Mandolini, S., Pulvirenti, L., and Di Donfrancesco, G.: Multi-wavelength Aerosol Scatterometer for airborne experiments to study the stratospheric parti-cle optical properties, J. Atmos. Ocean. Tech., 16, 1329–1336, 1999.
15
Alcala, C. M. and Dessler, A. E.: Observation of deep convection in the tropics using the tropical Rainfall Mesurement Mission (TRMM) precipitation radar, J. Geophys. Res. 107, 1–7, 2002. Atticks, M. G. and Robinson, G. D.: Some features of the structure of the tropical tropopause,
Q. J. R. Meteorol. Soc., 109, 295–308, 1983.
Baray, J. L., Ancellet, G., Radriambelo, T., and Baldy, S.: Tropical cyclone Marlene and
20
stratosphere-troposphere exchange, J. Geophys. Res., 104, 13 953–13 970, 1999.
Brewer, A. W.: Evidence for a world circulation provided by the measurement of helium and water vapour distribution in the stratosphere, Q. J. R. Meteorol. Soc., 75, 351–363, 1949. Buontempo, C., Flentje, H., and Kiemle, K.: In the eye of a tropical cyclone, Weather, 61,
47–50, 2006.
25
Carsey, T. P. and Willoughy, H. E: Ozone measurements from eyewall transects of two Atlantic tropical cyclones, Mon. Weather Rev., 133, 166–174, 2005.
ACPD
7, 18319–18360, 2007 TTL and LS over cyclone Davina F. Cairo et al. Title Page Abstract Introduction Conclusions References Tables Figures ◭ ◮ ◭ ◮ Back CloseFull Screen / Esc
Printer-friendly Version Interactive Discussion
EGU
TRMM Precipitation features: part I: Radar, Radiometric and lightning characteristics, Mon. Weather Rev. 133, 543–566, 2005.
Danielsen, E. F.: A dehydration mechanism for the stratosphere, Geophys. Res. Lett., 9, 605– 608, 1982.
Danielsen, E. F.: In situ evidence of rapid, irreversible, vertical transport of lower tropospheric
5
air int the lower tropical stratosphere by convective cloud turrets and by larger scale upwelling in tropical cyclones, J. Geophys. Res., 98, D5, 8665–8681, 1993.
Dessler, A. E.: The effect of deep, tropical convection on the tropical tropopause layer, J. Geophys. Res., 107(D), ACH 6-1, ACH 6-5, 2002.
Draxler, R. R. and Rolph, G. D.: HYSPLIT (HYbrid Single-Particle Lagrangian Integrated
Trajec-10
tory) Model access via NOAA ARL READY Website (http://www.arl.noaa.gov/ready/hysplit4.
html). NOAA Air Resources Laboratory, Silver Spring, MD, 2003.
Dvorak, V. F.: Tropical cyclone analysis and forecasting from satellite imagery, Mon. Weather Rev., 103, 420–430, 1975.
Dvorak, V. F.: Tropical cyclones intensity analysis using enhanced infrared satellite data,
pro-15
ceedings of the 11th technical conference on hurricanes and tropical meteoreology, AMS, 268–273, 1977.
Dvorak, V. F.: Tropical cyclone intensity analysis using satellite data, NOAA Technical Report NESDIS 11, NOAA/NESDIS, 47 pp, 1984.
Ebert, E. E. and Holland, G. J.: Observation of record cloud top temperature in tropical cyclone
20
Hilda (1990), Mon. Weather Rev., 120, 2240–2251, 1991.
Elkins, J. W., Thompson, T. M., Swanson, T. H., Butler, J. H., Hall, B. D., Cummings, S. O., Fisher, D. A., and Raffo, A. G.: Decrease in the growth rates of atmospheric chlorofluorocar-bons 11 and 12, Nature 364, 780–783, 1993.
Emanuel, K.: Thermodynamic control of cyclone intensity, Nature, 401, 665–669, 1999.
25
Emanuel, K.: Tropical Cyclones, Annu. Rev. Earth Planet. Sci., 31, 75–104, 2003.
Emanuel, K. A.: Increasing destructiveness of tropical cyclones over the past 30 years, Nature 326, 686–668, 2005.
Fahey, D. W., Donnelly, S. G., Keim, E. R., Gao, R. S., Wamsley, R. C., Del, L. A., Negro, E. L., Woodbridge, M. H., Proffitt, K. H., Rosenlof, M. K. W., Ko, D. K., Weisenstein, C. J., Scott, C.,
30
Nevison, S., Solomon, S., and Chan, K. R.: In situ observations of NOy, O3, and the NOy/O3 ratio in the lower stratosphere, Geophys. Res. Lett., 23, 1653–1656, 1996.
ACPD
7, 18319–18360, 2007 TTL and LS over cyclone Davina F. Cairo et al. Title Page Abstract Introduction Conclusions References Tables Figures ◭ ◮ ◭ ◮ Back CloseFull Screen / Esc
Printer-friendly Version Interactive Discussion
EGU
mixing at 14 km in the tropics: Evidences from ozonesondes and aircraft measurements, J. Geophys. Res., 104, 22 095–22 102, 1999.
Folkins, I., Oltmans, S. J., and Thompson, A. M.: Tropical convective outflow and near surface equivalent potential temperatures, Geophys. Res. Lett., 27, 2549–2552, 2000.
Folkins, I., Braun, C., Thompson, A. M., and Witte, J.: Tropical ozone as an indicator of deep
5
convection, J. Geophys. Res., 107, D13, 4184, doi:10.1029/2001JD001178, 2002.
Fueglistaler, S., Wernli, H., and Peter, T.: Tropical troposphere to stratosphere transport inferred from trajectory calculations, J. Geophys. Res., 109, D3108, 2004.
Fujiwara, M., Kita, K., Ogawa, T., Kawakami, S., Sano, T., Komala, N., Saraspriya, S., and Suripto, A.: Seasonal variation of tropospheric ozone in Indonesia revealed by 5-years
10
ground based observations, J. Geophys. Res., 105, 1879–1888, 2000.
Garrett, T. J., Heymsfield, A. J., McGill M. J., Ridley, B. A., Baumgardner, D. G., Bui, T. P., and Webster, C. R.: Convective generation of cirrus near the tropopause, J. Geophys. Res., 109, D21203, doi:10.1029/2004JD004952, 2004.Gettelman, A., Salby M. L. and Sassi F., The distribution and influence of convection in the tropical tropopause region, J. Geophys. Res,
15
107, D10, doi:10.1029/2001JD001048, 2002.
Highwood, E. J. and Hoskins, B. J.: The tropical tropopause, Q. J. R. Meteorol. Soc., 124, 1579–1604, 1998.
Holton, J. R., Haynes, P. H., McIntyre, M. E., Douglass, A. R., Rood, R. B., and Pfister, L.: Stratosphere troposphere exchange, Rev. Geophys., 33, 403–439, 1995.
20
Holton, J. R. and Gettelman, A.: Horizontal transport and the dehydration of the stratosphere, Geophys. Res. Lett., 28, 2799–2802, 2001.
Joiner, J., Vasilkov, A., Yang, K., and Bhartia, P. K: Observations over hurricanes from the ozone monitoring instrument, Geophys. Res. Lett., 33, L06807, 2006.
Kelley, O. A. and Stout, J.: Convective towers in eyewalls of tropical cyclones observed by
25
the TRMM precipitation radar in 1998–2001, Proceedings of the AMS 20th Conference on Weather Analysis and Forecast/16 Conference of Numerical Weather Prediction, 12–16 Jan-uary 2004, Seattle, Washington.
Kirk-Davidoff, D.: The effect of climate change on ozone depletion through changes in strato-spheric water vapor, Nature, 402, 399, 1999.
30
Knollemberg, R. G., Kelly, K., and Wilson, J. C.: Measurements of high number densities of Ice Crystals in the tops of tropical cumulonimbus, J. Geophys. Res., 98, 8639–8664, 1993. Koteswaram, P.: On the structure of hurricanes in the upper troposphere and lower
strato-ACPD
7, 18319–18360, 2007 TTL and LS over cyclone Davina F. Cairo et al. Title Page Abstract Introduction Conclusions References Tables Figures ◭ ◮ ◭ ◮ Back CloseFull Screen / Esc
Printer-friendly Version Interactive Discussion
EGU
sphere, Mon. Weather Rev., 95, 541–564, 1967.
Kovacs, T. A. and McCormick, M. P.: Observations of Typhoon Melissa during the Lidar In-Space Technology Experiment (LITE), J. Appl. Met. 42, 1003–1013, 2003.
Kritz, M. A., Rosner, S. W., Kelly, K. K., Loewenstein, M., and Chan, K. R.: Radon measure-ments in the lower tropical stratosphere: evidence for rapid vertical transport and dehydration
5
of tropospheric air, J. Geophys. Res., 98, 8725–8736, 1993.
Kyro, E., Kiwi, R., Turunen, T., Aulamo, H., Rudakov, V. V., Khattatov, V. V., MacKenzie, A. R., Chipperfield, M. P., Lee, A. M., Stefanutti, L., and Ravegnani, F.: Ozone measurementsa during the Airborne Polar Experiment: aircraft instrument validation, isentropic trends and hemispheric fields prior to the 1997 Arctic ozone depletion, J. Geophys. Res., 105, 14 599–
10
14 612, 2000.
Levizzani, V. and Setvak, M.: Multispectral high resolution satellite observations of plumes on top of convective storms, J. Atmos. Sci., 53, 361–369, 1996.
MacKenzie, A. R., Schiller, C., Peter, T., Adriani, A., Beuermann, J., Bujok, O., Cairo, F., Corti, T., Di Donfrancesco, G., Gemsch, I., Kiemle, C., Kramer, M., Kroger, C., Merkulov,
15
V., Oulanovsky, A., Ravegnani, F., Rohs, S., Rudakov, V., Salter, P., Santacesaria, V., Stefanutti, L., and Yushkov, V.: Tropopause and Hygropause variability over the equa-torial Indian ocean during February and March 1999, J. Geophys. Res., 111, D18112, doi:10.1029/2005JD006639, 2006.
Matthey, R., Mitev, V., Mileti, G., Makarov, V., Turin, A., Morandi, M., and Santacesaria, V.:
20
Miniature aerosol lidar for automated airborne application, Laser radar technology and ap-plications V; Proceedings of the Conference, Orlando, USA, 26–28 April 2000, pp. 44–53, 2000.
Merrill, R. T.: Characteristics of the Upper-tropospheric Environmental flow around Hurricanes, J. Atmos. Sci., 45, 1665–1677, 1988.
25
Newell, R. E., Hu, W., Wu, Z.-X., Zhu, Y., Akimoto, H., Anderson, B. E., Browell, E. V., Gregory, G. L., Sachse, G. W., Shipham, M. C., Bachmeier, A. S., Bandy, A. R., Thornton, D. C., Blake, D. R., Rowland, F. S., Bradshaw, J. D., Crawford, J. H., Davis, D. D., Sandholm, S. T., Brockett, W., DeGreef, L., Lewis, D., McCormick, D., Monitz, E., Collins, J. E., Heikes, B. G., Merrill, J. T., Kelly, K. K., Liu, S. C., Kondo, Y., Koike, M., Liu, C.-M., Sakamaki, F.,
30
Singh, H. B., Dibb, J. E., and Talbot, R. W.: Atmospheric sampling of Supertyphoon Mireille with NASA DC-8 aircraft on September 27, 1991, during PEM-West A, J. Geophys. Res., 101(D1), 1853–1872, 1996.
ACPD
7, 18319–18360, 2007 TTL and LS over cyclone Davina F. Cairo et al. Title Page Abstract Introduction Conclusions References Tables Figures ◭ ◮ ◭ ◮ Back CloseFull Screen / Esc
Printer-friendly Version Interactive Discussion
EGU
Noone, K. J., Ogren, J. A., Heinzenberger, J., Charson, R. J., and Covert,,D. S.: Design and calibration of a counterflow virtual impactor for sampling atmospheric fog and cloud droplets, Aerosol Sci. Tech., 8, 235–244, 1988.
Peet, E., Rudakov, V., Yushkov, V., Redaelli, G., and MacKenzie, A. R.: Ozone and water vapour in the austral polar stratospheric vortex and sub-vortex, Ann. Geophys., 22, 4035–
5
4041, 2004,http://www.ann-geophys.net/22/4035/2004/.
Penn, S.: Ozone and temperature structure in a Hurricane, J. Appl. Meteorol. 4, 212–216, 1965.
Penn, S.: Temperature and ozone variations near tropopause level over hurricane Isbell, Octo-ber 1964, J. Appl. Meteorol., 5, 407–410, 1966.
10
Plumb, R. A.: A tropical pipe model of strotospheric transport, J. Geophys. Res., 101, 3957– 3972, 1996.
Ramanathan, V., Crutzen, P. J., Lelieveld, J., Mitra, A. P., Althausen, D., Anderson, J., Andreae, M. O., Cantrell, W., Cass, G. R., Chung, C. E., Clarke, A. D., Coakley J. A., Collins, W. D., Conant, W. C., Dulac, F., Heintzenberg, J., Heymsfield, A. J., Holben, B., Howell, S., Hudson,
15
J., Jayaraman, A., Kiehl, J. T., Krishnamurti, T. N., Lubin, D., McFarquhar, G., Novakov, T., Ogren, J. A., Podgorny, I. A., Prather, K., Priestley, K., Prospero, J. M., Quinn, P. K., Rajeev, K., Rasch, P., Rupert, S., Sadourny, R., Satheesh, S. K., Shaw, G. E., Sheridan P., and Valero, F. P. J.: Indian Ocean Experiment: an integrated analysis of the climate forcing and effects of the great indo-asian Haze, J. Geophys. Res., 106, 28 731–28 398, 2001.
20
Ray, E. A. and Rosenlof, K. H.: Hydration of the upper troposphere by tropical cyclones, J. Geophys. Res., 112, D12311, doi:10.1029/2006JD008009, 2007.
Richard, E. C., Rosenlof, K. H., Ray, E. A., Kelly, K. K., Thompson, T. L., and Mahoney, M. J.: Upper Tropospheric-Lower Stratospheric In-Situ Measurements Over Hurricane Floyd: The Impact of Tropical Cyclones on Stratosphere-Troposphere Exchange American Geophysical
25
Union, Fall Meeting 2001.
Rolph, G. D: Real-time Environmental Applications and Display sYstem (READY) Website (http:
//www.arl.noaa.gov/ready/hysplit4.html), NOAA Air Resources Laboratory, Silver Spring, MD, 2003.
Santacesaria, V., Carla, R., MacKenzie, A. R., Adriani, A., Cairo, F., Di Donfrancesco, G.,
30
Kiemle, C., Redaelli, G., Beuermann, J., Schiller, C., Peter, T., Luo, B., Wernli, H., Ravegnani, F., Ulanovsky, A., Yushkov, V., Sitnikov, N., Balestri, S., and Stefanutti, L.: Clouds at the tropical tropopause: A case study during the APE-THESEO campaign over the western