HAL Id: hal-02737874
https://hal.archives-ouvertes.fr/hal-02737874
Submitted on 21 Aug 2020
HAL is a multi-disciplinary open access
archive for the deposit and dissemination of
sci-entific research documents, whether they are
pub-lished or not. The documents may come from
teaching and research institutions in France or
abroad, or from public or private research centers.
L’archive ouverte pluridisciplinaire HAL, est
destinée au dépôt et à la diffusion de documents
scientifiques de niveau recherche, publiés ou non,
émanant des établissements d’enseignement et de
recherche français ou étrangers, des laboratoires
publics ou privés.
Search for water outgassing of (1) Ceres near perihelion
P. Rousselot, C. Opitom, E. Jehin, D. Hutsemékers, J. Manfroid, M.
Villarreal, J.-Y. Li, J. Castillo-Rogez, C. Russell, P. Vernazza, et al.
To cite this version:
P. Rousselot, C. Opitom, E. Jehin, D. Hutsemékers, J. Manfroid, et al.. Search for water outgassing
of (1) Ceres near perihelion. Astronomy and Astrophysics - A&A, EDP Sciences, 2019, 628, pp.A22.
�10.1051/0004-6361/201935738�. �hal-02737874�
Astronomy
&
Astrophysics
https://doi.org/10.1051/0004-6361/201935738
© P. Rousselot et al. 2019
Search for water outgassing of (1) Ceres near perihelion
?
P. Rousselot
1, C. Opitom
2, E. Jehin
3, D. Hutsemékers
3, J. Manfroid
3, M. N. Villarreal
4, J.-Y. Li
5, J. Castillo-Rogez
4,
C. T. Russell
6, P. Vernazza
7, M. Marsset
8, L. Roth
9, C. Dumas
10, B. Yang
2,11, T. H. Prettyman
5, and O. Mousis
71 Institut UTINAM UMR 6213, CNRS, Université Bourgogne Franche-Comté, OSU THETA, BP 1615,
25010 Besançon Cedex, France e-mail: rousselot@obs-besancon.fr
2 European Southern Observatory, Alonso de Còrdova 3107, Vitacura Casilla 19001, Santiago, Chile
3 Space sciences, Technologies & Astrophysics Research (STAR) Institute, University of Liège, Liège, Belgium 4 Jet Propulsion Laboratory, California Institute of Technology, Pasadena, CA 91109, USA
5 Planetary Science Institute, 1700 E Fort Lowell Road, Tucson, AZ 85719, USA
6 Earth, Planetary and Space Sciences, University of California, Los Angeles, 405 Hilgard Avenue, Los Angeles,
CA 90095-1567, USA
7 Aix-Marseille Université, CNRS, Laboratoire d’Astrophysique de Marseille, Marseille, France
8 Department of Earth, Atmospheric and Planetary Sciences, MIT, 77 Massachusetts Avenue, Cambridge, MA 02139, USA 9 School of Electrical Engineering, KTH Royal Institute of Technology, Stockholm, Sweden
10Thirty-Meter-Telescope, 100 West Walnut St, Suite 300, Pasadena, CA 91124, USA 11Yunnan Observatories, Chinese Academy of Sciences, Kunming 650011, PR China
Received 19 April 2019 / Accepted 13 June 2019
ABSTRACT
Context. (1) Ceres is the largest body in the main asteroid belt and one of the most intriguing objects in the solar system, in part
because of the discovery of water outgassing by the Herschel Space Observatory (HSO) and its still-debated origin. Ceres was the target of NASA’s Dawn spacecraft for 3.5 yr, which achieved a detailed characterization of the dwarf planet. The possible influence of the local flux of solar energetic particles (SEP) on the production of a Cerean exosphere and water vapor has been suggested, in addition to the sublimation of water ice that depends on the temperature, meaning the heliocentric distance.
Aims. We used the opportunity of both the perihelion passage of (1) Ceres in April 2018, and the presence of Dawn in its vicinity (for
measuring the SEP flux in real time) to check the influence of heliocentric distance and SEP flux on water outgassing.
Methods. We searched for OH emission lines near the limb of Ceres in the near-UV with the UVES spectrograph mounted on the
8-m ESO Very Large Telescope. Two spectra were recorded when Ceres was close to its perihelion, in February 2018, and with Dawn spacecraft orbiting Ceres. It was possible to simultaneously measure energetic particles around Ceres at the time of our observations.
Results. Our observations did not permit detection of OH emission lines to a very high sensitivity level. This level is estimated to
correspond to a global water production rate of QH2O∼ 2 × 1026molecules s−1, similar to the water production rate derived from HSO
observations. The solar energetic particles flux measured around Ceres was negligible at the time of these observations.
Conclusions. Our observations support the idea that heliocentric distance (i.e., the sublimation of water ice) does not play a major
role in the water emission from Ceres. This production rate could be either related to SEP events or to other mechanisms, possibly of endogenic origin.
Key words. minor planets, asteroids: individual: (1) Ceres
1. Introduction
Among the numerous asteroids that belong to the main belt, Ceres is one of the most interesting objects. This is due to the fact that it is the largest one (with an average diameter of 940 km, it is the only dwarf planet in the main belt) and presents unusual physical characteristics. The most intriguing of them is that Ceres presents water outgassing. This outgassing was first marginally detected with OH emission lines in the near-UV by using the International Ultraviolet Explorer (IUE) satellite (A’Hearn & Feldman 1992) but not confirmed by Rousselot et al.(2011) with the same lines using the Very Large Telescope (VLT). Water was directly detected through absorption of the continuum from Ceres by an H2O line byKüppers et al.(2014)
with the infrared Herschel Space Observatory (HSO). Observa-tions of atomic hydrogen and oxygen emission lines performed
?Based on observations collected at the European Southern
Observa-tory under ESO program 2100.C-5038(A).
later with the Hubble Space Telescope (HST) nevertheless failed to detect water outgassing (Roth et al. 2016;Roth 2018). Because the sensitivity of the observations of these different works was similar, it is clear that water outgassing is a transient phenomenon on the surface of Ceres.
The discovery of water outgassing is consistent with the internal structure of Ceres derived from the Dawn observations. These showed that Ceres is differentiated into a silicate core and an icy mantle (Ermakov et al. 2017). Hydrated minerals have been found ubiquitously on its surface (McCord et al. 2011;
de Sanctis et al. 2015), and nine water ice patches have been found poleward of about 30◦latitude (Combe et al. 2016,2019).
Ceres’ low density of 2.162 ± 0.003 g cm−3(Russell et al. 2016),
suggests a high content of ice up to 30 wt.%, if its porosity is low; however, hydrogen measurements reveal a receding ice table that contains about 10 wt.% water ice (Prettyman et al. 2017).
The investigations performed by NASA’s Dawn spacecraft, which was put into orbit around Ceres on 6 March 2015, provided an impressive detailed view of the surface. More than 130 bright
A22, page 1 of6
A&A 628, A22 (2019)
spots were counted from the Dawn data, but a bright dome inside the central pit on the floor of crater Occator (92 km) is of partic-ular interest. A possible explanation for the brightness variations observed at this crater is the production of haze (Nathues et al. 2015). Slow moving, condensed-ice particles or dust particles may explain this haze, if it really exists, as it was not con-firmed bySchröder et al.(2017). It is important to mention that the Occator crater position is related to one of the two longi-tudinal regions presenting the strongest water outgassing in the HSO data (see Fig. 2 ofKüppers et al. 2014).
Recent ground-based observations of Ceres also suggested short-term global spectral variability that was attributed to the changing amount of water ice on the surface by Perna et al.
(2015), despite the fact that the surface fraction covered by ice is very small (Combe et al. 2016,2019). Other recent ground-based observations performed with HARPS detected changes in the radial velocity of Ceres (Molaro et al. 2016). These changes are interpreted as changes in the albedo of Occator’s bright features with the rotation of Ceres.
All these observations indicate that Ceres presents a complex and temporally varying environment detectable from ground-based observations but for which very little is known. Recently, Dawn detected evidence for a transient atmosphere inferred from the Gamma Ray and Neutron Detector (GRaND) (Russell et al. 2016). That atmosphere appeared shortly after the passage of a large enhancement in the local flux of high-energy solar protons. Solar energetic particle (SEP) events temporarily increase the flux of protons from tens of keV to over 100 MeV by several orders of magnitude and are capable of sputtering water ice at or near the surface. Villarreal et al. (2017) highlighted a rela-tionship between SEP events and the detection of water vapor around Ceres (based on the HSO, IUE, VLT+UVES, and Dawn published observations).
Today, the main scientific issue related to the release of water vapor and the presence of a Cerean exosphere is to know if the vapor production is driven by sublimation (in which case it should vary with heliocentric distance, except in the case of tem-porary emission of water vapor due to impacts or landslides), or by SEP events. It is necessary to test, consequently, the depen-dence of vapor production on two critical parameters: (i) the heliocentric distance and (ii) the SEP events. Demonstrating the role of either or both of these parameters and water outgassing will strongly influence the modeling of this phenomenon and, consequently, will greatly help to constrain physical properties of Ceres’ surface.
In this paper, we present new observational results, based both on in situ observations of the SEP flux by Dawn near Ceres and ground-based, near-UV spectra capable of detecting OH emission around Ceres. These observations were conducted when Ceres was near its perihelion, providing new constraints for this scientific issue.
2. Observational data
Ceres was observed from a ground-based facility on 16 Febru-ary 2018, while the Dawn spacecraft was measuring SEP flux in the vicinity of the dwarf planet. The ground-based observations were performed at the European Southern Observatory using the 8.2 m UT2/Kueyen telescope of the Very Large Telescope (VLT) feeding the Ultraviolet and Visual Echelle Spectrograph (UVES;
Dekker et al. 2000). This instrument is a cross-dispersed echelle spectrograph designed to operate with high efficiency from the atmospheric cut-off at 300 nm to the long wavelength limit of the charge coupled device (CCD) detectors (about 1100 nm). To this
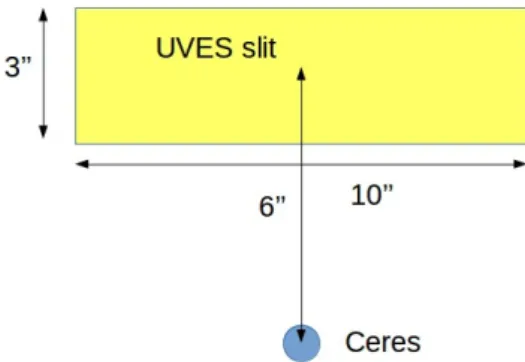
Fig. 1. Observing geometry of UVES observations. The diameter of Ceres is 0.8 arcsec.
aim, the light beam from the telescope can be split in two arms using a dichroic beam splitter (UV to blue and visual to red) within the instrument. Ceres was observed only with the blue arm centered at 346 nm, with a slit width of 3 arcsec providing a resolving power of λ/∆λ ∼15 000.
The slit was oriented perpendicular to Ceres’ spin axis, above the northern limb, at 6 arcsec from Ceres’ center (Fig.1). Two exposures of 4815 s of integration time, starting respectively at 2h23 and 3h38 UT, were obtained. During these expo-sures, the airmass changed from 1.8 to 2.1. At that time the heliocentric distance of Ceres was 2.567 au, the geocentric dis-tance 1.630 au, and the heliocentric velocity −0.41 km s−1. The
choice of the slit position was based on previous observations: (i)A’Hearn & Feldman(1992) detected OH in a sky region adja-cent to the northern limb of Ceres, (ii) our previous experience with UVES for detecting OH emission lines near Ceres revealed that data obtained closer to 4 arcsec from Ceres were signifi-cantly contaminated by stray light and could not be used for our calculations. Because of the slightly smaller Ceres magni-tude (V ∼ 7.1 vs 7.5 in 2007) we prefered to increase the distance between the slit and Ceres by a small amount. The OH radical being a dissociation product its density does not decrease too quickly with the projected radial distance to the center of Ceres. The limited observation time available did not permit the test-ing of different slit positions to optimize the signal-to-noise ratio (S/N) and the detection limit of OH.
The UVES/VLT observations were triggered under a Direc-tor Discretionary Time (DDT) proposal, on the basis of a signif-icant increase of the solar particle flux detected on 12 February by the EPAM instrument on board the Advanced Composition Explorer (ACE) mission. A coronal mass ejection (CME) was emerging from sunspot AR 2699 directed towards the Earth. At that time, Ceres was in near radial alignment with the Earth, and likely to also be impacted by the CME. The SEP proton fluxes that arrived at 1 au for this event were similar to that recorded during the June 2015 SEP event that preceded the electron bursts observed by Dawn (Russell et al. 2016), and were interpreted to be produced by an exospheric-supported bow shock.
Lab experiments indicate protons near 100 keV are the most efficient at sputtering water ice (Shi et al. 1995). Figure2shows a comparison between the 12 February 2018 event and the June 2015 event at 1 au for proton energies 550 keV–7 MeV detected by the 3D Plasma Analyzer on board the WIND spacecraft, which is located in the solar wind at Earth’s L1 Lagrange point. In both cases, the 550 keV–2 MeV protons jump about two orders of magnitude and roughly reach the same peak flux while proton fluxes only slightly increase above 2 MeV for the February 2018 event. Even though their magnetic footprints were separated by about 45◦, the SEP flux at Earth indicated A22, page 2 of6
Fig. 2.Comparisons of proton fluxes at Earth’s location during the June 2015 event (top panel) and February 2018 event (bottom panel) mea-sured by WIND. SEP fluxes for the February 2018 event are comparable for the 500 keV–2 MeV range, but are about an order of magnitude lower for energies above 4 MeV.
that the event produced protons with sufficient energy to trigger sputtering water ice at Ceres, should it impact the dwarf planet.
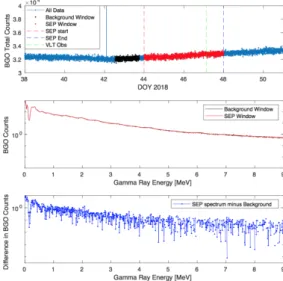
Dawn provided in situ measurements of the 12 February 2018 event at Ceres. Though Dawn’s payload does not include a plasma analyzer, it can indirectly detect protons >4 MeV through an increase in counts in its GRaND bismuth germanate (BGO) scintillator spectrum at 4.4, 6.1, and 6.9/7.1 MeV caused by par-ticle interactions of the protons with the spacecraft (Russell et al. 2016;Prettyman et al. 2011). The top panel of Fig.3shows the total counts recorded by the BGO detector of the GRaND instru-ment. The expected duration of the event is bounded by the red-and blue-dashed lines. These lines are the start red-and end times of the event at Earth shifted by 10 h, which is the approximate travel time for 4 MeV protons from the Earth to Ceres’ distance. As can be seen in Fig.3, there is some increase in the total counts of the BGO detector, but it does not appear to be related to the SEP event, as the rise in counts began before the expected arrival of the event and continued after the end of the event. To con-firm this, we averaged the spectra during a background window before the event and during the SEP period. Subtraction of the background window from the SEP window will indicate which channels (if any) show an enhancement in counts. The bottom panel of Fig.3shows no enhancements are observed at 4.4, 6.1, or 6.9/7.1 MeV. Hence, there is no obvious increase in counts due to the passage of a SEP event. Therefore, Dawn did not observe any evidence that the SEP event detected on 12 February at Earth’s location impacted Ceres. This implies that either the event completely missed Ceres or the flux of >4 MeV protons was too low for the event to be detected by GRaND.
3. Data processing and analysis
The spectra were reduced using the UVES pipeline1 in its 2D
mode, to keep the spatial information. The resulting spectra
1 ftp://ftp.eso.org/pub/dfs/pipelines/uves/
uves-pipeline-manual-22.17.pdf
Fig. 3.Procedure to identify energetic protons. Comparisons between the background window (black) and the SEP event window (middle panel) do not show any enhancements in the excited energy levels of carbon or oxygen, indicating that no energetic protons were present.
are corrected for extinction and flux calibrated using mas-ter response curves. The resulting 2D spectra are in units of 10−16 erg s−1cm−2Å−1. One-dimensional spectra are then
extracted by averaging the 2D spectra over the 38 pixels of the slit (0.2500per pixel) with simultaneous cosmic ray rejection.
Even at 6 arcsec from the Ceres center of light, a residual sunlight reflected spectrum coming from the scattered light of Ceres was still present on both 1D spectra. We used the high-resolution solar spectrum published byKurucz et al.(1984) with the appropriate convolution to subtract this continuum, in each spectrum. At the end, we merged the two 1D spectra flux and wavelength calibrated (and corrected for the geocentric velocity Doppler shift), and subtracted from solar continuum into a single 1D spectrum.
In order to search for OH emission lines, we used a syn-thetic spectrum. It was built using the fluorescence equilibrium reached by these radicals under the influence of the solar radia-tion. It takes into account the X2Πiand A2Σ+electronic levels,
both with vibrational levels v = 0, 1, 2 themselves with rotational levels up to N = 10. This model computes the resulting OH emis-sion spectrum obtained when the relative populations reach their equilibrium due to the absorption of solar radiation and sponta-neous emission of photons (more details in a forthcoming paper, see alsoRousselot et al. 2016).
We focus our search on the brightest OH lines belonging to the brightest emission band, which is the (0,0) band of the A2Σ+→ X2Πi system. We considered the lines in the spectral
range 3075–3105 Å. Figure4 represents the resulting observa-tional spectrum mentioned above and the OH synthetic spectrum superimposed. As can be seen in this figure, no OH emission line is detectable in our spectrum.
A more sensitive search for OH emission lines has been done by co-adding the different parts of the spectrum corresponding to the wavelengths of the brightest OH lines. After convolu-tion to match the spectral resoluconvolu-tion of the observed spectrum, eleven different OH lines are visible on the synthetic spectrum, corresponding to a total of 21 different emission lines (because some of them are not resolved by the spectrograph). We co-added the 11 corresponding parts of the observed and synthetic spec-tra respectively in order to improve the detection limit of the
A&A 628, A22 (2019)
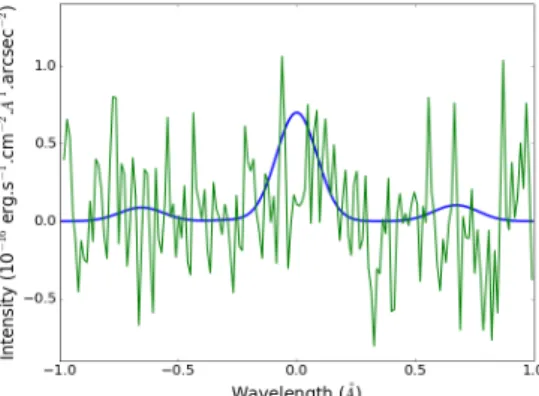
Fig. 4. Final observational spectrum (yellow) near northern limb of Ceres, obtained with UVES instrument. A synthetic OH spectrum of the (0,0) band (A2Σ+→X2Π
itransition) is superimposed in blue.
Fig. 5. Mean OH spectrum. This was obtained by summing the flux of the 11 brightest OH lines (after convolution). The green spectrum corresponds to the observational data, while the blue one is obtained from the synthetic OH spectrum shown in Fig.4.
OH emission lines. The resulting spectra, centered on the OH wavelengths (average spectrum), are shown in Fig.5.
Once again, no OH emission line can be detected, but this plot allowed us to derive a better upper limit for the OH emission, with the similar co-addition done from the syn-thetic spectrum. The upper limit (corresponding to a 2σ limit of the noise level of the co-added observational spectrum) is 0.7 × 10⁻¹⁶erg s−1cm−2Å−1arcsec−2. When integrated with the
spectral width (and multiplied by the number of spectra co-added, as Fig. 5 represents an average), we obtained an upper limit for all the OH lines that could have been detected of 1.7 × 10⁻¹⁶erg s−1cm−2arcsec−2.
From this upper limit, it was possible to estimate an upper limit for the water production rate of Ceres, if any. First, the flu-orescence efficiency (“g factor”) of the 21 OH lines taken into account for the search of OH emission can be computed from our fluorescence model for the heliocentric distance and velocity of Ceres at the time of observation. This fluorescence efficiency is 3.345 × 10⁻⁵photon molecule−1s−1(it represents 95% of the
total fluorescence efficiency of the (0,0) band).
Estimating an upper limit for the water production rate also implies an estimate of the total number of OH radicals present along the line of sight of the slit for a given water production rate. To compute this value we used a similar model to the one presented in Rousselot et al. (2011). It is a Monte-Carlo model based on a cometary coma model (Combi & Delsemme 1980) but adapted for a planetary body with significant grav-ity (about 50% of water molecules escaping from Ceres remain gravitationally bound). We used an average surface temperature
of Ceres’ surface of 175 K, meaning the temperature consid-ered inRousselot et al.(2011) (167 K) slightly increased to take into account the change of heliocentric distance, considering that the equilibrium temperature of a planetary body varies as r−0.5,
r being the heliocentric distance.
We used an initial ejection velocity for water molecules given by a Maxwell distribution with a temperature T = 175 K, which likely represents the average kinetic temperature of a hypothet-ical atmosphere close to Ceres’ surface. These water molecules move radially from Ceres with a decreasing velocity owing to the gravity field up to their photo-dissociation by the solar radi-ation. During their photo-dissociation, we consider that 91.8% of the water molecules create OH radicals, with an average ejec-tion velocity of 1050 m s−1 (Crovisier 1989). The OH radicals
are ejected isotropically from water molecules. We computed the trajectory of 107 water molecules for statistical purposes. The
lifetimes used in our model come fromCochran & Schleicher
(1993) for the water molecules (quiet Sun) and Schleicher & A’Hearn(1988) for the OH radicals. At the end, OH radicals are integrated along the line of sight according to the impact param-eters and integrated for the slit geometry corresponding to the observing circumstances.
We tested three different versions of this model:
(i) an isotropic ejection of water molecules everywhere in Ceres’ surface;
(ii) an isotropic ejection of water molecules only for the sunward side; and
(iii) an isotropic ejection of water molecules for the sunward side and the northern hemisphere.
In the end, in order to reach a total flux of 1.7 × 10⁻¹⁶ erg s−1cm−2arcsec−2 in the slit, with a
fluores-cence efficiency of 3.345 × 10⁻⁵ photon molecule−1s−1, our
model provided an upper limit for the water production rate QH2O
equal to ∼2 × 1026 molecules s−1 for all three cases mentioned
above (within the uncertainty of our Monte Carlo simulation, which is about 0.1 × 1026 molecules s−1). The influence of the
original location on Ceres ejecting water molecules seems to be very limited at the distance corresponding to our observations (6 arcsec at the geocentric distance of Ceres corresponds to a projected distance of 7000 km). This is probably due to the fact that we try to observe a dissociation product emitted isotropically from its parent molecule.
It is also interesting to test the influence of the tempera-ture, since the value of 175 K is rather approximate and would represent only an average temperature because the temperature varies with a diurnal cycle. Hayne & Aharonson (2015) com-puted the average and maximum temperature as a function of the latitude for Ceres. Their Fig. 4 provides an estimate of these temperatures. For mid-latitudes the maximum of temper-ature (corresponding to the local afternoon) can reach ∼220 K while the average temperature for a whole rotation period is ∼140 K. For these extreme values our model provided a water production rate comprising between ∼1.8 × 1026 (140 K) and
∼2.3 × 1026molecules s−1(220 K).
Our conclusion is that the overall upper limit for the water production rate is ∼2 × 1026 molecules s−1 (or 6 kg s−1). This
value is similar to the water production rate computed by
Küppers et al. (2014), which was also 2 × 1026 molecules s−1.
Our non-detection is, consequently, significant. Our upper limit appears less stringent than the one obtained with the same instrument during our previous observations performed in 2007 (Rousselot et al. 2011). Such a difference is probably due to a larger airmass and to a larger scattered flux coming from Ceres itself.
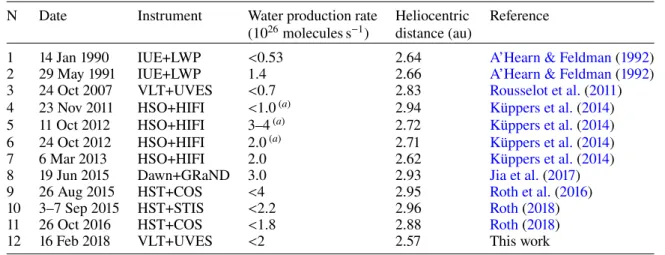
Table 1. Overview of all attempts to detect water vapor around Ceres.
N Date Instrument Water production rate Heliocentric Reference (1026molecules s−1) distance (au)
1 14 Jan 1990 IUE+LWP <0.53 2.64 A’Hearn & Feldman(1992)
2 29 May 1991 IUE+LWP 1.4 2.66 A’Hearn & Feldman(1992)
3 24 Oct 2007 VLT+UVES <0.7 2.83 Rousselot et al.(2011)
4 23 Nov 2011 HSO+HIFI <1.0(a) 2.94 Küppers et al.(2014)
5 11 Oct 2012 HSO+HIFI 3–4(a) 2.72 Küppers et al.(2014)
6 24 Oct 2012 HSO+HIFI 2.0(a) 2.71 Küppers et al.(2014)
7 6 Mar 2013 HSO+HIFI 2.0 2.62 Küppers et al.(2014)
8 19 Jun 2015 Dawn+GRaND 3.0 2.93 Jia et al.(2017)
9 26 Aug 2015 HST+COS <4 2.95 Roth et al.(2016)
10 3–7 Sep 2015 HST+STIS <2.2 2.96 Roth(2018)
11 26 Oct 2016 HST+COS <1.8 2.88 Roth(2018)
12 16 Feb 2018 VLT+UVES <2 2.57 This work
Notes. (a)SeeVillarreal et al.(2017) for these values, based on private communication fromKüppers et al.(2014). 4. Discussion
The new observations presented in this paper bring additional constraints on the origin of Ceres water vapor emission, but no strong arguments in favor of one origin. The easiest parameter to test, for the function of the water production rate measured, is the heliocentric distance. Thanks to the previous works men-tioned above, plus our new observational data, we now have 12 different attempts at detecting water vapor at 12 different Ceres locations along its orbit. Among this data set, five provided posi-tive results, and seven managed only to reach the upper limits on production rate. Table1provides details for all these attempts.
The semi-major axis of Ceres’ orbit being 2.768 au with an eccentricity of 0.0757, its heliocentric distance varies from 2.558 to 2.978 au, causing the solar flux received by its surface to vary by about 35% (significantly influencing the surface temperature and, consequently, water ice sublimation, if present near the sur-face). Alternatively, the present obliquity of its rotational axis is very small (∼3◦), preventing any significant effect related to
its obliquity from significantly influencing water emission from specific areas. If the detected emission of water vapor is due to the influence of solar radiation, creating “classical” cometary activity with sublimating water ice, it should be correlated to the heliocentric distance.
Figure 6 represents the detections and non-detections of water vapor emission along Ceres’ orbit. No correlation can be found between heliocentric distance and water vapor production rates. Our newest attempt was obtained closest to perihelion with a sensitivity level similar to the HSO observations, which were obtained at larger heliocentric distances. During our observa-tions no water vapor was observed. From the vapor production rates listed in Table1, we note that the observations closest to perihelion (numbers 1, 2, 7, and 12) resulted in observed mag-nitudes and upper limits less than or equal to those observed significantly further away (numbers 5, 6, and 8). The lack of any clear correlation between Ceres’ heliocentric distance and observed water vapor production rates does not favor the hypoth-esis of a water vapor emission created by sublimation of water ice analogous to comets (or, at least, if water vapor is emitted by this process, which is probable to some extent, then it is below the detection level).
If the emission of water vapor is not a function of the helio-centric distance, then it could be related, as mentioned above,
Fig. 6.Ceres’ position along its orbit. These positions correspond to the time of the different attempts to detect water molecules (the numbers refer to Table1).
to SEP events. The problem with studying the influence of these events is the difficulty in relating ion flux observed near Earth to the Ceres environment. The Dawn in situ observations are available only for atmospheric search attempts numbered 8 through 12 in Table 1. Dawn detected electron bursts inter-preted as the foreshock of an atmosphere-supported bow shock, which appeared immediately following a solar energetic particle event (Number 8). The HST telescopic observations (Numbers 9–11) occurred during periods when the sun was relatively quiet; consequently, no energetic particles were detected by Dawn during any of these attempts, which is consistent with their non-detections. Low fluxes of energetic protons were also observed by a near-Earth spacecraft. Such a relationship would argue in favor of this mechanism as a source of water vapor emission, nevertheless such a small sample is not really significant from a statistical point of view.
A&A 628, A22 (2019)
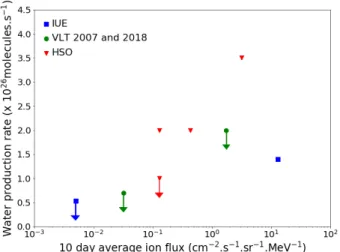
Fig. 7. Water vapor production rate reported vs. 2 MeV proton flux observed by EPAM ACE at 1 au (averaged over 10 days prior to tele-scopic attempts). Ion fluxes for IUE times of observation come from the OMNI database.
For the telescopic observations without in situ SEP monitor-ing, we can use the average ion flux observed near the Earth by instruments like ACE EPAM as a proxy, except for IUE data, obtained before the launch of ACE mission, for which we used the OMNI data provided by the Space Physics Data Facility2. It does not necessarily reflect the level of energetic
particles arriving at Ceres but is, nevertheless, indicative of pos-sible SEP events that could impact the dwarf planet. The results are shown in Fig.7. The 2 MeV proton fluxes reported in this plot should be regarded as a proxy for proton fluxes with lower energy (∼100 keV), which is more efficient at sputtering water ice (but only 2 MeV proton fluxes are available for all the times of observations). Such a plot seems to also confirm a relation-ship between SEP and water vapor production rates. While there appears to be a correlation, targeted telescopic observations dur-ing varydur-ing intensities of solar conditions need to be performed to establish the exact relationship between the solar energetic particles and water release.
Based on nine exposed water ice patches on Ceres recently detected by Dawn (Combe et al. 2019), Landis et al. (2019) computed, that water vapor due to sublimation of these sources (including ice-exposing impacts over the course of a Ceres year) should account for at least 0.16 kg s−1but less than 0.98 kg s−1.
These values are well below both our detection limit of 6 kg s−1
and the production rate detected with HSO. It is, consequently, difficult to confirm the contribution of ice sublimation from dis-crete patches to Ceres’ vapor production on the basis of the direct detection or non-detection of water vapor emission. These obser-vations are influenced by some other processes such as the ones mentioned above. Among themSchorghofer et al.(2017) men-tioned the possibility of an optically thin layer of ice formed by condensation of water molecules around the winter pole. Such a reservoir could rapidly be released under the influence of a SEP event and would form a denser transient water exosphere. This process would need, however, enough time (i.e., at least about half a Ceres year) for this reservoir to replenish (i.e., longer than the time elapsed between the positive HSO observations). This hypothesis is compatible with the present day observations, but the origin of water molecules released during a SEP event remains uncertain.
2 http://omniweb.gsfc.nasa.gov
5. Conclusions
The presence of an exosphere around Ceres, both inferred from Dawn observations of its surface and from ground-based obser-vations, is an important element for understanding the physical properties of this dwarf planet. The five positive exospheric detections and their magnitude variation do not yet have a well-established production mechanism. The two main mecha-nisms believed to produce such amounts of water molecules are sublimation of water ice recently exposed by impacts or land-slides, and sputtering from SEP events. The first mechanism does not seem to be confirmed by this work, because it would imply a correlation between the heliocentric distance and the observations of water molecules, which is contradictory to our non-detection performed just before perihelion. However, this non-detection calls for alternative sources of outgassing. In addi-tion to SEP impacts we can highlight other possibilities such as large exposed patches of ice by impact or landslide at low latitude in a short window prior to theKüppers et al.(2014) observations, whose activity has since faded (Landis et al. 2017); or exposure of fresh ice via endogenic mechanisms.
A definitive conclusion would require more observational support. Future observations should ideally be conducted in situ both because of the difficulty to predict SEP flux at Ceres from Earth-based solar wind monitors and because of the difficulty in monitoring OH emission lines around Ceres from ground-based observations.
Acknowledgements. E.J. and D.H are Belgian FNRS Senior Research Associates.
References
A’Hearn, M. F., & Feldman, P. D. 1992,Icarus, 98, 54
Cochran, A. L., & Schleicher, D. G. 1993,Icarus, 105, 235
Combe, J.-P., McCord, T. B., Tosi, F., et al. 2016,Science, 353, aaf3010
Combe, J.-P., Raponi, A., Tosi, F., et al. 2019,Icarus, 318, 22
Combi, M. R., & Delsemme, A. H. 1980,ApJ, 237, 633
Crovisier, J. 1989,A&A, 213, 459
de Sanctis, M. C., Ammannito, E., Raponi, A., et al. 2015,Nature, 528, 241
Dekker, H., D’Odorico, S., Kaufer, A., Delabre, B., & Kotzlowski, H. 2000,
Proc. SPIE, 4008, 534
Ermakov, A. I., Fu, R. R., Castillo-Rogez, J. C., et al. 2017,J. Geophy. Res. Planets, 122, 2267
Hayne, P. O., & Aharonson, O. 2015,J. Geophys. Res. Planets, 120, 1567
Jia, Y.-D., Villarreal, M. N., & Russell, C. T. 2017,J. Geophys. Res. Space Phys., 122, 4976
Küppers, M., O’Rourke, L., Bockelée-Morvan, D., et al. 2014,Nature, 505, 525
Kurucz, R. L., Furenlid, I., Brault, J., & Testerman, L. 1984,Solar Flux Atlas from 296 to 1300 nm(New Mexico: National Solar Observatory)
Landis, M. E., Byrne, S., Schörghofer, N., et al. 2017,J. Geophys. Res. Planets, 122, 1984
Landis, M. E., Byrne, S., Combe, J.-P., et al. 2019,J. Geophys. Res. Planets, 124, 61
McCord, T. B., Castillo-Rogez, J., & Rivkin, A. 2011,Space Sci. Rev., 163, 63
Molaro, P., Lanza, A. F., Monaco, L., et al. 2016,MNRAS, 458, L54
Nathues, A., Hoffmann, M., Schaefer, M., et al. 2015,Nature, 528, 237
Perna, D., Kaˇnuchová, Z., Ieva, S., et al. 2015,A&A, 575, L1
Prettyman, T. H., Feldman, W. C., McSween, H. Y., et al. 2011,Space Sci. Rev., 163, 371
Prettyman, T. H., Yamashita, N., Toplis, M. J., et al. 2017,Science, 355, 55
Roth, L. 2018,Icarus, 305, 149
Roth, L., Ivchenko, N., Retherford, K. D., et al. 2016,Geophys. Res. Lett., 43, 2465
Rousselot, P., Jehin, E., Manfroid, J., et al. 2011,AJ, 142, 125
Rousselot, P., Jehin, E., Hutsemekers, D., et al. 2016,AAS/Division for Planetary Sciences Meeting Abstracts, 8, 330.05
Russell, C. T., Raymond, C. A., Ammannito, E., et al. 2016,Science, 353, 1008
Schleicher, D. G., & A’Hearn, M. F. 1988,ApJ, 331, 1058
Schorghofer, N., Byrne, S., Landis, M. E., et al. 2017,ApJ, 850, 85
Schröder, S. E., Mottola, S., Carsenty, U., et al. 2017,Icarus, 288, 201
Shi, M., Baragiola, R. A., Grosjean, D. E., et al. 1995,J. Geophys. Res., 100, 26387
Villarreal, M. N., Russell, C. T., Luhmann, J. G., et al. 2017,ApJ, 838, L8