HAL Id: hal-00295238
https://hal.archives-ouvertes.fr/hal-00295238
Submitted on 26 Feb 2003
HAL is a multi-disciplinary open access
archive for the deposit and dissemination of
sci-entific research documents, whether they are
pub-lished or not. The documents may come from
teaching and research institutions in France or
abroad, or from public or private research centers.
L’archive ouverte pluridisciplinaire HAL, est
destinée au dépôt et à la diffusion de documents
scientifiques de niveau recherche, publiés ou non,
émanant des établissements d’enseignement et de
recherche français ou étrangers, des laboratoires
publics ou privés.
planning: predictions and observations of large-scale
features during MINOS, CONTRACE, and INDOEX
M. G. Lawrence, P. J. Rasch, R. von Kuhlmann, J. Williams, H. Fischer, M.
de Reus, J. Lelieveld, P. J. Crutzen, M. Schultz, P. Stier, et al.
To cite this version:
M. G. Lawrence, P. J. Rasch, R. von Kuhlmann, J. Williams, H. Fischer, et al.. Global chemical
weather forecasts for field campaign planning: predictions and observations of large-scale features
during MINOS, CONTRACE, and INDOEX. Atmospheric Chemistry and Physics, European
Geo-sciences Union, 2003, 3 (1), pp.267-289. �hal-00295238�
www.atmos-chem-phys.org/acp/3/267/
Chemistry
and Physics
Global chemical weather forecasts for field campaign planning:
predictions and observations of large-scale features during MINOS,
CONTRACE, and INDOEX
M. G. Lawrence1, P. J. Rasch2, R. von Kuhlmann1, J. Williams1, H. Fischer1, M. de Reus1, J. Lelieveld1, P. J. Crutzen1, M. Schultz3, P. Stier3, H. Huntrieser4, J. Heland4, A. Stohl5, C. Forster5, H. Elbern6, H. Jakobs6, and R. R. Dickerson7
1Max-Planck-Institut f¨ur Chemie, Postfach 3060, 55020 Mainz, Germany 2National Center for Atmospheric Research, Boulder, Colorado, USA 3Max-Planck-Institut f¨ur Meteorologie, Hamburg, Germany
4Institut f¨ur Physik der Atmosph¨are, Deutsches Zentrum f¨ur Luft- und Raumfahrt, Oberpfaffenhofen, Germany 5Technische Universit¨at M¨unchen, M¨unchen, Germany
6Institut f¨ur Geophysik und Meteorologie, Universit¨at zu K¨oln, K¨oln, Germany 7Department of Meteorology, University of Maryland, College Park, Maryland, USA
Received: 26 July 2002 – Published in Atmos. Chem. Phys. Discuss.: 15 October 2002 Revised: 17 January 2003 – Accepted: 29 January 2003 – Published: 26 February 2003
Abstract. The first global tropospheric forecasts of O3and
its precursors have been used in the daily flight planning of field measurement campaigns. The 3-D chemistry-transport model MATCH-MPIC is driven by meteorological data from a weather center (NCEP) to produce daily 3-day forecasts of the global distributions of O3and related gases, as well
as regional CO tracers. This paper describes the forecast system and its use in three field campaigns, MINOS, CON-TRACE and INDOEX. An overview is given of the forecasts by MATCH-MPIC and by three other chemical weather fore-cast models (EURAD, ECHAM, and FLEXPART), focus-ing on O3and CO. Total CO and regional CO tracers were
found to be the most valuable gases for flight planning, due to their relatively well-defined anthropogenic source regions and lifetimes of one to a few months. CO was in good agree-ment with the observations on nearly all the flights (gener-ally r > 0.7, and the relative RMS differences for the de-viations from the means was less than 20%). In every case in which the chemical weather forecasts were primarily re-sponsible for the flight plans, the targeted features were ob-served. Three forecasted phenomena are discussed in de-tail: outflow from Asia observed in the Mediterranean up-per troposphere during MINOS, outflow from North Amer-ica observed in the middle troposphere over northern Eu-Correspondence to: M. G. Lawrence
rope during CONTRACE, and the location of the “chemi-cal ITCZ” over the Indian Ocean during INDOEX. In par-ticular it is shown that although intercontinental pollution plumes such as those observed during MINOS and CON-TRACE occur repeatedly during the months around the cam-paigns, their frequency is sufficiently low (∼10–30% of the time) that global chemical weather forecasts are important for enabling them to be observed during limited-duration field campaigns. The MATCH-MPIC chemical weather fore-casts, including an interface for making customized figures from the output, are available for community use via http: //www.mpch-mainz.mpg.de/∼lawrence/forecasts.html.
1 Introduction
Field campaigns are an essential component in the study of physical and chemical processes controlling trace gas and aerosol concentrations in the atmosphere. Since the variabil-ity in meteorological fields and in production and loss pro-cesses results in variations in the distributions of gases and aerosols, careful planning is required in order to maximize the use of available resources to attain campaign objectives. While numerical weather prediction models and trajectory models have a long history of being used in campaign flight planning, chemistry-transport models (CTMs) have only
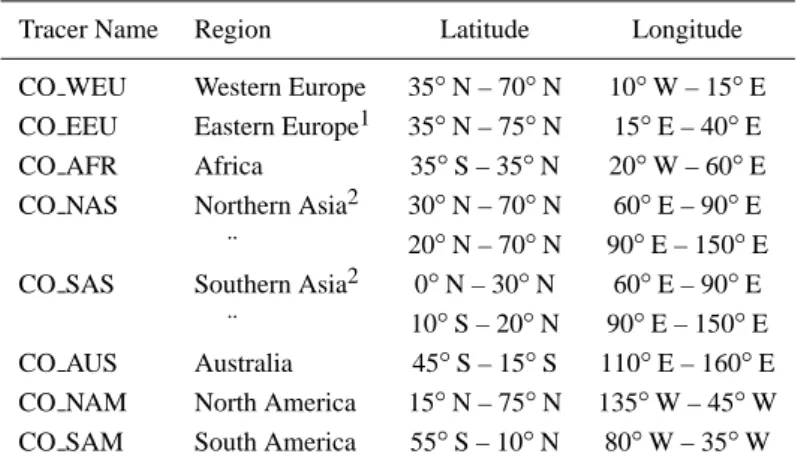
re-Table 1. CO Tracers and bounding regions
Tracer Name Region Latitude Longitude CO WEU Western Europe 35◦N – 70◦N 10◦W – 15◦E CO EEU Eastern Europe1 35◦N – 75◦N 15◦E – 40◦E CO AFR Africa 35◦S – 35◦N 20◦W – 60◦E CO NAS Northern Asia2 30◦N – 70◦N 60◦E – 90◦E ¨ 20◦N – 70◦N 90◦E – 150◦E CO SAS Southern Asia2 0◦N – 30◦N 60◦E – 90◦E
¨ 10◦S – 20◦N 90◦E – 150◦E CO AUS Australia 45◦S – 15◦S 110◦E – 160◦E CO NAM North America 15◦N – 75◦N 135◦W – 45◦W CO SAM South America 55◦S – 10◦N 80◦W – 35◦W
1Also includes emissions from some Middle East countries
2The northern and southern Asian CO tracer regions consist of two rectangles each, so that China is placed in the northern Asian region and
India is in the southern Asian region.
cently begun to be employed for this purpose. CTMs provide direct information on the expected state of atmospheric trace constituents on timescales of hours to days – the “chemical weather” – which depends on the integrated effects of meteo-rology, sources, photochemical reactions, aerosol nucleation and growth, and loss processes which an airmass undergoes prior to when it is sampled. In combination with informa-tion on the regional “chemical climate” – seasonal statistics of trace gas and aerosol distributions based on multi-year his-torical CTM or coupled chemistry-climate model runs – fore-casts of the chemical weather will likely become the primary tool for the daily planning of future atmospheric chemistry field campaigns.
Chemical weather forecasting for the stratosphere was first done for the ASHOE and SESAME campaigns (1994–95), during which Lee et al. (1997) used two global stratospheric CTMs (TOMCAT and SLIMCAT) to compute the antici-pated levels of O3 and other constituents of the arctic
po-lar vortex starting two weeks prior to each deployment. The first regional tropospheric chemistry forecasts were provided for the 1997 POLINAT campaign using the NILU chemistry-transport model (Flatoy et al., 2000).
Global tropospheric O3-chemistry forecasts were
com-puted for the first time during the 1999 Indian Ocean Ex-periment (INDOEX) with a prototype of the MATCH-MPIC system described here. Following that, global CO-tracer forecasts were computed during TRACE-P (April 2000) by both the ECHAM GCM (described in the Appendix) and the Harvard GEOS-CHEM CTM (http://www-as.harvard.edu/ chemistry/trop/geos/geos traps.html), and chemical weather forecasts were also provided by a variety of continental-scale regional models. An updated MATCH-MPIC forecast sys-tem was employed during MINOS (the Mediterranean
In-tensive Oxidants Study, July–August 2001), along with the ECHAM CO-tracer forecasts, and again during CONTRACE (Convective Transport of Trace Gases into the Upper Tropo-sphere over Europe, November 2001), in addition to global CO-tracer forecasts computed using the FLEXPART model, and regional chemical weather forecasts using the EURAD model (both described in the Appendix). A different version of MATCH is also being used to compute global aerosol fore-casts, which have been employed primarily during INDOEX and ACE-Asia; the aerosol forecasts profit from the assimi-lation of satellite measurements of aerosol optical depth, and are described elsewhere (Collins et al., 2001; Rasch et al., 2001).
The use of chemical weather forecasts in field campaigns is expanding rapidly. For instance, new forecast systems with regional CO tracers using the GEOS-CHEM (Har-vard) model and with gas phase O3-related chemistry using
MOZART (NCAR/Hamburg/GFDL) and CHASER (Univer-sity of Tokyo) were set up for use during ITCT 2k2 and PEACE-B (April–May 2002, see http://www.al.noaa.gov/ WWWHD/pubdocs/ITCT/2k2 and http://www.eorc.nasda. go.jp/AtmChem/GLACE/PEACE/htdocs/pcb.html). These campaigns also employed the global MATCH-MPIC and FLEXPART forecasts, the global aerosol forecasts by MATCH (NCAR), and various regional chemical weather forecast products. Recent developments in stratospheric chemical weather forecasting include the assimilation of global O3columns from satellite observations (Eskes et al.,
2002). Several regional chemical weather forecast systems have been set up at national weather centers. Extreme ad-vances in resolution may also soon be possible; recently, forecasts with a cloud resolving model (1X ≈ 1 km) have been used in a field campaign focused on convective
activ-ity (Benoit et al., 2002). International activities are being planned for the near future to develop elaborate global and nested-regional chemical weather forecast systems.
In light of this extensive effort, it is important to assess the quality and value of chemical weather forecasts in past field campaigns, and to consider where the most effort should be focused in the near future. Here we discuss the use of the MATCH-MPIC chemical weather forecast system during MINOS, CONTRACE and INDOEX. Following a descrip-tion of the model and the forecast system setup in the next section, we give a brief overview of the chemical weather forecasts and their use during the three campaigns, focusing on O3and CO. The model results are compared with the
ob-servations, documenting for the first time that a tropospheric CTM such as MATCH-MPIC is capable of successfully fore-casting several different types of pollution outflow. We then examine three forecasted phenomena in detail: the Asian monsoon plume over the Mediterranean (MINOS), the North American outflow observed over Europe (CONTRACE), and the location of the “chemical ITCZ” (intertropical conver-gence zone) over the Indian Ocean (INDOEX). We conclude with our perspectives on future developments in chemical weather forecasting.
2 Forecast model system setup
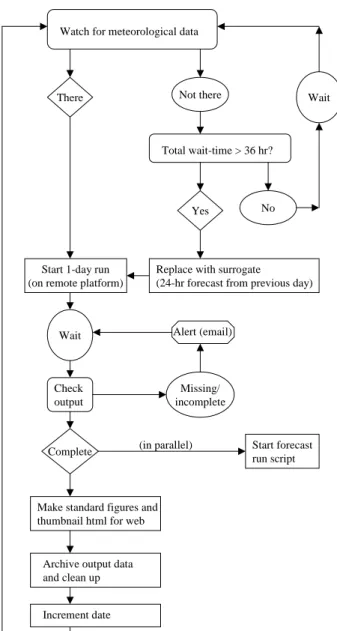
The chemical weather forecast system uses the Model of Atmospheric Transport and Chemistry, Max-Planck-Institute for Chemistry version 3.0 (hereafter MATCH-MPIC), de-scribed and evaluated in Rasch et al. (1997), Mahowald et al. (1997a,b), Lawrence et al. (1999), von Kuhlmann (2001) and von Kuhlmann et al. (2003). A description of the model is given in the Appendix. In addition to the extensive non-methane hydrocarbon (NMHC) oxidation mechanism de-scribed in von Kuhlmann (2001) and von Kuhlmann et al. (2003), the forecast runs include regional CO tracers. These have the same emissions as the normal CO over a chosen region (only industrial and biomass burning emissions are included, not secondary production from VOC oxidation or oceanic emissions), and are subjected to the model transport algorithms and the same losses as normal CO (note that dry deposition of the CO tracers was not included during MINOS and CONTRACE, but has since been incorporated). A list of the CO tracers and their bounding regions is given in Table 1. The basic procedure for producing the daily forecasts is outlined in Fig. 1. Each day’s run is fully automated and consists of two parts, a “near-real-time” (hereafter “NRT”) run and a forecast run. The NRT run employs the NCEP GFS (global forecast/analysis system, previously known as “AVN”) data to run forward one day at a time as soon as the previous day’s data are available. The forecast runs use the NCEP forecast data in place of the NCEP analysis. The NCEP data are made available daily via the internet (http:// www.nco.ncep.noaa.gov/pmb/products/avn). These data are
Watch for meteorological data
There Not there
Total wait-time > 36 hr?
Wait
No Yes
Start 1-day run (on remote platform)
Replace with surrogate
(24-hr forecast from previous day)
Alert (email) Check output Missing/ incomplete Wait
Complete Start forecast
run script
Archive output data and clean up
Increment date
(in parallel)
Make standard figures and thumbnail html for web
Fig. 1. Flowchart of the daily near real time and forecast runs
pro-cedure. The forecast run script follows the same procedure, except that no surrogates are used (the forecast run stops if the data does not become available). Within the fully-automated process there are several internal checks to ensure that the system is running as expected, with email alerts when problems arise.
retrieved at NCAR (Boulder) and interpolated from T170 (256 × 512 grid points in latitude and longitude) to the re-duced resolution data used for the runs in Mainz (currently T42, 64×128 grid points, or about 2.8◦in the horizontal, and 42 levels in the vertical up to about 2 hPa).
Once the data is transferred to Mainz, the daily NRT run starts up using the model restart file from the previous day and runs forward one day. If there is a delay in the data de-livery, the NCEP forecast data from the previous day is used as a surrogate for the NCEP analysis. This prevents the
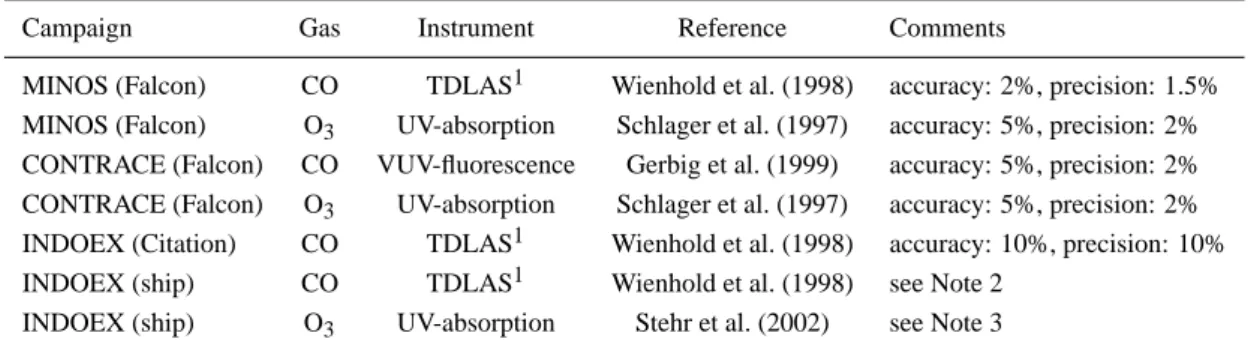
fore-Table 2. Summary of the measurements techniques used for the observations considered in this paper
Campaign Gas Instrument Reference Comments
MINOS (Falcon) CO TDLAS1 Wienhold et al. (1998) accuracy: 2%, precision: 1.5% MINOS (Falcon) O3 UV-absorption Schlager et al. (1997) accuracy: 5%, precision: 2% CONTRACE (Falcon) CO VUV-fluorescence Gerbig et al. (1999) accuracy: 5%, precision: 2% CONTRACE (Falcon) O3 UV-absorption Schlager et al. (1997) accuracy: 5%, precision: 2%
INDOEX (Citation) CO TDLAS1 Wienhold et al. (1998) accuracy: 10%, precision: 10% INDOEX (ship) CO TDLAS1 Wienhold et al. (1998) see Note 2
INDOEX (ship) O3 UV-absorption Stehr et al. (2002) see Note 3
1Tunable Diode Laser Absorption Spectrometer
2Redundant measurements with the technique of Dickerson and Delany (1998) were also made and found to be in very close agreement. 3Two identical instruments were used and were found to agree with each other to within 1% or 1 nmol/mol; the data was corrected for line
losses, and prior to the campaign a calibration against a NIST reference ozone detector agreed within 1%.
cast system from falling too far behind or stopping during active campaigns. In 2001, surrogates were used about 10% of the time; in 2002 this was reduced to about 6% of the time.
After the NRT run for a day is finished, pre-selected fig-ures are made and placed in the internet, the 3-hourly output data from MATCH-MPIC is archived, and the date is incre-mented to the next day. The archived output data is then available for making custom figures via the web interface. In parallel, the forecast run for the day is initialized using the restart file from the end of the day’s NRT run, and steps forward like the analysis run procedure in Fig. 1. The auto-mated runs and plots are normally done by about 06:00 UTC the next day, so that the 1-day forecast (which is actually for the current day) has been available in time for daily flight briefings for the three main campaigns participated in so far. In the discussion below we focus on the 2-day (48-hour) fore-cast fields; these are available about one day in advance after the computational lag time, and were generally the most crit-ical for making the flight plans.
The present forecast system started with a prototype run at T21 resolution on 1 May 2001, with the tracer distribu-tions initialized to the average for May 1998 from the base run in von Kuhlmann et al. (2003). On 1 June 2001, the fore-cast system was switched to T42 and has provided routine daily forecasts since. The model was thus given about three months to spin up before being used in the MINOS cam-paign (August 2001), and six months prior to CONTRACE (November 2001).
3 Forecasts and observations during MINOS,
CON-TRACE, and INDOEX
3.1 Field campaign descriptions and measurement tech-niques
This section briefly describes the three field campaigns, the measurements techniques employed, and the chemical weather forecasts used in each campaign (meteorological forecasts were available for all campaigns, along with for-ward and backfor-ward trajectories).
MINOS (http://www.mpch-mainz.mpg.de/∼reus/minos) was conducted during July and August 2001, in the eastern Mediterranean Sea. 14 research flights were made with the DLR Falcon based out of Heraklion, Crete. The objectives of MINOS included examining: (1) the transport of pollution to the Mediterranean region from Europe and from remote sources, especially Asia; (2) the chemical mechanisms in-volved in the build-up of oxidants and aerosols in the region; and (3) the export of pollutants to the global environment, e.g. towards Asia. Two chemical weather forecast systems were employed: (1) MATCH-MPIC and (2) regional CO tracers computed using the ECHAM5 GCM (see Appendix). The CONTRACE program (http://www.pa.op.dlr.de/ contrace) focuses on the processes which control the trans-port of trace gases, especially NOx, to the free troposphere (FT) over Europe. The first field campaign (CONTRACE 1, hereafter simply CONTRACE) was in November 2001, and focused on frontal uplifting, including transport of pollutants from North America to Europe (Stohl, 2001). A second, planned for summer 2003, will focus on transport and scavenging by deep convection. Four flights (three of them two-part) with the DLR Falcon were conducted during CONTRACE, based out of Oberpfaffenhofen (near Munich, Germany). Three separate chemical weather forecasts were used in the flight planning: (1) the MATCH-MPIC forecasts,
(2) CO tracer forecasts based on the FLEXPART Lagrangian particle dispersion model, and (3) regional O3-chemistry
forecasts using the EURAD model (see the Appendix for FLEXPART and EURAD setups).
A prototype of the MATCH-MPIC forecast system was used during INDOEX (http://www-indoex.ucsd.edu), which took place in the Indian Ocean region during January–April 1999. The major objectives were to assess the degree of chemical pollution and its dispersion over the region, and to examine the role of continental aerosols in the regional radia-tive forcing (Crutzen and Ramanathan, 2001). Several obser-vation platforms were involved, including two aircraft, two ships, several ground stations and satellites. The MATCH-MPIC chemical weather forecasts were used in planning sev-eral flights of the Dutch Cessna Citation (de Gouw et al., 2001), based out of Mal´e (4◦N, capital of the Maldives). These forecasts were computed using an earlier version of MATCH-MPIC (v2.0, described in Lawrence et al., 1999), also used for INDOEX in Lal and Lawrence (2001), which differed from the current version mainly in its use of a sim-plified chemistry scheme which neglected NMHCs. This al-lowed a higher horizontal resolution (T62, about 1.9◦) than the current system. The INDOEX forecasts were only com-puted from mid-February until the end of March 1999, with only a one-week spin-up period possible after initializing from the mean trace gas distributions computed for Febru-ary 1993 (from Lawrence et al., 1999).
The measurements techniques used during these cam-paigns are described in Table 2. Only CO and O3are
con-sidered here. During INDOEX there were no other gases that were measured on the aircraft which were also included in the model (except NO, which was generally below the de-tection limit of the instrument). The data on other gases ob-served during MINOS and CONTRACE and their compari-son with the model output are still under evaluation, and will be discussed in several other manuscripts in this special is-sue. Generally the comparison with CO is good, while O3
and other gases often show the same types of problems as seen in evaluations of the chemical climate as simulated by global models (e.g. Emmons et al., 1997; Hauglustaine et al., 1998; Lawrence et al., 1999; Thakur et al., 1999).
3.2 Overview of the forecast applications during the three field campaigns
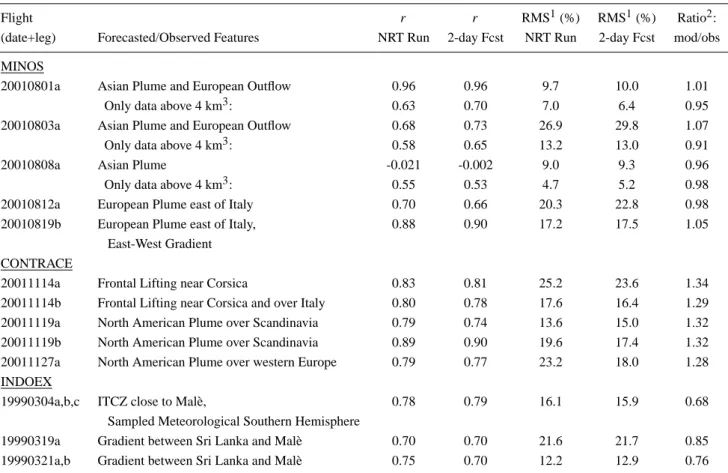
A summary of the flights for which the MATCH-MPIC fore-casts played a primary role in determining the flight plans is given in Table 3, along with the correlation coefficients, RMS errors, and ratios between the mean modeled and ob-served CO mixing ratios. In every case the main predicted features in the trace gas distributions were observed. Not only were the forecasts successful in this overall sense, but they were also generally well-correlated with the observa-tions on a flight-by-flight basis, with correlation coefficients (r) for CO nearly always above 0.7, and reaching as high
as 0.96. The RMS differences indicate that the variations (departures from the mean) in the modeled values were gen-erally within 10–20% of the observed spatial and temporal variations. There is only a slight degradation in the correla-tions and RMS differences for the 2-day forecasts compared to the NRT run. MATCH-MPIC tended to underestimate the mean CO levels by about 25% during INDOEX and over-estimate by about 30% during CONTRACE, whereas it is in close agreement with the MINOS data. The reasons for these regional offsets are still unclear. They are likely due to errors in the emissions inventories, though this is difficult to deter-mine definitively, since they are within the range of regional uncertainties in current emissions inventories. For the sake of flight planning, however, the reproduction of spatial and temporal variations (i.e. the correlation) is more important than prediction of absolute values. Note that the compar-isons of MATCH-MPIC output with the observations were done by making “virtual flights” through the model output, interpolating it in 4-D space/time to the position of the air-craft during the flights. This places a greater demand on the model than the alternative of averaging the observations onto the model domain.
The rest of this section gives a brief description of the overall primary forecast applications during the three cam-paigns, based on Table 3. In addition to the flights listed in Table 3, MATCH-MPIC forecasts played a secondary role in the planning of several other flights, especially during IN-DOEX, when the chemical weather forecasts were untested and more weight was normally placed on the traditional fore-cast products. Several flights were also guided by other crite-ria to which the forecast system described here did not apply, such as intercomparison flights between aircraft, and aerosol observations. A detailed description of the forecasts on a flight-by-flight basis, including the original forecast figures and comparisons to the observations for most of the flights, is available via http://www.mpch-mainz.mpg.de/∼lawrence/ forecasts/flight by flight imc/. The targeted features of the flights based on the chemical weather forecasts can be bro-ken down into three basic types:
1. boundary layer and lower tropospheric outflow of pol-lution from nearby populated regions (all three cam-paigns),
2. intercontinental pollution plumes (MINOS and CON-TRACE only), and
3. separation of the chemical northern and southern hemi-spheres by the intertropical convergence zone (IN-DOEX only).
The flights of the first type, observing near-surface pol-lution outflow, showed that while global chemical weather forecasts are able to predict the general regions where en-hanced mixing ratios should be seen on a day-to-day basis, such flights would benefit from higher resolution or from re-gional model forecasts. The plans for this flight type were in
Table 3. Summary of MATCH-MPIC forecasts and statistics of the comparisons between the modeled and observed CO mixing ratios
Flight r r RMS1(%) RMS1(%) Ratio2: (date+leg) Forecasted/Observed Features NRT Run 2-day Fcst NRT Run 2-day Fcst mod/obs MINOS
20010801a Asian Plume and European Outflow 0.96 0.96 9.7 10.0 1.01 Only data above 4 km3: 0.63 0.70 7.0 6.4 0.95 20010803a Asian Plume and European Outflow 0.68 0.73 26.9 29.8 1.07 Only data above 4 km3: 0.58 0.65 13.2 13.0 0.91 20010808a Asian Plume -0.021 -0.002 9.0 9.3 0.96 Only data above 4 km3: 0.55 0.53 4.7 5.2 0.98 20010812a European Plume east of Italy 0.70 0.66 20.3 22.8 0.98 20010819b European Plume east of Italy, 0.88 0.90 17.2 17.5 1.05
East-West Gradient CONTRACE
20011114a Frontal Lifting near Corsica 0.83 0.81 25.2 23.6 1.34 20011114b Frontal Lifting near Corsica and over Italy 0.80 0.78 17.6 16.4 1.29 20011119a North American Plume over Scandinavia 0.79 0.74 13.6 15.0 1.32 20011119b North American Plume over Scandinavia 0.89 0.90 19.6 17.4 1.32 20011127a North American Plume over western Europe 0.79 0.77 23.2 18.0 1.28 INDOEX
19990304a,b,c ITCZ close to Mal`e, 0.78 0.79 16.1 15.9 0.68 Sampled Meteorological Southern Hemisphere
19990319a Gradient between Sri Lanka and Mal`e 0.70 0.70 21.6 21.7 0.85 19990321a,b Gradient between Sri Lanka and Mal`e 0.75 0.70 12.2 12.9 0.76
1The relative root mean square differences are computed using the differences from the respective mean mixing ratios for each flight, i.e. 1
<x>
qP
[(xi−<x>)−(yi−<y>)]2
N , where i are the samples and the sum goes from 1 to N , the xi and yi are the observed and modeled CO
mixing ratios for each sample along the flight path, and < x > and < y > are the observed and modeled mean CO mixing ratios for the flight.
2Ratio of the modeled to observed mean CO mixing ratios.
3See the text for discussion of the correlations above 4 km; for the flight on 8 August, the poor correlations for the full vertical profile (i.e.,
including the data below 4 km) are due to a CO-rich layer at 3 km which was missed by the model (see Fig. 9d).
principle similar for INDOEX and MINOS, since both cam-paigns were based on islands in the outflow of major popula-tion centers. Both aimed for regions where the outflow was predicted to produce a considerable enhancement in the lev-els of key trace gases (e.g. CO) above the background values. Two such flights during INDOEX and four during MINOS were carried out based on the chemical weather forecasts. On all the flights, the pollutant outflow gradients were observed in the regions where they were predicted. However, espe-cially during MINOS some of the smaller scale details were missed in the forecasts. For instance, the flight on 19 August targeted a large-scale gradient towards higher CO levels in the east, based on the MATCH-MPIC forecasts. This overall gradient was observed, but a thin plume (∼ 1.1◦width in lon-gitude) of enhanced CO was also observed in the BL, which neither MATCH-MPIC nor ECHAM was able to resolve (the
horizontal resolution of both models was T42, ∼ 2.8◦). In this case, a higher resolution regional model may have been able to simulate this feature better.
The advantages of a higher resolution regional model were also seen during the 14 November CONTRACE flights, which targeted European pollution lofted to the FT near a trough in the western Mediterranean. All three chemical weather forecasts (MATCH-MPIC, FLEXPART, and EU-RAD) predicted enhanced trace gas mixing ratios up to 500 hPa in the region. However, only the regional model (EURAD) was able to predict strong enhancements in CO observed at 4–7 km along the flight path, due to outflow from local convection; both MATCH-MPIC and FLEXPART mis-placed the convection too far to the west of Corsica (note that in both models the convection is re-diagnosed based on the basic meteorological data, and is not taken directly from
X
30 60 90 10 20 30 40 50 6020010801 12 UTC
200 hPa
X
30 60 90 10 20 30 40 50 6020010725-20010808
200 hPa
a)
b)
Fig. 2. NCEP AVN winds at 200 hPa used to drive the
MATCH-MPIC runs: (a) average over the 2-week period up to the third MI-NOS flight (on 8 August); (b) instantaneous winds for 12:00 UTC, 1 August (date of the first MINOS flight). The “X” marks Crete.
NCEP; see the appendix for further information). The de-gree to which higher resolution regional models can consis-tently provide better forecasts of local convection effects than global models will be important to assess as more data be-comes available from chemical weather forecasts for recent and future field campaigns.
Global chemical weather forecasts, on the other hand, have the advantage of being able to predict intercontinental plume transport (supporting the third type of flights), which is gen-erally not possible with regional models. During MINOS the summer monsoon outflow from southern Asia was observed on three flights based on the MATCH-MPIC and ECHAM forecasts. Three plumes from North America were observed during CONTRACE with support from the MATCH-MPIC and FLEXPART forecasts. These plumes and the model re-sults are discussed in detail in the following two sections. Furthermore, the MATCH-MPIC forecasts were at a suffi-cient horizontal resolution to be able to predict the location of the sharp trace gas gradients between the northern and south-ern hemisphere at the intertropical convergence zone (ITCZ) during INDOEX, which is discussed in the final section be-low.
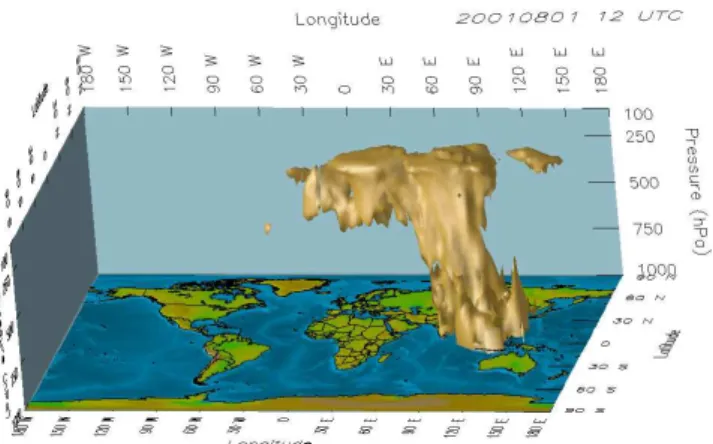
Fig. 3. 3-D structure of the southern Asian CO tracer from MATCH-MPIC (NRT run) at 12:00 UTC on 1 August 2001; the shaded region depicts mixing ratios above 25 nmol/mol.
X
-20 0 20 40 60 80 100 120 140 -10 0 10 20 30 40 50 60 70X
-20 0 20 40 60 80 100 120 140 -10 0 10 20 30 40 50 60 70 200 hPa 10 15 20 25 30 35 40 50 60Southern Asian CO (ppbv)
20010801 12 UTC Analysis 200 hPa 10 15 20 25 30 35 40 50 60Northern Asian CO (ppbv)
20010801 12 UTC AnalysisFig. 4. Distributions of the (a) northern Asian and (b) southern
Asian CO tracers at 200 hPa from MATCH-MPIC (NRT run) at 12:00 UTC on 1 August 2001. The “X” marks Crete, and the boxes delineate the regions where each CO tracer is emitted (at the sur-face). An animated version of this figure is available in the supple-mentary material – http://www.copernicus.org/EGU/acp/acp/3/267/ acp-3-267 supp.zip (12MB).
3.3 The Asian monsoon plume during MINOS
Every year during the summer monsoon period in Asia, deep convection lofts insoluble and moderately soluble pollutants from populated regions of southern Asia (especially India) into the upper troposphere (UT). These UT outflow plumes
X 0 20 40 60 80 100 120 0 10 20 30 40 50 60 200 hPa 1 2 5 10 15 20 30 August 1993 X 0 20 40 60 80 100 120 0 10 20 30 40 50 60 200 hPa 1 2 5 10 15 20 30 August 1995 X 0 20 40 60 80 100 120 0 10 20 30 40 50 60 200 hPa 1 2 5 10 15 20 30 August 1994 X 0 20 40 60 80 100 120 0 10 20 30 40 50 60 200 hPa 1 2 5 10 15 20 30 August 1996 X 0 20 40 60 80 100 120 0 10 20 30 40 50 60 200 hPa 1 2 5 10 15 20 30 August 1997 X 0 20 40 60 80 100 120 0 10 20 30 40 50 60 200 hPa 1 2 5 10 15 20 30 August 1998
Fig. 5. 6-year climatology of a southern Asian CO-like tracer at 200 hPa in August based on MATCH-MPIC, used in the pre-campaign
planning phase of MINOS; the tracer had the same emissions as CO but a constant 30-day lifetime everywhere, and the runs were driven by the NCEP reanalysis data (as used in Lawrence et al., 1999), rather than the NCEP AVN analysis data used for the forecast system described here.
are then frequently carried towards Africa by the tropical easterly jet on the southern side of the upper level Tibetan anticyclone (Fig. 2), then northwards over the Mediterranean at the western edge of an anticyclone over northern Arabia which is part of the Walker circulation in this region (Das, 1992). The locations of the Tibetan and Arabian UT anti-cyclones depicted in Fig. 2b vary, so that in the mean they form a large anticyclone covering the region from Tibet to the eastern Mediterranean (Fig. 2a). An example of the three-dimensional structure of the outflow plume resulting from this circulation is shown in Fig. 3; the plume is often present as an elongated, contiguous region of enhanced CO levels, mainly between 400–150 hPa.
The separation of the plume into the southern Asian and northern Asian CO tracers in MATCH-MPIC at 200 hPa is shown in Fig. 4 (see the supplementary material for an
ani-mation of this figure). In the MATCH-MPIC forecast runs, the northern Asian CO tracer was defined as two rectangles so that it included all of China (Table 1). This results in the northern Asian tracer being split into two outflow re-gions in the upper troposphere: to the east, Chinese emis-sions are transported to the UT by deep convection over the Pacific warm pool, and then carried in westerlies which are sufficiently strong to circle the globe and influence the UT CO levels over continental Europe; convection over south-ern China feeds the easterlies of the Tibetan anticyclone, so that the northern Asian CO merges with the southern Asian CO plume over the Bay of Bengal and India. In our analysis of the southern Asian plume during MINOS with MATCH-MPIC, we have found that in most cases the north-ern Asian and southnorth-ern Asian CO tracers contribute roughly equal amounts to the total CO. Since the partitioning into
20010801a 20010803a 20010808a 22 23 24 25 26 27 28 29 30 32 33 34 35 36 37 38 39 40 0 2 4 6 8 10 12 14 Longitude Latitude
MINOS Falcon Flights Z (km)
Fig. 6. The flight routes for the MINOS flights on 1, 3, and 8
Au-gust 2001. The routes are labeled by the date (YYMMDD), and by the flight leg (a in all three cases). The color coding indicates the altitude.
northern and southern tracers is rather arbitrary, in the anal-ysis of the forecast model results below only the sum of the two Asian tracers will be examined.
Based on analyses of multi-year wind fields, trajectories, and tracer simulations, it was hypothesized that the south-ern Asian monsoon outflow could be observed over the east-ern Mediterranean; this was one of the objectives of MI-NOS. The chemical nature of the plume is being analyzed by Scheeren et al. (2003). Here we concentrate on the plume’s spatial distribution, the comparison of model output with the observations, and the frequency of strong plume events in the region.
Figure 5 shows a six year climatology of the UT distribu-tion of a CO-like tracer from India which was used in plan-ning MINOS, based on a high resolution (T63) run done prior to MINOS with an earlier version of MATCH-MPIC (in that run, only a southern Asian component was included). The outflow to the west is directed mostly towards Arabia and northeast Africa; there is also a considerable dispersion of the plume to the east. In most years the monthly average ex-tent of the plume just barely reaches Crete, due to the north-ern Arabian UT anticyclone (Fig. 2) which brings airmasses northwards from Africa to the eastern Mediterranean, with the furthest northwest extent of the trajectories being close to Crete. There is, however, a significant interannual variability, with the average plume extending well past Crete in 1998. There is also a large day-to-day variability in the plume’s lo-cation and its CO mixing ratios (see the animation of Fig. 4 in the supplementary material). Such plumes would be diffi-cult to predict with standard meteorological fields or forward trajectories, since the plume depends on the integrated
ef-X -20 -10 0 10 20 30 40 50 60 70 15 20 25 30 35 40 45 50 55 60 200 hPa 50 60 70 80 90 100 150 CO (ppbv) 20010805 12UTC 48-hr Fcst X -20 -10 0 10 20 30 40 50 60 70 15 20 25 30 35 40 45 50 55 60 200 hPa 50 60 70 80 90 100 150 CO (ppbv) 20010803 12UTC 48-hr Fcst X -20 -10 0 10 20 30 40 50 60 70 15 20 25 30 35 40 45 50 55 60 200 hPa 50 60 70 80 90 100 150 CO (ppbv) 20010808 12UTC 48-hr Fcst X -20 -10 0 10 20 30 40 50 60 70 15 20 25 30 35 40 45 50 55 60 200 hPa 50 60 70 80 90 100 150 CO (ppbv) 20010801 12UTC 48-hr Fcst
Fig. 7. CO mixing ratios (nmol/mol) at 200 hPa predicted by MATCH-MPIC (2-day forecasts) for 12:00 UTC on (a) 1 August,
(b) 3 August, (c) 5 August, and (d) 8 August, 2001. These are
the same figures as those which were used in the field, giving a di-rect impression of the information which was available for the flight planning.
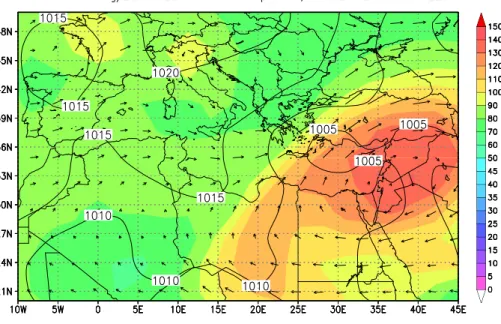
Fig. 8. CO mixing ratios (nmol/mol) at
about 200 hPa (model level 7) predicted by ECHAM (2-day forecasts) for 12:00 UTC on 1 August 2001. The figure has been remade post-campaign with mod-ified contours to facilitate comparison with MATCH-MPIC.
fects of: the strength of convection over Asia 5–7 days back, the strength and location of the Tibetan and northern Ara-bian anticyclones, the transport times (aging of the plume), and dilution due to mixing with other UT air masses. Thus, the chemical weather forecasts during MINOS were central to achieving the objective of observing the plume.
Three flights to examine the plume were conducted on 1, 3, and 8 August 2001. The first and third flights were conducted to the east of Crete, while the second was to the north (Fig. 6). Selected MATCH-MPIC forecast figures which were used in planning these flights are shown in Fig. 7. The forecasts in-dicate a region of measurable enhancements (∼ 20 nmol/mol over the background) to the south and east of Crete on 1 August, which advanced to the north on 3 August. By 5 August, the strong plume had passed by, but the next one reached Crete prior to the third flight on 8 August. The Asian CO tracers (see Fig. 4 for an example) showed similar pat-terns of enhanced values on the flight days. The ECHAM forecasts were generally in good agreement with MATCH-MPIC; Fig. 8 shows an example for 1 August. The differ-ences are relatively small in light of the different wind fields, emissions, and treatments of CO chemistry (“online” vs. “of-fline”). The Asian plume forecasts and the overall similarity between the two models resulted in three flights being con-ducted to intersect the plume.
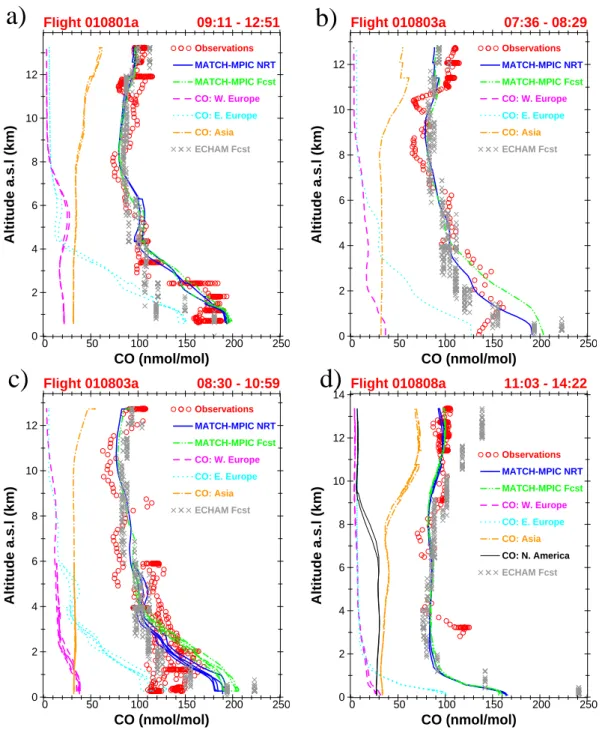
The observed and modeled vertical profiles, shown in Fig. 9, all indicate an enhancement in UT CO compared to the middle troposphere during each of the flights. In the first and third flights, the enhanced CO levels extend from about 8–13 km, while in the second flight the plume was only clearly observed above about 10 km. In all the profiles
the observed enhancement is ∼30–50 nmol/mol (from values of ∼70–80 nmol/mol below the plume to values of ∼100– 120 nmol/mol in the plume). These enhancements are also statistically significant in comparison to the typical UT CO levels in this region; Lelieveld et al. (2002) (in their Fig. 2) showed that the mean CO for these three flights above 8 km exceeded one standard deviation above the mean UT CO av-eraged over all 14 MINOS flights. The modeled enhance-ments are weaker (∼10–20 nmol/mol, with the exception of ECHAM for the 8 August flight), and generally limited to being above about 10 km. However, as will be shown be-low, the model shows clear plume signatures during the pe-riods that the enhanced values were measured. Furthermore, for these three flights, the regressions have also been com-puted for only the region above 4 km (Table 3); this results in correlation coefficients averaging 0.59 for the NRT run and 0.63 for the forecasts, and relative RMS deviations which are somewhat smaller than for the full vertical profiles. The MATCH-MPIC tracers (and the ECHAM tracers, not shown) attribute the enhanced UT CO levels to largely being due to Asian emissions. Since, as discussed above, several factors control the amount of Asian CO which reaches the UT near Crete, it is not clear what causes the models to generally un-derestimate the degree of enhancement in the plumes (com-pared to the middle troposphere).
Several other interesting features are also present, such as the near-surface enhancements originating from eastern Eu-rope, and the convective outflow near 5 km on 1 and 3 August with western and eastern European origins. North American CO also has a substantial influence in this region up to 8 km according to MATCH-MPIC (shown for 8 August in Fig. 9d,
Observations MATCH-MPIC NRT MATCH-MPIC Fcst CO: W. Europe CO: E. Europe CO: Asia ECHAM Fcst 0 50 100 150 200 250 0 2 4 6 8 10 12 CO (nmol/mol) Altitude a.s.l (km) Flight 010803a 07:36 - 08:29 Observations MATCH-MPIC NRT MATCH-MPIC Fcst CO: W. Europe CO: E. Europe CO: Asia ECHAM Fcst 0 50 100 150 200 250 0 2 4 6 8 10 12 CO (nmol/mol) Altitude a.s.l (km) Flight 010803a 08:30 - 10:59 Observations MATCH-MPIC NRT MATCH-MPIC Fcst CO: W. Europe CO: E. Europe CO: Asia CO: N. America ECHAM Fcst 0 50 100 150 200 250 0 2 4 6 8 10 12 14 CO (nmol/mol) Altitude a.s.l (km) Flight 010808a 11:03 - 14:22 Observations MATCH-MPIC NRT MATCH-MPIC Fcst CO: W. Europe CO: E. Europe CO: Asia ECHAM Fcst 0 50 100 150 200 250 0 2 4 6 8 10 12 CO (nmol/mol) Altitude a.s.l (km) Flight 010801a 09:11 - 12:51
a)
d)
b)
c)
Fig. 9. Vertical profiles of observed CO mixing ratios (nmol/mol), along with the model output (MATCH-MPIC and ECHAM) corresponding
to the flight trajectories for the MINOS flights; the MATCH-MPIC CO is shown for both the near real time (NRT) run and the 2-day forecasts (Fcst), and also includes the regional CO tracers (NRT run) for Western Europe, Eastern Europe, Asia and North America (only panel d). (a) Flight 1 on 1 August, (b) Flight 2 on 3 August, outbound leg, (c) Flight 2 on 3 August, return leg, (d) Flight 3 on 8 August. The date and the time range during which each profile was observed is given above each panel. The MATCH output is interpolated in time and space to the flight location every 15 seconds. The ECHAM output is not interpolated, but instead uses the nearest neighbors in time and space; the model levels above and below the observations were both plotted if the flight level was more than 30 hPa away from the nearest model level.
also similar for the earlier flights). The North American CO decreases over the same altitude range as the Asian CO con-tribution is increasing, resulting in roughly constant modeled total CO between 8–9 km. It is remarkable that above about 2 km during the third flight, the total CO is dominated by
emissions from outside Europe. During the earlier flights (Fig. 9a–c), the European CO emissions contributed substan-tially up to about 6 km, but above this the CO from other re-gions again dominated. The extent and implications of this strong influence of intercontinental transport to the
0 20 40 60 80 100
35N, 25E
154 hPa (level 13)
Julian Day CO (nmol/mol) 182 189 196 203 210 217 224 231 238 245 252 259 266 273 0 20 40 60 80 100
35N, 25E
207 hPa (level 15)
Julian Day CO (nmol/mol) 182 189 196 203 210 217 224 231 238 245 252 259 266 273 0 20 40 60 80 100
35N, 25E
305 hPa (level 18)
Julian Day CO (nmol/mol) 182 189 196 203 210 217 224 231 238 245 252 259 266 273
a)
c)
b)
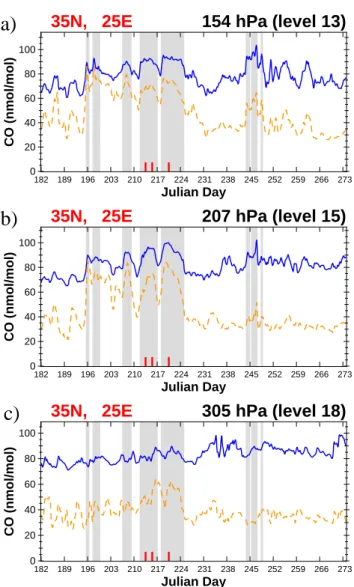
Fig. 10. Mixing ratios (nmol/mol) of CO (blue, solid line) and the
Asian CO (orange, dashed line) over Crete from 1 July 2001 (Julian Day 182) to 30 September 2001 (Julian Day 273) at (a) model level 13 (∼ 150 hPa), (b) model level 15 (∼ 200 hPa), (c) model level 18 (∼ 300 hPa) computed by MATCH-MPIC (NRT run). The flights on 1, 3, and 8 August are marked with red dashes. The shaded re-gions indicate times when a strong plume was present in the column (with COt = 25 nmol/mol, see the text for details). Since the CO
tracers were still undergoing spin-up (they were initialized to zero on 1 May), they have been normalized (detrended) so that the total global mass of all the tracers together sums to 80% of the total CO mass, assuming that ∼ 20% of the global CO burden is from the oxidation of CH4and other hydrocarbons.
ranean region are discussed in Lelieveld et al. (2002). How frequently was this plume present over Crete and the surrounding region during MINOS and the months before and after? Figure 10 shows the time series of CO and the Asian CO tracers above Crete during July–September 2001, based on the MATCH-MPIC NRT run output (the 2-day fore-cast time series values are hardly discernible from the NRT
Fig. 11. 3-D structure of the North American CO tracer from MATCH-MPIC (NRT run) at 12:00 UTC on 19 November 2001; the shaded region depicts mixing ratios above 70 nmol/mol.
Table 4. Percentages of time that strong Asian plumes were present
in the Mediterranean region and strong North American plumes were present over northern Europe, based on various exceedence thresholds CO1t Location 20 25 30 MINOS Crete 38.6 22.7 12.1 Crete + 10◦E 63.0 41.8 20.4 Crete + 10◦S 51.2 32.3 20.1 Crete + 10◦W 25.0 8.7 3.0 CONTRACE Stockholm 10.9 2.2 1.5 Copenhagen 13.6 5.3 2.2 Munich 16.0 6.0 1.8 Brussels 18.9 10.9 3.4
1Threshold exceedence value (CO
t) in nmol/mol (see text for
de-tails).
run, and are not plotted). We define a “strong plume” in a given model layer as any time the total CO and the Asian CO both exceed the 3-month minimum value in that layer by more than an arbitrary threshold value, COt, where the min-imum value is taken to be representative of the background CO levels, and COtis chosen to be between 20–30 nmol/mol (representing a clearly discernible signal in the measure-ments). The presence of a strong plume in the column is then defined as any time this criterion is met at any model level. The periods of a strong plume in the column above Crete (with COt =25 nmol/mol) are indicated on Fig. 10 as regions of gray shading. Using this threshold, a strong plume
X -60 -40 -20 0 20 40 40 50 60 70 80 90 600 hPa 40 50 60 70 80 90 100 120 150 North American CO (ppbv) 20011118 15 UTC Analysis X -60 -40 -20 0 20 40 40 50 60 70 80 90 600 hPa 40 50 60 70 80 90 100 120 150 North American CO (ppbv) 20011119 9 UTC Analysis
d)
X -60 -40 -20 0 20 40 40 50 60 70 80 90 600 hPa 40 50 60 70 80 90 100 120 150 North American CO (ppbv) 20011117 15 UTC Analysis X -60 -40 -20 0 20 40 40 50 60 70 80 90 600 hPa 40 50 60 70 80 90 100 120 150 North American CO (ppbv) 20011119 15 UTC Analysisb)
a)
c)
Fig. 12. Distributions of the North American CO tracer at 600 hPa
from MATCH-MPIC (NRT run) at (a) 15:00 UTC on 17 November 2001, (b) 15:00 UTC on 18 November 2001, (c) 09:00 UTC on 19 November 2001, and (d) 15:00 UTC on 19 November 2001. The “X” marks Oberpfaffenhofen. An animated version of this figure is available in the supplementary material – http://www.copernicus. org/EGU/acp/acp/3/267/acp-3-267 supp.zip. X -20 -10 0 10 20 30 40 20 30 40 50 60 70 500 hPa 70 80 90 100 110 120 130 150 200 CO (ppbv) 20011119 12UTC 48-hr Fcst
a)
b)
X -20 -10 0 10 20 30 40 20 30 40 50 60 70 500 hPa 70 80 90 100 110 120 130 150 200 CO (ppbv) 20011119 12UTC 48-hr Fcsta)
b)
Fig. 13. Forecasted distributions of (a) CO predicted by
MATCH-MPIC and (b) North American CO tracer predicted by FLEXPART (2-day forecasts) for 12:00 UTC on 19 November 2001, at 500 hPa. The “X” marks Oberpfaffenhofen.
is present above Crete 23% of the time. Table 4 lists the per-centages for COt values of 20, 25 and 30 nmol/mol, as well as for the locations 10◦east, south, and west of Crete. South and east of Crete the strong plumes are more frequent; 10◦ east of Crete, with COt =25 nmol/mol, the plume is present over 40% of the time during the three months. To the west of Crete, enhancements of up to 20 nmol/mol are still com-mon (25% of the time), but more substantial enhancements of 25–30 nmol/mol are rare.
Focusing specifically on the role of the chemical weather forecasts, a strong plume was present over Crete for much of the period between Julian Day 196 (15 July) and 224 (12
0 5 10 15 20 45 50 55 60 65 0 2 4 6 8 10 Longitude Latitude
CONTRACE Falcon Flights, 20011119 Z (km)
Fig. 14. The route of the CONTRACE flight on 19 November 2001,
color coded by altitude.
August), confined mostly to the model levels above 300 hPa. The most persistent presence of the plume and its greatest vertical extent (down to ∼ 400 hPa) was during the first week of MINOS flights (starting 1 August); the times of the three flights which targeted the plume are also marked on the fig-ure. Following that, the plume only reached Crete once more around day 245 (2 September), after the flight campaign was over, and at a level (150 hPa) which would have been at the ceiling of the DLR Falcon. This emphasizes the important role the chemical weather forecasts had in the successful de-ployment of the Falcon to observe the plume during the first week of the campaign, prior to the flights focusing primarily on other objectives.
3.4 The North American plume during CONTRACE
Based on a recent analysis of the transport of pollutants from North America to Europe (Stohl, 2001) one of the objectives of CONTRACE was to observe the pollution plumes result-ing from liftresult-ing in frontal disturbances. Three such plumes were observed during CONTRACE, one over southern Scan-dinavia and Germany (19 November), one over Germany (22 November), and one over Belgium (27 November). This sec-tion focuses on the first plume. The origins of the first and third plumes are discussed in Stohl et al. (2003), and a char-acterization of the chemical nature of the first two plumes is given by Huntrieser et al. (manuscript in preparation). Here we consider the North American plume from the same per-spective as the Asian monsoon plume in the previous sec-tion, focusing on the MATCH-MPIC forecasts, the compari-son with the observations, and the frequency of such plumes. The North American plume observed during CONTRACE on 19 November 2001 is depicted in Figs. 11 and 12 in
b)
a)
Fig. 15. Comparison of observed and modeled (MATCH-MPIC)
CO mixing ratios (nmol/mol) and modeled CO regional tracers along the flight path of the CONTRACE flight on on 19 Novem-ber 2001, (a) from ONovem-berpfaffenhofen to Stockholm, (b) from Stock-holm to Oberpfaffenhofen. The thin black line indicates the altitude, and the ovals indicate the times when the plume was flown through.
terms of the MATCH-MPIC North American CO tracer. The wintertime transatlantic transport of North American pollu-tants occurs as intermittent air masses lofted by frontal dis-turbances along the North American east coast, which are then mostly confined to the middle troposphere (MT), be-tween ∼ 500–800 hPa. The transport routes vary widely from crossing the Atlantic at ∼ 45◦N to first entering European air space over northern Greenland and Scandinavia (see the animation of Fig. 12 provided in the supplementary mate-rial). The plume observed on 19 November was lifted into the MT between Maine and southern Greenland on 16 and 17 November. An anticyclone over the north Atlantic pulled the original plume apart into two distinct, polluted airmasses, one which remained over Greenland, and another which was rapidly transported at the northern edge of the anticyclone, reaching Norway in the afternoon on the 18th and Germany by the afternoon of the 19th.
The original forecasts figures from MATCH-MPIC and FLEXPART used to plan the flight on 19 November are shown in Fig. 13. Both indicate a clear enhancement in CO from North America over Scandinavia and northern-central Europe (MATCH-MPIC shows the total CO, which was par-ticularly useful in the flight planning since it indicated that the signal should be easily observable within instrumental uncertainty). The qualitative resemblance between the
fore-b)
d)
a)
c)
e)
f)
Fig. 16. Vertical profiles of observed CO mixing ratios (nmol/mol), along with the model output (MATCH-MPIC) corresponding to the flight
trajectories for the CONTRACE flight from Oberpfaffenhofen to Stockholm on 19 November 2001; the MATCH-MPIC CO is shown for both the near real time (NRT) run and the 2-day forecasts (Fcst), and also includes the regional CO tracers (NRT run) for Western Europe, Eastern Europe and North America. The time range during which each profile was observed is given above each panel. The profiles are located: (a) near Munich (ascent), (b) over Denmark (descent), (c) over Norway (ascent), (d) near Stockholm (descent), (e) near Stockholm (ascent), and (f) near Munich (descent).
casts at 500 hPa, despite the widely differing model formula-tions, provided a considerable degree of confidence for the flight planning. The MATCH-MPIC CO tracers indicated that about half the CO in this layer came from North Amer-ica, and the FLEXPART standard forecast figures indicated that the North American plume would also be prevalent at 700 hPa. Based on these forecasts, a flight across southern Scandinavia (Fig. 14) was planned for 19 November.
The observed CO levels and the MATCH-MPIC CO and CO tracers are shown in Figs. 15 and 16. The North Amer-ican plume was flown through 5 times during the two flight legs. The observations show a thin layer of clearly enhanced CO around 2.5–3 km during the first leg (Fig. 16b–d), and a second, weaker layer near 4 km. The plume was again observed during the return leg (Fig. 16e and f), with the
strongest layer at ∼ 4 km and a weak enhancement at 2.5 km during the final descent. These very thin layers are in contrast to the Asian monsoon plume, which extended up to several km in the vertical. MATCH-MPIC (forecasts and NRT run) computed a single layer of North American CO, about 2 km deep and centered around 3–4 km; the absence of the layer is also correctly predicted in the first profile (Fig. 16a). Further investigation is needed to determine whether the tendency for MATCH-MPIC to smear out the plumes is due to arti-ficial diffusion resulting from the moderate vertical resolu-tion (∼ 0.6–0.8 km) or whether excessive physical diffusion or other transport errors are the main cause.
It is remarkable that both the observations and the model (NRT run) indicate the presence of a strong plume near Mu-nich in the late afternoon but not in the morning, considering
0 20 40 60 80 100 120 140
160 56N, 13E 504 hPa (level 23)
Julian Day CO (nmol/mol) 274 281 288 295 302 309 316 323 330 337 344 351 358 365 0 20 40 60 80 100 120 140
160 48N, 12E 479 hPa (level 23)
Julian Day CO (nmol/mol) 274 281 288 295 302 309 316 323 330 337 344 351 358 365 0 20 40 60 80 100 120 140 160 51N, 4E 509 hPa (level 23) Julian Day CO (nmol/mol) 274 281 288 295 302 309 316 323 330 337 344 351 358 365 0 20 40 60 80 100 120 140
160 59N, 18E 506 hPa (level 23)
Julian Day CO (nmol/mol) 274 281 288 295 302 309 316 323 330 337 344 351 358 365
a)
d)
b)
c)
Fig. 17. Mixing ratios (nmol/mol) of CO (blue, solid line), North
American CO (orange, dash-dot line), and Western European CO (magenta, dashed line) from 1 October 2001 (Julian Day 274) to 31 December 2001 (Julian Day 365) at model level 23 (∼ 500 hPa) over (a) Stockholm, (b) Copenhagen, (c) Munich, and (d) Brussels, based on the MATCH-MPIC NRT run. The flight on 19 Novem-ber is marked with a red dash on panels (a)–(c), and the flight on 27 November is marked on panel (d). The shaded regions indi-cate times when a strong plume was present in the column (with COt =25 nmol/mol, see the text for details). The CO tracers were
detrended for spin-up as described in Fig. 10
that the ascending and descending profiles passed through 4 km altitude within 100 km (about 1 degree) of each other. According to the MATCH-MPIC results shown earlier in Fig. 12c and d, this was due to the rapid transport of the plume southwards during the day. At 600 hPa, between 09:00
X
40 50 60 70 80 90 100 110 120 -15 -10 -5 0 5 10 15 20 25 30 Surface 50 75 100 125 150 200 300 19990227 06Z 36-hr FcstX
M
40 50 60 70 80 90 100 110 120 -15 -10 -5 0 5 10 15 20 25 30 Surface 50 75 100 125 150 200 300 19990304 06Z 36-hr FcstCO (nmol/mol)
X
40 50 60 70 80 90 100 110 120 -15 -10 -5 0 5 10 15 20 25 30 Surface 50 75 100 125 150 200 300 19990319 06Z 36-hr Fcstb)
a)
c)
Fig. 18. Surface level distributions of CO based on the
MATCH-MPIC 36-hour forecasts for: (a) 27 February (first crossing of the ITCZ by the Ron Brown, marked with “X”), (b) 4 March (southern-hemisphere flight with the Citation; southernmost profile is marked with “X”, Mal´e is marked with “M”), and (c) 19 March (second encounter with the ITCZ by the Ron Brown, marked with “X”). The position markings were added post-campaign. The ITCZ is characterized by the transition from typical northern hemispheric values (>80 nmol/mol, light blue) to typical southern hemispheric values (<70 nmol/mol, dark blue).
and 15:00 UTC the edge of the plume region with significant CO tracer mixing ratios advances from northern Germany to southern Germany, so that the plume was flown over during
the steep ascent in the morning, but was intersected during the descent into Oberpfaffenhofen in the afternoon. Notably, the descent into Oberpfaffenhofen was a case in which the forecasts failed to predict the presence of a strong feature – only a weak layer was predicted (Fig. 16f) – whereas a strong layer was computed based on the NCEP analysis data (in the NRT run). This is because in the 2-day forecasts the plume lags about 2–3 h behind the plume in the NRT run, which was sufficient that only a weak CO enhancement in the layer was computed for the time of the descent (∼ 16:00 UTC). Never-theless, the accuracy of the plume arrival time near Munich in this instance – even in the 2-day forecasts, made when the plume was still located over Greenland – indicates that global chemical weather forecasts can be used to predict and allow careful, targeted observations to be made of intercontinental transport phenomena.
In all 5 instances in which a layer with enhanced CO was observed during a profile on this flight, O3 was also
ob-served to be elevated by 5–10 nmol/mol. However, although MATCH-MPIC computed an enhancement in CO each time it was observed, the model only computed a very weak en-hancement in O3(a few nmol/mol) in two of these instances,
and no enhancement the other three times. This is an indi-cation that the model is underestimating the photochemical O3production in such pollution plumes, or that the plumes
are starting off with too little O3in the North American BL.
In contrast, during the brief encounter with the North Amer-ican plume over Belgium during the flight on 27 November, no corresponding O3 enhancement was observed. Thus, it
is unknown whether these O3 enhancements are normal or
an exception during the first flight. However, the potential implications of this are significant: MATCH-MPIC and pos-sibly other similar models may be underestimating the con-tribution of North American pollution to the O3burden in the
free troposphere over Europe in winter. This issue is being examined in more detail by Huntrieser et al. (manuscript in preparation).
Very strong North American plumes crossing over Stock-holm such as the one observed on 19 November are rela-tively rare. Using the same criterion as defined before to determine the presence of a strong plume in the column (with COt = 25 nmol/mol), only one other such plume was observed during the period of October–December 2001 (Fig. 17a). Weaker plumes (with COt =20 nmol/mol) were more frequent, occurring about 11% of the time (see Ta-ble 4). Pollution lofted directly from western European sur-face sources also contributes significantly to the variability at this altitude, as depicted by the western European CO tracer in the figure. Further to the south strong North American plume events were more common, though still < 20% of the time, even for COt = 20 nmol/mol. At these low frequen-cies it would have been difficult to plan flights which could successfully intersect these plumes without the availability of global chemical weather forecasts.
Observations MATCH-MPIC NRT MATCH-MPIC Fcst 60 70 80 90 0 50 100 150 200 CO (nmol/mol)
Day of the Year, 1999 Observations MATCH-MPIC NRT MATCH-MPIC Fcst 60 70 80 90 0 20 40 60 O3 (nmol/mol)
Day of the Year, 1999
a)
c)
b)
Fig. 19. Comparison of the mixing ratios of (a) O3 and (b) CO
observed during the INDOEX R/V Ronald H. Brown cruise versus the values computed by MATCH-MPIC (near real time run and 2-day forecasts). The chemical ITCZ encounters were on Julian 2-day 58 (27 February) and day 78 (19 March). Panel (c) shows the cruise route.
3.5 The “chemical ITCZ” during INDOEX
During INDOEX it was found that O3and CO have a strong
north-south gradient, with very high mixing ratios near the Indian coast (Lal and Lawrence, 2001), being 4–5 times as high as in the pristine southern hemisphere; the sharp tran-sition between these two regimes occurs at the “chemical
ITCZ”. During three separate encounters with the ITCZ (see Fig. 18), MATCH-MPIC was able to predict its variable lo-cation (despite the relatively short spin-up time which was possible before INDOEX) and the sharp gradient in trace gas mixing ratios to its north and south.
The chemical ITCZ was encountered twice by the research vessel Ronald H. Brown, once at 2◦S (27 February) and once at 11◦S (19 March). In both cases the model reproduced the abrupt changes in CO and O3well (Fig. 19), and
over-all the correlation coefficients between the model output and the observations on the Ron Brown were high: 0.91 (O3) and
0.86 (CO) for the NRT run, and 0.90 (O3) and 0.85 (CO)
for the 2-day forecasts. The second encounter with the Ron Brown was an important application of the MATCH-MPIC forecasts; the ITCZ was barely reached at the farthest ex-tent of a southbound leg, after the chemical weather fore-casts alerted the ship crew to the need to travel farther south than originally anticipated, since based on the meteorolog-ical forecasts it was expected that the ITCZ would be at about ∼ 6◦S. The difference between this and the location predicted by MATCH-MPIC (about 10–12◦S, Fig 18c) may have to do with the nature of the ITCZ here, which slants to the north at higher altitudes (D. R. Sikka, personal com-munication, 1999). The chemical ITCZ location, based on the surface level CO distribution, could thus be a valuable parameter on which to base future campaign planning deci-sions for trace gas observations in this region.
During INDOEX, the ITCZ was difficult to reach with the Mal´e-based Cessna Citation due to its flight range (∼1000 km one way), since during much of the campaign the ITCZ was located around 10◦S at the longitude of Mal´e (73◦E). The MATCH-MPIC trace gas forecasts were used to predict when the chemical ITCZ would be far enough north for the Citation to reach it, resulting in a multi-leg flight (Flight 11, 4 March 1999) which was successful in sam-pling southern hemispheric air; very low mixing ratios of O3
(∼10 nmol/mol) and CO (∼50 nmol/mol) were observed and modeled near the surface in the southernmost profiles. A de-tailed analysis of the flight is given by Williams et al. (2002).
4 Conclusions
Chemical weather forecasts made with MATCH-MPIC have been found to be useful in planning flights targeting differ-ent types of synoptic scale phenomena, such as near-surface outflow from nearby polluted regions, intercontinental pol-lution plumes in the MT and UT, and the separation of the chemical northern and southern hemispheres at the ITCZ. The most valuable gas used during MINOS, CONTRACE, and INDOEX was CO, along with regional CO tracers, due to their relatively well-defined anthropogenic source regions and lifetimes of one to a few months. The modeled CO val-ues were in good agreement with the observations made on nearly all of the flights which were based on the forecasts,
with r > 0.7 and RMS differences (for departures from the respective means) generally within 10–20% of the observed mean mixing ratios. There is only a slight degradation in the correlations and RMS differences for the 2-day forecasts compared to the NRT run. This ability to reproduce spatial and temporal variations is critical for flight planning. Fur-thermore, the modeled mean CO levels were within 25–30% of the observed means, which is within the range of uncer-tainty in current emissions inventories for emissions from re-gions such as Asia (e.g. Kasibhatla et al., 2002). Note that due to the high correlations, it seems likely that much of the offsets during INDOEX and CONTRACE can be explained with errors in the emissions datasets, since trace gas concen-trations are linear with respect to the production, and errors in the emissions would not be expected to strongly affect the correlations. Errors in the loss or transport terms, on the other hand, will have nonlinear effects on the concentrations, and thus will tend to deteriorate correlations. However, it cannot be ruled out that other model deficiencies contribute, such as errors in the transport (e.g. convection) or loss rates (e.g. OH). The main limitation found was in terms of small-scale features, which can be better represented with regional mod-els. Based on this assessment, we recommend that global and regional (or, where possible, coupled) chemical weather forecasts generally be included as a central component in the daily flight planning of atmospheric chemistry field cam-paigns.
A major advantage of global (versus regional) chemical weather forecasts is the ability to predict intercontinental transport. A detailed analysis was given of the forecasts and observations of pollution transport from Asia and North America over Europe. Both the Asian monsoon plume and the North American outflow are recurrent features influenc-ing the chemical composition of the MT and UT over Eu-rope. However, the outflow events are intermittent, with the pollution plumes arriving at different geographical locations and altitudes. The Asian monsoon plume was normally lim-ited to being strong only in the eastern Mediterranean, but its altitude varied from covering much of the region above 400 hPa, to being confined to only around 150 hPa. Dur-ing the 3-month period around MINOS, a strong plume was present above Crete about 25% of the time; the only good op-portunity to observe the plume was during the first week of MINOS, when three flights were conducted which encoun-tered the anticipated polluted airmasses. The North Ameri-can plume during CONTRACE was much more intermittent, with strong plumes being present only a small fraction of the time. The North American outflow is generally confined to the MT (between ∼500–800 hPa), and is much more com-mon over west-central Europe (Belgium and Germany) than over Scandinavia. In both campaigns, the chemical weather forecasts were crucial to enabling the plumes to be observed. It is important to note that synoptic scale CO distributions can be forecasted accurately (see Table 3) without assimila-tion of CO observaassimila-tions. This is in contrast to