HAL Id: hal-00302746
https://hal.archives-ouvertes.fr/hal-00302746
Submitted on 27 Apr 2007HAL is a multi-disciplinary open access
archive for the deposit and dissemination of sci-entific research documents, whether they are pub-lished or not. The documents may come from teaching and research institutions in France or abroad, or from public or private research centers.
L’archive ouverte pluridisciplinaire HAL, est destinée au dépôt et à la diffusion de documents scientifiques de niveau recherche, publiés ou non, émanant des établissements d’enseignement et de recherche français ou étrangers, des laboratoires publics ou privés.
Ambient aerosol concentrations of sugars and
sugar-alcohols at four different sites in Norway
K. E. Yttri, C. Dye, G. Kiss
To cite this version:
K. E. Yttri, C. Dye, G. Kiss. Ambient aerosol concentrations of sugars and sugar-alcohols at four different sites in Norway. Atmospheric Chemistry and Physics Discussions, European Geosciences Union, 2007, 7 (2), pp.5769-5803. �hal-00302746�
ACPD
7, 5769–5803, 2007 Sugars and sugar-alcohols in ambient aerosols in Norway K. E. Yttri et al. Title Page Abstract Introduction Conclusions References Tables Figures ◭ ◮ ◭ ◮ Back CloseFull Screen / Esc
Printer-friendly Version Interactive Discussion Atmos. Chem. Phys. Discuss., 7, 5769–5803, 2007
www.atmos-chem-phys-discuss.net/7/5769/2007/ © Author(s) 2007. This work is licensed
under a Creative Commons License.
Atmospheric Chemistry and Physics Discussions
Ambient aerosol concentrations of sugars
and sugar-alcohols at four different sites
in Norway
K. E. Yttri1, C. Dye1, and G. Kiss2
1
Norwegian Institute for Air Research, P.O. Box 100, 2027 Kjeller, Norway
2
Air Chemistry Group of the Hungarian Academy of Sciences, University of Veszpr ´em, P.O. Box 158, 8201 Veszpr ´em, Hungary
Received: 29 March 2007 – Accepted: 11 April 2007 – Published: 27 April 2007 Correspondence to: K. E. Yttri ([email protected])
ACPD
7, 5769–5803, 2007 Sugars and sugar-alcohols in ambient aerosols in Norway K. E. Yttri et al. Title Page Abstract Introduction Conclusions References Tables Figures ◭ ◮ ◭ ◮ Back CloseFull Screen / Esc
Printer-friendly Version Interactive Discussion
Abstract
Sugars and sugar-alcohols are demonstrated to be important constituents of the am-bient aerosol water-soluble organic carbon fraction (WSOC), and to be tracers for primary biological aerosol particles (PBAP). In the present study, levels of four sug-ars (fructose, glucose, sucrose, trehalose) and three sugar-alcohols (arabitol, inositol, 5
mannitol) in ambient aerosols have been quantified using a novel HPLC/HRMS-TOF (High Performance Liquid Chromatography in combination with High Resolution Mass Spectrometry – Time of Flight) method to assess the contribution of PBAP to PM10and PM2.5. Samples were collected at four sites in Norway at different times of the year in order to reflect the various contributing sources and the spatial and seasonal variation 10
of the selected compounds.
Sugars and sugar-alcohols were present at all sites investigated, underlining the ubiquity of these highly polar organic compounds. The highest concentrations were reported for sucrose, reaching a maximum concentration of 320 ng m−3 in PM
10 and 55 ng m−3 in PM
2.5. The mean concentration of sucrose was up to 10 times higher 15
than fructose, glucose and trehalose. The mean concentrations of the sugar-alcohols were typically lower, or equal, to that of the monomeric sugars and trehalose. Peak concentrations of arabitol and mannitol did not exceed 30 ng m−3 in PM
10, and for PM2.5all concentrations were below 6 ng m−3.
Sugars and sugar-alcohols were associated primarily with coarse aerosols except 20
during wintertime at the suburban site in Elverum, where a shift towards sub micron aerosols was observed. It is proposed that this shift was due to the intensive use of wood burning for residential heating at this site during winter, confirmed by high concurrent concentrations of levoglucosan. Elevated concentrations of sugars in PM2.5 were observed during spring and early summer at the rural background site Birkenes. 25
It is hypothesized that this was due to ruptured pollen.
ACPD
7, 5769–5803, 2007 Sugars and sugar-alcohols in ambient aerosols in Norway K. E. Yttri et al. Title Page Abstract Introduction Conclusions References Tables Figures ◭ ◮ ◭ ◮ Back CloseFull Screen / Esc
Printer-friendly Version Interactive Discussion
1 Introduction
The organic carbon (OC) fraction of ambient aerosols is commonly fractioned accord-ing to its solubility in water. The water-soluble organic carbon fraction (WSOC) may account for 11–95 % of the OC content in ambient aerosols (Mader et al., 2004). The WSOC fraction has been the issue of several scientific studies during the last years due 5
to its important, but still not well-defined, contribution to CCN-activity (cloud conden-sation nuclei) of ambient aerosols (Novakov and Penner, 1993; Facchini et al., 1999; Graham et al., 2002; Falcovich et al., 2005; Decesari et al., 2006). However, it also needs to be studied more closely for potential negative health effects (Kamens et al., 1985; Taylor et al., 2002; Tesfaigzi et al., 2002). In addition, an increased knowledge 10
on the molecular level will benefit source attribution and improve the mass balance. The presence of dicarboxylic acids in ambient aerosols have been reported in several studies and for a number of different sites, ranging from background areas (Kleefeld et al., 2002) to urban areas (Kerminen, et al., 2000; Kawamura and Yasui, 2005). Recent studies on particulate matter emitted from biomass burning, have revealed 15
the presence of a large number of highly oxygenated compounds, with polyfunctional groups, which are lignin, cellulose, and hemicellulose breakdown products (Nolte et al., 2001; Schauer et al., 2001; Fine et al., 2002; Simoneit, 2002). The presence of these compounds in ambient aerosols support the suggestions put forward by Sax-enea and Hildemann (1996) in their theoretical approach to determine which groups 20
of compounds are contributing to the WSOC fraction of ambient aerosols. A number of studies have demonstrated the presence of water-soluble humic-like substances in atmospheric aerosols (Havers et al., 1998; Kriv ´acsy et al., 2001; Mayol-Bracero et al., 2002). This refractory polymeric material has features that resemble the chemical properties of humic and fulvic acids found in soil and fresh waters, and are reported to 25
account for a substantial part of the WSOC fraction (Zappoli et al., 1999; Mayol-Bracero et al., 2002; Graber and Rudich, 2006).
Based on a solid phase extraction approach (using Oasis HLB columns), Varga et
ACPD
7, 5769–5803, 2007 Sugars and sugar-alcohols in ambient aerosols in Norway K. E. Yttri et al. Title Page Abstract Introduction Conclusions References Tables Figures ◭ ◮ ◭ ◮ Back CloseFull Screen / Esc
Printer-friendly Version Interactive Discussion al. (2001) isolated approximately 60% of the WSOC fraction at a rural site. Most of
this isolated organic matter was found to be humic-like substances. According to Kiss et al. (2002), the non-isolated fraction contains even more polar compounds with no fluorescence and absorbing UV light significantly below 240 nm. These findings indi-cate the lack of polyconjugated structure and UV-absorbing functional groups, such 5
as carbonyl and nitro groups, and supports the presence of polyhydroxy compounds and hydroxy acids. Carbohydrates, which are polyhydroxy compounds, have been the focus in only a few recent studies (e.g. Graham et al., 2002; Pashynska et al., 2002; Carvalho et al., 2003; Graham et al., 2003; Graham et al., 2004; Simoneit et al., 2004; Elbert et al., 2006). Further, it is commonly accepted that there are a significant number 10
of particulate compounds still not identified, and that both biogenic and anthropogenic sources contribute to this pool, either by direct emission or after chemical conversion in the atmosphere. The recent finding and characterization of methylthreitol and 2-methylerythritol (Clayes et al., 2004), which are hypothesized to be oxidation products of isoprene, supports this.
15
As the WSOC fraction can account for a significant part of ambient aerosols, it is important that its sources are thoroughly investigated. In a recent work on primary biological aerosol particles (PBAP), Graham et al. (2003) makes a thorough study in resolving the potential sources of both sugars and sugar-alcohols in ambient aerosols in the Amazon region. They found that sugar-alcohols peak during the night, whereas 20
sugars peak during daytime. These findings were well correlated with increased con-centrations of yeasts and other fungal spores present during night, and the specific daytime release of pollen, fern spores and other “giant” bioaerosols. Both sugars and sugar-alcohols were found to be predominantly in the coarse mode. Based on their conclusions, sugars and sugar-alcohols should be good tracers for different types of 25
PBAP, and recently Elbert et al. (2006) estimated a global average emission rate of ac-tively discharged basidiospores (17 Tg year−1) on the basis of the sugar-alcohol man-nitol. However, it may not be feasible to extrapolate results from the tropical Amazon region to the sub-Arctic Scandinavia. The study of Pashynska et al. (2002) indicates
ACPD
7, 5769–5803, 2007 Sugars and sugar-alcohols in ambient aerosols in Norway K. E. Yttri et al. Title Page Abstract Introduction Conclusions References Tables Figures ◭ ◮ ◭ ◮ Back CloseFull Screen / Esc
Printer-friendly Version Interactive Discussion that the same sources may be active in the temperate climate of Europe, based on
levels of sugars and sugar-alcohols in Ghent (Belgium). They linked arabitol and man-nitol to vegetation and mature leaves in addition to fungi and algae, whereas glucose, fructose, inositol and sucrose were suggested to come from developing leaves, sup-porting the temporal variation of the relative contribution of sugars and sugar-alcohols 5
to OC seen during their sampling campaign. The study of Pashynska et al. (2002) is so far the only study addressing the contribution of PBAP in an urban environment by investigating temporal variations of sugar and sugar-alcohols. Significantly higher concentrations of sugars and sugar-alcohols were reported for summer than winter in their study.
10
The purpose of the present study was to quantify the ambient aerosol concentration of sugars and sugar-alcohols in PM10 and PM2.5 in various environments, in order to address the influence of PBAP, their seasonal and spatial variation, and sources. In the few studies reported on sugar and sugar-alcohols in ambient aerosols, derivatization and subsequent GC/MS-analysis for quantification has been the method of choice, 15
although with a few exceptions (e.g. Schkolnik et al., 2005). In the present study, levels of sugars and sugar-alcohols in 96 ambient aerosol samples have been quantified using a novel HPLC/HRMS-TOF approach where no derivatization is needed prior to the analysis.
2 Experimental
20
2.1 Site description and measurement period
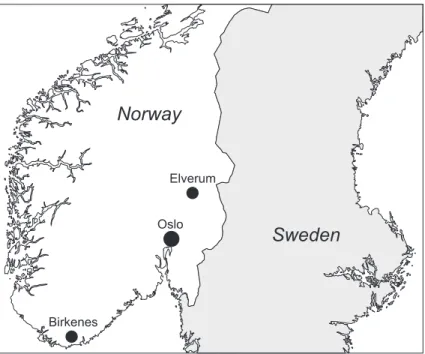
Aerosol samples were collected at four sites in Norway (Fig. 1): at a curbside site (Hels-fyr) and an urban background site (the Sofienberg Park) in Oslo (59◦56′N, 10◦44′E), at a suburban site in Elverum (60◦53′N, 11◦34′E), and at a rural background site (Birkenes) (58◦23′N, 8◦15′E). The curbside site is located next to one of the most 25
heavily trafficked roads in Oslo (50 000 vehicles pr. 24 h). Sampling was performed 5773
ACPD
7, 5769–5803, 2007 Sugars and sugar-alcohols in ambient aerosols in Norway K. E. Yttri et al. Title Page Abstract Introduction Conclusions References Tables Figures ◭ ◮ ◭ ◮ Back CloseFull Screen / Esc
Printer-friendly Version Interactive Discussion from 9 September to 3 October 2002. The urban background site is situated in the
central parts of Oslo. The site is influenced by various emission sources of particulate matter typically present in an urban environment, including emissions from residential wood burning during winter (Yttri et al., 2005). The sampling was performed from 21 November to 14 December in 2001. The suburban site in Elverum is located on the 5
outskirts of a residential area and sampling was conducted both for a winter period (30 January to 15 March 2002) and a summer period (22 May to 28 June 2002). This site is heavily influenced by residential wood burning during winter (Yttri et al., 2005). The ru-ral background site, Birkenes, is located approximately 20 km from the Skagerak coast in the southern part of Norway, and has been part of NILU’s nation-wide sampling net 10
since 1973, and part of the EMEP-program since 1977. The site is frequently influ-enced by episodes of transboundary air pollution from continental Europe. Sampling was conducted throughout the entire year of 2002.
2.2 Aerosol sampling
2.2.1 Aerosol sampling for determination of sugars, sugar-alcohols, OC and WSOC 15
Ambient aerosols were collected on prefired (850◦C, 3.5 h) quartz fibre filters (What-man, QM-A, 47 mm). Tandem filter set-ups (McDow and Huntzicker, 1990) were ap-plied at all sites, except Birkenes, to correct for the positive artefact introduced by OC during sampling. The QBT approach (quartz fibre filter behind Teflon filter) was applied for both PM10 and PM2.5, except at the urban background site where the QBQ (quartz 20
fibre filter behind quartz fibre filter) approach was applied for PM10. All quartz fibre filters were from the same batch number in order to minimize differences in adsorptive capacity (Kirchstetter et al., 2001). A difference in adsorptive capacity might lead to an erroneous estimate of the particulate OC when using a tandem filter set up. After sampling, the filters were transported back to the laboratory in a mobile freezer (–5◦C), 25
and stored in sealed Petri dishes at –18◦C to prevent post-collection evaporation. Three different samplers were used to collect PM10. At the curbside and urban
ACPD
7, 5769–5803, 2007 Sugars and sugar-alcohols in ambient aerosols in Norway K. E. Yttri et al. Title Page Abstract Introduction Conclusions References Tables Figures ◭ ◮ ◭ ◮ Back CloseFull Screen / Esc
Printer-friendly Version Interactive Discussion background site, and during the winter campaign at the suburban site, a NILU filter
unit with a NILU PM10 pre-impactor inlet was used. For the summer campaign at the suburban site, a NILU filter unit with a Gent PM10 inlet was used. At the rural background site, a low volume sampler from Derenda was used.
Two different samplers were used to collect PM2.5. At the curbside site, the subur-5
ban site (summer campaign) and the rural background site, low volume samplers from Derenda were used, whereas a NILU stacked-filter unit (SFU) with a NILU PM10 pre-impactor inlet was used at the urban background site and at the suburban site during the winter campaign. At a flow rate of 10 l min−1, the NILU-SFU acts as a dichotomous sampler, as the flow through the initial filter (8 µm pore, 47 mm Nucleopore) will result 10
in the collection of particles with an equivalent aerodynamic diameter of ∼2.5 µm on the second filter (2 µm pore, 47 mm Zefluor Teflon, Gelman P5PJ047) (Hopke et al., 1997). Sampling was performed on weekdays only (23 h), except at the rural back-ground site where samples were collected over a period of six days (144 h) each week. The aerosol samplers used at the various sites are listed in Table 1.
15
2.2.2 Size distribution measurements of sugars and sugar-alcohols
At the suburban site, size segregated samples of ambient aerosols were obtained using a Berner low-pressure impactor collecting aerosols on prefired (850◦C, 3.5 h) quartz fibre filters (d =70 mm, cut from 8” x 10” Whatman QM-A). The 50% cut-off diameters of the eight impaction stages were respectively 16 µm, 8.0 µm, 4.0 µm, 2.0 µm, 1.0 µm, 20
0.5 µm, 0.250 µm, 0.125 µm and 0.060 µm at a nominal flow rate of 28 l min−1. The sampling time was 47 h.
It should be noted that obtaining size distributions of sugars and sugar-alcohols us-ing quartz fibre filters may have some drawbacks, as they are somewhat thicker than polycarbonate, reducing the jet to plate distance. Along with the rough surface of the 25
quartz fiber filters, this may influence the 50% cut-off size of the impactor stages, lead-ing to a shift towards higher particle diameters.
ACPD
7, 5769–5803, 2007 Sugars and sugar-alcohols in ambient aerosols in Norway K. E. Yttri et al. Title Page Abstract Introduction Conclusions References Tables Figures ◭ ◮ ◭ ◮ Back CloseFull Screen / Esc
Printer-friendly Version Interactive Discussion 2.3 Thermal-optical transmission analysis
OC and WSOC were quantified using the thermal-optical transmittance (TOT) instru-ment from Sunset laboratories Inc., which discriminates between eleinstru-mental carbon (EC) and OC and that corrects for charring during analysis. The WSOC fraction was quantified according to Eq. (1) after extracting the filter with Milli-Q water (100 ml). 5
WSOC=OC−WINSOC (1)
In the first mode of the temperature program applied for analysis, the temperature is raised in four steps terminating at 850◦C (Step 1: 220◦C for 60 s, step 2: 360◦C for 60 s., step 3: 525◦C for 60 s and step 4: 850◦C for 90 s). During the second mode, the temperature is lowered to 550◦C before it is raised to 890◦C in seven steps (Step 1: 10
550◦C for 30 s, step 2: 650◦C for 30 s, step 3: 720◦C for 30 s, step 4: 790◦C for 40 s, step 5: 820◦C for 30 s, step 6: 860◦C for 20 s and step 7: 890◦C for 40 s).
2.4 Sample preparation and HPLC/HRMS-TOF analysis of sugars, sugar-alcohols, and monosaccharide anhydrides
Prior to HPLC/HRMS-TOF analysis, punches (1.5–4.0 cm2) of each filter were soaked 15
in Milli-Q water (1.5 ml) and subjected to ultrasonic agitation (30 min). For the Berner impactor samples, half of each impaction plate was subjected to analysis and the ex-traction volume was increased to 3 ml. Each filter was extracted twice. The extracted volumes were pooled, filtered through a syringe filter (0.45 µm) to remove particulates and filter debris, and evaporated to dryness under an N2 atmosphere. The dry ex-20
tract was redissolved in Milli-Q water (100 µl) and isopropanol (300 µ l) and transferred into an injection vial. Internal standard (13C-glucose solution, 10 µl, c=30 mg l−1) was added to the filter punches before the sample preparation.
The sum of the D and L and α and β isomers of the sugars fructose (C6H12O6), glu-cose (C6H12O6), ribose (C5H10O5), sucrose (C12H22O11), and trehalose (C12H22O11), 25
and the sugar-alcohols arabitol (C5H12O5), erythritol (C4H10O4), inositol (C6H12O6) 5776
ACPD
7, 5769–5803, 2007 Sugars and sugar-alcohols in ambient aerosols in Norway K. E. Yttri et al. Title Page Abstract Introduction Conclusions References Tables Figures ◭ ◮ ◭ ◮ Back CloseFull Screen / Esc
Printer-friendly Version Interactive Discussion and mannitol (C6H14O6) were determined using HPLC (Agilent model 1100) combined
with HRMS-TOF (Micromass model LCT) operated in the negative electrospray mode. The compounds were identified by comparison of retention time obtained by separa-tion on an amino column (Asahipak NH2-2D, 2.0 mm id × 150 mm) with outstanding separation performance of sugars and sugar-alcohols. In addition, the mass spectra 5
obtained with authentic standards were compared with real sample analytes. The limit of quantification (LOQ) at a signal to noise ratio of ten is approximately 30 pg for the individual sugars and sugar-alcohols. To improve the detection limit, CHCl3was added post column by a T-piece in order to generate gaseous chlorine in the ion source. This procedure generates adducts between the target compounds and chlorine [M+Cl]− 10
with a superior ionisation repeatability; e.g. sucrose was monitored by the ion m/z 377, and m/z 379 was used as a qualifier. The procedure was used for the samples and the authentic standards as an integrated part of the HPLC/HRMS-TOF quantification method. The target compounds were quantified by the internal standard method. The procedure of the analytical method will be described in a forthcoming paper.
15
Sample preparation and HPLC/HRMS-TOF analysis of monosaccharide anhydrides were performed according to Dye and Yttri (2005). The methodology holds the com-bined merits of short preparation, high sensitivity and complete separation of levoglu-cosan from its isomeric compounds, as evaluated by Schkolnik and Rudich, (2006). The methodology has successfully been applied on filter samples containing levoglu-20
cosan concentrations ranging from background (Stohl et al., 2007) to urban (Yttri et al., 2005) levels, and adds to the growing number of publications (e.g. Scholknik et al., 2005) using methodology complementary to GC/MS for quantification of monosaccha-ride anhydmonosaccha-rides.
ACPD
7, 5769–5803, 2007 Sugars and sugar-alcohols in ambient aerosols in Norway K. E. Yttri et al. Title Page Abstract Introduction Conclusions References Tables Figures ◭ ◮ ◭ ◮ Back CloseFull Screen / Esc
Printer-friendly Version Interactive Discussion
3 Results and discussion
3.1 Concentrations of sugars and sugar-alcohols in ambient aerosols
Using a novel HPLC/HRMS-TOF method, five sugars (fructose, glucose, ribose, su-crose and trehalose) and four sugar-alcohols (arabitol, erythritol, inositol and mannitol) were quantified in 96 aerosol filter samples. Their concentrations in PM10 and PM2.5 5
are reported in Table 2 and Table 3, respectively, except ribose and erythritol, which occurred only randomly and at very low concentrations.
The presence of sugars and sugar-alcohols in ambient aerosols were demonstrated at all sites investigated, underlining the ubiquity of these highly polar organic com-pounds. Sucrose was the most abundant sugar in both PM10 and PM2.5, except at 10
the rural background site, reaching a maximum concentration of 320 ng m−3 in PM 10 and 55 ng m−3 in PM
2.5. The mean concentrations of sucrose were up to 10 times higher than that of fructose, glucose and trehalose, exceeding 100 ng m−3 in PM
10 at the urban background site, and at the suburban site during the summer campaign. The mean concentrations of the sugar-alcohols were typically lower or equal to that of the 15
monomeric sugars and trehalose. Maximum concentrations of sugar-alcohols did not exceed 30 ng m−3in PM
10, and for PM2.5 all concentrations were below 6 ng m−3. Although combustion of cellulose and hemi-cellulose, which are the major con-stituents of wood, primarily favours monosaccharide anhydride formation (Sanders et al., 2002), monomeric and dimeric sugars are emitted as well (Nolte et al., 2001). 20
Thus, concurrent measurement of monosaccharide anhydrides is important to sort out non-PBAP sources of fine sugars. For the sites investigated, levels of monosaccha-ride anhydmonosaccha-rides varied considerably, ranging from below detection limit to 1240 ng m−3 (Table 4). Levoglucosan was the most abundant of the MAs, typically accounting for 75–80 %.
25
It should be noted that the different sampling time used at the rural site (144 h) com-pared to the other sites (23 h), could bias the results. This could be important when
ACPD
7, 5769–5803, 2007 Sugars and sugar-alcohols in ambient aerosols in Norway K. E. Yttri et al. Title Page Abstract Introduction Conclusions References Tables Figures ◭ ◮ ◭ ◮ Back CloseFull Screen / Esc
Printer-friendly Version Interactive Discussion the source contribution is episodic in nature, and if the duration of the emissions is
short compared to the sampling times applied. Furthermore, oxidation and subse-quent alteration of the compounds trapped on the filter are likely to be increased during prolonged sampling, underestimating the true ambient concentration. However, stud-ies have shown that certain sugars, such as monosaccharide anhydrides, are resistant 5
towards degradation in the atmosphere over a period of at least 10 days (Fraser and Lakshmanan, 2000).
Concentrations of sugars and sugar-alcohols in urban influenced areas have previ-ously been reported for PM10in Ghent (Belgium) (Pashynska et al., 2002), and for PM3 in San Joaquin Valley (USA) (Nolte et al., 2001). For Ghent, both summer and win-10
tertime concentrations are higher than those reported for the urban-influenced sites in the present study (Table 2), with the exception of sucrose, whereas the wintertime con-centrations reported by Nolte et al. (2001) are within the same range. Levels of sugars and sugar-alcohols have been reported only for a few European rural background sites, Hyyti ¨al ¨a (Finland) (Carvalho et al., 2003; Kourtchev et al., 2005), Melpitz (Germany) 15
(Carvalho et al., 2003), and K-puszta (Ion et al., 2005), and the measurements are mainly based on sampling campaigns conducted during summer. In general, the con-centrations reported in these studies are comparable to those reported in the present study, with the exception of the rural background site Birkenes, where the levels of sug-ars and sugar-alcohols in PM2.5are considerably lower. Pashynska et al. (2002), Nolte 20
et al. (2001), Carvalho et al. (2003), Kourtchev et al. (2005), and Ion et al. (2005), all reported concurrent measurements of levoglucosan along with the sugars and sugar-alcohols, indicating that combustion of wood could be a source of fine sugars in these studies.
3.2 Sources and size distributions of sugars and sugar-alcohols 25
The results presented in Table 5 show that sugars and sugar-alcohols were associ-ated mainly with coarse aerosols. This is in accordance with results reported from the Amazon region on the natural background aerosol (Graham et al., 2003).
ACPD
7, 5769–5803, 2007 Sugars and sugar-alcohols in ambient aerosols in Norway K. E. Yttri et al. Title Page Abstract Introduction Conclusions References Tables Figures ◭ ◮ ◭ ◮ Back CloseFull Screen / Esc
Printer-friendly Version Interactive Discussion Only 5–10% of the sugars and sugar-alcohols could be attributed to PM2.5 at the
curbside site, when not accounting for inositol. We suggest that resuspension of PBAP promoted by turbulence from vehicular traffic could be a dominating source at this highly trafficked site, explaining why most PBAP was found in the coarse fraction. The mean concentration of levoglucosan at the curbside site was 45 ng m−3, which indi-5
cates that part of the fine aerosol content of sugars could be attributed to wood burn-ing. 66–92% of the sugars and the sugar-alcohols were associated with PM2.5 at the suburban site during the winter campaign, whereas the corresponding range for the summer campaign was 10–31%. This suggests that different sources of sugars and sugar-alcohols prevail at various seasons. The high mean concentration of levoglu-10
cosan (605 ng m−3) (Table 4) in the samples collected during winter, strongly suggest that residential wood burning is the source of fine sugars, and possibly sugar-alcohols, and not PBAP. The mean concentration of levoglucosan during the summer campaign was only 47 ng m−3. The size distributions obtained for sugars and sugar-alcohols at the suburban site, confirm the shift towards smaller particle sizes during winter re-15
ported in Table 5. This is exemplified by the size distributions of arabitol (Figs. 2c and 2d) and glucose (Figs. 2e and 2f), which show that the majority of the sugars and the sugar-alcohols were associated with aerosols in the size range 0.250–1.0 µm during winter, and with aerosols larger than 2 µm in summer. We have not found lit-erature positively confirming the presence of sugar-alcohols in wood smoke, although 20
Simoneit et al. (2004) suggested that they might be emitted by thermal stripping during wildfires. Whereas Medeiros et al. (2006) only reported elevated concentrations of cer-tain monomeric sugars during wildfires, and not for disaccharides and sugar-alcohols, Medeiros and Simoneit (2007) found mannitol to be present in aerosols sampled from air masses influenced by wild fire emissions. It could also be that the high PM2.5/PM10 25
ratio for sugars and sugar-alcohols could be attributed to snow on the ground, which effectively reduces resuspension of decaying biogenic material from the ground, con-tributing to the coarse fraction.
Although sugars and sugar-alcohols were more abundant in fine aerosols during win-5780
ACPD
7, 5769–5803, 2007 Sugars and sugar-alcohols in ambient aerosols in Norway K. E. Yttri et al. Title Page Abstract Introduction Conclusions References Tables Figures ◭ ◮ ◭ ◮ Back CloseFull Screen / Esc
Printer-friendly Version Interactive Discussion ter, they still made a contribution in summer. This was more profound for the sugars
than for the sugar-alcohols. For the sugars fructose, glucose (Fig. 2e), and sucrose (Fig. 2g), a three-modal size distribution was observed, with two of the modes peaking in the fine mode. The peak height of the modes was found to increase with increas-ing particle size. The low levels of levoglucosan observed in summer compared to 5
winter suggest other sources of sugars and sugar-alcohols in fine aerosols than wood burning, such as viruses, bacteria, algae, spores of lichens, ferns, and fungi (Matthias-Maser, 1998). Here we suggest that fragmented pollen grains, which are known to contain fructose, glucose and sucrose, either in cytoplasmatic vesicles or dissolved in the cytosol (Pacini, 2000), could be a likely source of sugars in the fine aerosol. Taylor 10
et al. (2002) showed that most of the pollen of grass actually remained in the anthers after they had opened, and that following a cycle of wetting and drying, causing the pollen to rupture, followed by wind shedding, respirable aerosols of pollen cytoplasm in the size range 120 nm to 4.67 µm were observed. In a recent study (Taylor et al., 2004), similar results were reported for birch, generating aerosols of pollen cytoplasm in the 15
size range 30 nm to 4 µm. Taylor and co-workers (2002) suggested that similar mech-anisms exist for other wind-pollinated trees, weeds and moulds, which indicates that this might be an important source of sugars in fine aerosols. A three modal size dis-tribution have previously been reported for glucose and sucrose for the anthropogenic influenced agricultural site Melpitz (Germany) during spring (Carvalho et al., 2003). In 20
contrast to the finding in the present study, the size distributions of glucose and sucrose at Melpitz were totally dominated by the finest mode, ranging from 0.05–0.390 µm. Re-cently, Simoneit et al. (2004) suggested that mono and disaccharides are tracers of soil material and associated microbiota. It can therefore be speculated that agricultural activity, such as ploughing, in nearby areas could be a plausible source as well. 25
The size distribution of trehalose resembles more closely that of arabitol and man-nitol than the other sugars, indicating that it originates from fungal spores (Lewis and Smith, 1967). The common features of the size distributions of these three compounds is a dominant coarse mode, a nearly unimodal size distribution, which peaks within
ACPD
7, 5769–5803, 2007 Sugars and sugar-alcohols in ambient aerosols in Norway K. E. Yttri et al. Title Page Abstract Introduction Conclusions References Tables Figures ◭ ◮ ◭ ◮ Back CloseFull Screen / Esc
Printer-friendly Version Interactive Discussion the 2–4 µm size fraction, and an abrupt decrease in the concentration below 2 µm
(Figs. 2a, b and c). In the study by Bauer et al. (2002), the smallest fungal spores registered had a diameter of 2.0 µm, underlining their presence in the coarse mode. A somewhat higher concentration of trehalose is observed for the fine mode com-pared to arabitol and mannitol, indicating some relationship with the other sugars. The 5
size distribution and the concentration of trehalose, arabitol and mannitol are in accor-dance with that reported for mannitol in Melpitz (Germany) during spring by Carvalho et al. (2003).
Despite that a rather high mean concentration of levoglucosan (193 ng m−3) (Table 3) was reported for the urban background site, the PM2.5/PM10 ratio for the sugars and 10
sugar-alcohols was rather low, ranging from 8–20%. Unlike the suburban site (winter), there was no snow covering the ground during sampling at the urban background site, thus, any coarse sugars and sugar-alcohols resuspended from the ground might have contributed to the low ratios observed.
Although it has been showed that sugars and sugar-alcohols are tracers of PBAP, 15
caution should be made when using such highly water-soluble organic compounds as tracers. The great diversity of PBAP, and their various level of decay, could make conversion of sugars and sugar-alcohols into particulate matter uncertain. Fragmented PBAP, which have become depleted of sugars and sugar-alcohols due to rainfall or microorganisms, would not be accounted for by addressing the levels of sugars or 20
sugar-alcohols in aerosol filter samples. Further, studies assessing the solubility of sugars and sugar-alcohols associated with PBAP are needed to address the suitability of these compounds as quantitative tracers of PBAP in various environments.
3.3 Annual variation of sugars and sugar-alcohols at the rural background site
The sum of the annual mean concentration of the four individual sugars (9.9 ng m−3) 25
and the three individual sugar-alcohols (10.8 ng m−3) in PM
10 at the rural background site, do not differ much (Table 2). However, a higher percentage of the sugars are as-sociated with PM2.5(34%) compared to the sugar-alcohols (8.3%). In general, sugars
ACPD
7, 5769–5803, 2007 Sugars and sugar-alcohols in ambient aerosols in Norway K. E. Yttri et al. Title Page Abstract Introduction Conclusions References Tables Figures ◭ ◮ ◭ ◮ Back CloseFull Screen / Esc
Printer-friendly Version Interactive Discussion and sugar-alcohols in PM2.5 contribute relatively more to PM10 during winter, spring
and early summer (Fig. 3a). In winter, this could be attributed to low levels of sugars and sugar-alcohols in the coarse fraction, along with residential wood burning poten-tially being a dominant source of sugars and sugar-alcohols, as seen from elevated concentrations of levoglucosan (Fig. 3a).
5
Peak 1 (medio April) and peak 2 (medio June), shown in Fig. 3a, have a relatively high input from the fine fraction, predominantly from sugars (Fig. 3c); 71% and 82% of the PM10 sugar content in peak 1 and peak 2 could be accounted for by the fine fraction, whereas the corresponding percentages for the sugar-alcohols were only 11% and 12%. Notably, peak 1 and peak 2 (Fig. 3a) coincide with the onset of the birch 10
pollen season and the grass pollen season, respectively, and the sugars contributing to these peaks (fructose, glucose sucrose) are those found in pollen. Pollen from birch and grasses are the two most common types of pollen seen in Norway, and both rely on wind-pollination. Hence, the fine sugar content in Peak 1 and 2 might be attributed to fragmented pollen grains.
15
The highest concentrations of sugars and sugar-alcohols are observed for the pe-riod from June to the beginning of December (Fig. 3a), during which the fine fraction decreases and the coarse fraction increases. This period is characterized by four ma-jor peaks (3–6). The elevated concentrations of arabitol, mannitol, and trehalose, and to some extent glucose, associated with these peaks, indicate that the source could 20
be fungal spores (Lewis and Smith, 1967). Late summer and fall is the time of the year when spores from the Cladosporium sp. fungi are at the highest for this part of Norway. The diameter of these spores ranges from 4 to 20 µm. Matthias-Maser et al. (1998) have previously shown that spores could be the dominating fraction of PBAP, accounting for 40–70% of the total aerosol number with a radius of 2–5 µm in an 25
urban rural-influenced region in December (Mainz, Germany). The maximum concen-trations of arabitol and mannitol during late summer and fall coincide with the findings of Pashynska et al. (2002), which reported an increased relative contribution of arabitol and mannitol during late summer.
ACPD
7, 5769–5803, 2007 Sugars and sugar-alcohols in ambient aerosols in Norway K. E. Yttri et al. Title Page Abstract Introduction Conclusions References Tables Figures ◭ ◮ ◭ ◮ Back CloseFull Screen / Esc
Printer-friendly Version Interactive Discussion The narrow gap between PM10 and PM2.5 seen at the end of the year (Fig. 3a) is
consistent with snow covering the ground, effectively reducing resuspension of coarse PBAP from the ground to a minimum.
3.4 Relative contribution of sugars and sugar-alcohols to OC and WSOC
3.4.1 PM10 5
The mean carbon content of sugars accounted for 0.4–2.2% of OC, whereas the corre-sponding percentage for the sugar-alcohols ranged from <0.1–0.5% (Table 6a). Com-bined, the carbon content of sugars and sugar-alcohols accounted for 0.5–2.7% of OC (Table 6a). Notably, the sugars accounted for a significantly higher concentration of OC at all sites except from the rural site. Correcting for the positive artefact prone to 10
occur during sampling of OC on quartz fibre filters, the relative contribution of sugars and sugar-alcohols was increased, accounting for 0.6–4.1 % of particulate OC (OCP)
(Table 6a). It should be noted that the QBQ approach used at the urban background site provides a consistently lower estimate of the positive artefact of OC compared to the QBT approach used at the other sites. Thus, the relative contribution of sugars 15
and sugar-alcohols to OCP at the urban background site are not directly comparable to those sites applying the QBT approach.
In the study by Pashynska et al. (2002), the carbon content of the same sugars as reported in the present study, except trehalose, was found to account for 5.5% of OC in PM10 during summer and 1.4% during winter.
20
The WSOC concentration was quantified at all but the rural site. The carbon content of the sum of sugars and sugar-alcohols was found to account for 0.6–3.9% of WSOC (Table 6b).
ACPD
7, 5769–5803, 2007 Sugars and sugar-alcohols in ambient aerosols in Norway K. E. Yttri et al. Title Page Abstract Introduction Conclusions References Tables Figures ◭ ◮ ◭ ◮ Back CloseFull Screen / Esc
Printer-friendly Version Interactive Discussion 3.4.2 PM2.5
The relative contribution of sugars and sugar-alcohols to the fine aerosol OC frac-tion was considerably lower than for PM10, as they were primarily associated with coarse aerosols (Table 5). The carbon content of sugars accounted for 0.1–0.6% of OC, whereas the relative contribution of the sugar-alcohols did not exceed 0.1% at any 5
of the sites (Table 7a). Between 0.2% and 0.7% of the OC could be accounted for by the sum of sugars and sugar-alcohols, whereas it ranged from 0.2% to 1.0% when the positive artefact of OC was accounted for (Table 7a). Care should be taken when com-paring the relative contribution of sugars and sugar-alcohols to PM10and PM2.5at the urban background site, as the QBQ-approach has been used to correct for the positive 10
artefact of OC for PM10, and the QBT-approach for PM2.5. There is not much differ-ence between the relative contribution of sugars and sugar-alcohols to OC in PM2.5 and PM10 at the suburban site during winter. This is due to a combination of high concentrations of sugars and sugar-alcohols in the fine fraction (Table 3) and a high PM2.5/PM10ratio for OC. The fine aerosol content of WSOC was only quantified for the 15
urban background site, of which the sum of sugars and sugar-alcohols accounted for 0.5%.
The study of Kiss et al. (2002) indicates that polyhydroxy compounds (e.g. sugars and sugar-alcohols) is present in the WSOC fraction not isolated by the HLB-approach (Varga et al., 2000), typically accounting for 20–40% of the total WSOC fraction. As-20
suming that 30% of WSOC is not isolated by the HLB-approach, 2–12% of the carbon content of this non-isolated fraction could be attributed to the four sugars and three sugar alcohols analysed. Since carbohydrates take up water already at medium or low relative humidity, the relatively high growth factors observed for this fraction in hygro-scopic tandem differential mobility analyser (H-TDMA) experiments (Gysel et al., 2004) 25
could be explained by the presence of sugar and sugar-alcohol compounds. Further-more, by increasing the water uptake of the aerosols, these components may change their light scattering properties, thus influencing the direct aerosol forcing (Ramanathan
ACPD
7, 5769–5803, 2007 Sugars and sugar-alcohols in ambient aerosols in Norway K. E. Yttri et al. Title Page Abstract Introduction Conclusions References Tables Figures ◭ ◮ ◭ ◮ Back CloseFull Screen / Esc
Printer-friendly Version Interactive Discussion et al., 2001).
4 Conclusions
The present study showed that sugar and sugar-alcohols were present in ambient aerosols in a range of various environments. Daily concentrations exceeding 500 ng m−3 were observed for the sum of the four sugars and the three sugar-alcohols quan-5
tified in PM10. The mean relative contribution of the carbon content of the sugars and sugar-alcohols to particulate OC in PM10, ranged from 0.6–4.7% for the sites investi-gated.
The sugars and sugar-alcohols were associated primarily with coarse aerosols, how-ever, a shift towards submicron particle sizes was observed at one of the sites, which 10
was heavily influenced by wood burning. Thus, we propose that wood burning could be an important source of both sugars and sugar-alcohols in fine aerosols.
A seasonal pattern was observed for both sugars and sugar-alcohols at the rural background site Birkenes, both reaching maximum concentrations during summer and fall. On an annual basis, approximately 80% of the sum of sugars and sugar-alcohols 15
resided in the coarse fraction at this site. However, the fine fraction contributed signif-icantly to the concentration of sugars in PM10 during winter, spring and early summer. We argue that ruptured pollen may be a significant source of sugars in the fine aerosol during spring and early summer.
References
20
Bauer, H., Kasper-Giebl, A., L ¨oflund, M., Giebl, H., Hitzenberger, R., Zibuschka, F., and Puxbaum, H.: The contribution of bacteria and fungal spores to the organic carbon content of cloud water, precipitation and aerosols, Atmos. Res., 64, 109–119, 2002.
Carvalho, A., Pio, C., and Santos, C.: Water-soluble hydroxylated organic compounds in Ger-man and Finnish aerosols, Atmos. Environ., 37, 1775–1783, 2003.
25
ACPD
7, 5769–5803, 2007 Sugars and sugar-alcohols in ambient aerosols in Norway K. E. Yttri et al. Title Page Abstract Introduction Conclusions References Tables Figures ◭ ◮ ◭ ◮ Back CloseFull Screen / Esc
Printer-friendly Version Interactive Discussion
Claeys, M., Graham, B., Vas, G., Wang, W., Vermeylen, R., Pashynska, V., Cafmeyer, J., Guyon, P., Andreae, M. O., Artaxo, P., and Maenhaut, W.: Formation of secondary organic aerosols through photooxidation of isoprene, Science, 303, 1173–1176, 2004.
Decesari, S., Fuzzi, S., Facchini, M. C., Mircea, M., Emblico, L., Cavalli, F., Maenhaut, W., Chi, X., Schkolnik, G., Falkovich, A., Rudich, Y., Claeys, M., Pashynska, V., Vas, G., Kourtchev,
5
I., Vermeylen, R., Hoffer, A., Andreae, M. O., Tagliavini, E., Moretti, F., and Artaxo, P.: Char-acterization of the organic composition of aerosols from Rond ˆonia, Brazil, during the LBA-SMOCC 2002 experiment and its representation through model compounds, Atmos. Chem. Phys., 6, 375–402, 2006,
http://www.atmos-chem-phys.net/6/375/2006/.
10
Dye, C. and Yttri, K. E.: Determination of monosaccharide anhydrides in atmospheric aerosols by use of high-resolution mass spectrometry combined with high performance liquid chro-matography, Anal. Chem., 77, 1853–1858, 2005.
Elbert, W., Taylor, P. E., Andreae, M. O., and P ¨oschl, U.: Contribution of fungi to primary bio-genic aerosols in the atmosphere: active discharge of spores, carbohydratres, and inorganic
15
ions by Asco-and Basidiomycota, Atmos. Chem. Phys. Discuss., 6, 11 317–11 355, 2006. Facchini, M. C., Mircea, M., Fuzzi, S., and Charlson, R. J.: Cloud albedo enhancement by
surface-active organic solutes in growing droplets, Nature, 401, 257–259, 1999.
Falkovich, A. H., Graber, E. R., Schkolnik, G., Rudich, Y., Maenhaut, W., and Artaxo, P.: Low molecular weight organic acids in aerosol particles from Rond ˆonia, Brazil, during the
20
biomass-burning, transition and wet periods, Atmos. Chem. Phys., 5, 781–797, 2005,
http://www.atmos-chem-phys.net/5/781/2005/.
Fine, P. M, Cass, G., and Simoneit, B. R. T.: Chemical characterization of fine particle emissions from the fireplace combustion of woods grown in the Southern United States, Environ. Sci. Technol., 36, 1442–1451, 2002.
25
Fraser, M. P. and Lakshmanan, K.: Using levoglucosan as a molecular marker for the long range transport of biomass combustion aerosols, Environ. Sci. Technol., 34, 4560–4564, 2000.
Graber, E. R. and Rudich, Y.: Atmospheric HULIS: How humic-like are they? A comprehensive and critical review, Atmos. Chem. Phys., 6, 729–753, 2006,
30
http://www.atmos-chem-phys.net/6/729/2006/.
Graham, G., Falkovich, A. H., Rudich, Y., Maenhaut, W., Guyon, P., and Andreae, M. O.: Local and regional contributions to the atmospheric aerosol over Tel Aviv, Israel: a case study
ACPD
7, 5769–5803, 2007 Sugars and sugar-alcohols in ambient aerosols in Norway K. E. Yttri et al. Title Page Abstract Introduction Conclusions References Tables Figures ◭ ◮ ◭ ◮ Back CloseFull Screen / Esc
Printer-friendly Version Interactive Discussion
using elemental, ionic and organic tracers, Atmos. Environ., 38, 1593–1604, 2004.
Graham, B., Guyon, P., Taylor, P. E., Artaxo, P., Maenhaut, W., Glovsky, M. M., Flagan, R. C., and Andreae, M. O.: Organic compounds present in the natural Amazonian aerosol: Characterization by gas chromatography-mass spectrometry, J. Geophys. Res., 108, 4766, doi:10.1029/2003JD003990, 2003.
5
Graham, B., Mayol-Bracero, O. L., Guyon, P., Roberts, G. C., Decesari, S. Facchini, M. C., Artaxo, P., Maenhaut, W., K ¨oll, P., and Andreae, M. O.: Water-soluble organic compounds in biomass burning aerosols over Amazonia 1. Characterization by NMR and GC-MS, J. Geophys. Res., 107, 8047, doi:10.1029/2001JD000336, 2002.
Gysel, M., Weingartner, E., Nyeki, S., Baltensperger, U., Galambos, I., and Kiss, G.:
Hygro-10
scopic properties of water soluble matter and humic-like organics in atmospheric fine aerosol, Atmos. Chem. Phys., 4, 35–50, 2004,
http://www.atmos-chem-phys.net/4/35/2004/.
Havers, N., Burba, P., Lambert, J., and Klockow, D.: Spectroscopic characterization of humic-like substances in airborne particulate matter, J. Atmos. Chem., 29, 45–54, 1998.
15
Hopke, P. K., Xie, Y., Raunemaa, T., Biegalski, S., Landsberger, S., Maenhaut, W., Artaxo, P., and Cohen, D.: Characterization of the gent stacked filter unit PM10sampler, Aerosol Sci. Technol., 27, 726–735, 1997.
Ion, A. C., Vermeylen, R., Kourtchev, I., Cafmeyer, J., Chi, X., Gelencser, A., Maenhaut, W., and Claeys, M.: Polar organic compounds in rural PM2.5 aerosols from K-puszta, Hungary,
20
during a 2003 summer field campaign: Sources and diel variations, Atmos. Chem. Phys., 5, 1805–814, 2005,
http://www.atmos-chem-phys.net/5/1805/2005/.
Kamens, R., Bell, D., Dietrich, A., Perry, J., Goodman, R., Claxton, L., and Tejada, S.: Mu-tagenic transformations of dilute wood smoke systems in the presence of ozone and
nitro-25
gen dioxide – analysis of selected high-pressure liquid chromatography fractions from wood smoke particle extracts, Environ. Sci. Technol., 19, 63–69, 1985.
Kawamura, K. and Yasui, O.: Diurnal changes in the distribution of dicarboxylic acids, ketocar-boxylic acids and dicarbonyls in the urban Tokyo atmosphere, Atmos. Environ., 39, 1945– 1960, 2005.
30
Kerminen, V. M., Ojanen, C., Pakkanen, T., Hillamo, R., Aurela, M., and Merilainen, J.: Low-molecular-weight dicarboxylic acids in an urban and rural atmosphere, J. Aerosol Sci., 31, 349–362, 2000.
ACPD
7, 5769–5803, 2007 Sugars and sugar-alcohols in ambient aerosols in Norway K. E. Yttri et al. Title Page Abstract Introduction Conclusions References Tables Figures ◭ ◮ ◭ ◮ Back CloseFull Screen / Esc
Printer-friendly Version Interactive Discussion
Kirchstetter, T. W., Corrigan, C. E., and Novakov, T.: Laboratory and field investigation of the adsorption of gaseous organic compounds onto quartz filters, Atmos. Environ., 35, 1663– 1671, 2001.
Kiss, G., Varga, B., Galambos, I., and Ganszky, I.: Characterization of water-soluble organic matter isolated from atmospheric fine aerosol, J. Geophys. Res., 107, 8339,
5
doi:10.1029/2001JD000603, 2002.
Kleefeld, S., Hoffer, A., Kriv ´acsy, Z., and Jennings, S. G.: Importance of organic and black carbon in atmospheric aerosols at Mace Head, on the west coast of Ireland, Atmos. Environ., 36, 4479–4490, 2002.
Kriv ´acsy, Z., Gelencser, A., Kiss, G., Meszaros, E., Molnar, A., Hoffer, A., Meszaros, T., Sarvari,
10
Z., Temesi, D., Varga, B., Baltensperger, U., Nyeki, S., and Weingartner, E.: Study on the chemical character of water soluble organic compounds in fine atmospheric aerosol at the Jungfraujoch, J. Atmos. Chem., 39, 235–259, 2001.
Kourtchev, I., Ruuskanen, T., Maenhaut, W., Kulmala, M., and Claeys, M.: Observation of 2-methyltetrols and related photo-oxidation products of isoprene in boreal forest aerosols from
15
Hyytiala, Finland, Atmos. Chem. Phys., 5, 2761–2770, 2005,
http://www.atmos-chem-phys.net/5/2761/2005/.
Lewis, D. H. and Smith, D. C.: Sugar-alcohols (polyols) in fungi and green plants. I. Distribution, physiology and metabolism, New Phytol., 66, 143–184, 1967.
Mader, B. T., Yu, J. Z., Xu, J. H., Li, Q. F., Wu, W. S., Flagan, R. C., and Seinfeld, J. H.:
20
Molecular composition of the water-soluble fraction of atmospheric carbonaceous aerosols collected during ACE-Asia, J. Geophys. Res., 109, D06206, doi:10.1029/2003JD004105, 2004.
Matthias-Maser, S.: Primary biological aerosol particles: Their significance, sources, sampling methods and size distribution in the atmosphere, in: Atmospheric particles, edited by:
Harri-25
son, R. M. and van Grieken, R., John Wiley & Sons, Chichester, 349–368, 1998.
Mayol-Bracero, O. L., Guyon, P., Graham, B., Roberts, G., Andreae, M. O., Decesari, S., Fac-chini, M. C., Fuzzi, S., and Artaxo, P.: Water-soluble organic compounds in biomass burning aerosols over Amazonia – 2. Apportionment of the chemical composition and importance of the polyacidic fraction, J. Geophys. Res., 107, 8091, doi:10.1029/2001JD003249, 2002.
30
McDow, S. R. and Huntzicker, J. J.: Vapor adsorption artifact in the sampling of organic aerosol: face velocity effects, Atmos. Environ., 24A, 2563–2571, 1990.
Medeiros, P. M., Conte, M. H., Weber, J. C., and Simoneit, B. R. T.: Sugars as source indicators
ACPD
7, 5769–5803, 2007 Sugars and sugar-alcohols in ambient aerosols in Norway K. E. Yttri et al. Title Page Abstract Introduction Conclusions References Tables Figures ◭ ◮ ◭ ◮ Back CloseFull Screen / Esc
Printer-friendly Version Interactive Discussion
of biogenic organic carbon in aerosols collected above the Howland Experimental Forest, Maine, Atmos. Environ., 40, 1694–1705, 2006.
Medeiros, P. M. and Simoneit, B. R. T.: Analysis of sugars in environmental samples by gas chromatography-mass spectrometry, J. Chrom., A., 1141, 271–278, 2007.
Nolte, C. G., Schauer, J. J., Cass, G. R., and Simoneit, B. R. T.: Highly polar organic compounds
5
present in wood smoke and in the ambient atmosphere, Environ. Sci. Technol., 35, 1912– 1919, 2001.
Novakov, T. and Penner, J. E.: Large contribution of organic aerosols to cloud condensation nuclei concentrations, Nature, 365, 823–826, 1993.
Pacini, E.: From anther and pollen ripening to pollen presentation, Plant Syst. Evol., 222, 19–
10
43, 2000.
Pashynska, V., Vermeylen, R., Vas, G., Maenhaut, W., and Claeys, M.: Development of a gas chromatographic/ion trap mass spectrometric method for the determination of levoglucosan and saccharidic compounds in atmospheric aerosols, Application to urban aerosols, J. Mass Spectrom., 37, 1249–1257, 2002.
15
Ramanathan, V., Crutzen, P. J., Kiehl, J. T., and Rosenfeld, D.: Aerosols, climate and the hydrological cycle, Science, 294, 2119–2124, 2001.
Sanders, E. B., Goldsmith, A. I., and Seeman, J. I.: A model that distinguishes the pyrolysis of D-glucose, D-fructose, and sucrose from that of cellulose. Application to the understanding of cigarette smoke formation, J. Anal. Appl. Pyrolys., 66, 29–50, 2002.
20
Saxena, P. and Hildemann, L. M.: Water-soluble organics in atmospheric particles: A critical review of the literature and application of thermodynamics to identify candidate compounds, J. Atmos. Chem., 24, 57–109, 1996.
Schauer, J. J., Kleeman, M. J, Cass, G. R., and Simoneit, B. R. T.: Measurement of emissions from air pollution sources. 3. C1-C29organic compounds from fireplace combustion of wood,
25
Environ. Sci. Technol., 35, 1716–1728, 2001.
Schkolnik, G., Falkovich, A. H., Rudich, Y., Maenhaut, W., and Artaxo, P.: A new method for the determination of levoglucosan, methyl-erythritol and related compounds and its application for rainwater and smoke samples, Environ. Sci. Technol., 39, 2744–2752, 2005.
Schkolnik, G. and Rudich, Y.: Detection and quantification of levoglucosan in atmospheric
30
aerosols – review, Anal. Bioanal. Chem., 385, 26–33, doi:10.1007/s00216-005-0168-5 2006. Simoneit, B. R. T.: Biomass burning – a review of organic tracers for smoke from incomplete
combustion, Appl. Geochem., 17, 129–162, 2002.
ACPD
7, 5769–5803, 2007 Sugars and sugar-alcohols in ambient aerosols in Norway K. E. Yttri et al. Title Page Abstract Introduction Conclusions References Tables Figures ◭ ◮ ◭ ◮ Back CloseFull Screen / Esc
Printer-friendly Version Interactive Discussion
Simoneit, B. R. T., Elias, V. O., Kobayashi, M., Kawamura, K., Rushdi, A. I., Medeiros, P. M., Rogge, W. F., and Didyk, B. M.: Sugars – Dominant water-soluble organic compounds in soils and characterization as tracers in atmospheric particulate matter, Environ. Sci. Technol., 38, 5939–5949, 2004.
Stohl, A., Berg, T., Burkhart, J. F., Fjæraa, A. M., Forster, C., Herber, A., Hov, Ø., Lunder, C.,
5
McMillan, W. W., Oltmans, S., Shiobara, M., Simpson, D., Solberg, S., Stebel, K., Str ¨om, J., Tørseth, K., Treffeisen, R., Virkkunen, K., and Yttri, K. E.: Arctic smoke – record high air pollution levels in the European Arctic due to agricultural fires in Eastern Europe. Atmos. Chem. Phys., 7, 511–534, 2007,
http://www.atmos-chem-phys.net/7/511/2007/.
10
Taylor, P. E., Flagan, R. C., Miguel, A. G., Valenta, R., and Glovsky, M. M.: Birch pollen rupture and the release of aerosols of respirable allergens, Clin. Exp. Allergy, 34, 1591–1596, 2004. Taylor, P. E., Flagan, R. C., Valenta, R., and Glovsky, M. M.: Release of allergens as respirable
aerosols: A link between grass pollen and asthma, J. Allergy Clin. Immun., 109, 51–56, 2002.
15
Tesfaigzi, Y., Singh, S. P., Foster, J. E., Kubatko, J., Barr, E. B., Fine, P. M., McDonald, J. D., Hahn, F. F., and Mauderly, J. L.: Health effects of subchronic exposure to low levels of wood smoke in rats, Toxicol. Sci., 65, 115–125, 2002.
Varga, B., Kiss, G., Ganszky, I., Gelencser, A., and Krivacsy, Z.: Isolation of water-soluble organic matter from atmospheric aerosol, Talanta, 55, 561–572, 2001.
20
Yttri, K. E., Dye, C., Slørdal, L. H., and Braathen, O.-A.: Quantification of monosaccharide anhydrides by negative electrospray HPLC/HRMS-TOF – Application to aerosol samples from an urban and a suburban site influenced by small scale wood burning, J. Air Waste Ma., 55, 1169–1177, 2005.
Zappoli, S., Andracchio, A., Fuzzi, S., Facchini, M. C., Gelencser, A., Kiss, G., Krivacsy, Z.,
25
Molnar, A., Meszaros, E., Hansson, H. C., Rosman, K., and Zebuhr, Y.: Inorganic, organic and macromolecular components of fine aerosol in different areas of Europe in relation to their water solubility, Atmos. Environ., 33, 2733–2743, 1999.
ACPD
7, 5769–5803, 2007 Sugars and sugar-alcohols in ambient aerosols in Norway K. E. Yttri et al. Title Page Abstract Introduction Conclusions References Tables Figures ◭ ◮ ◭ ◮ Back CloseFull Screen / Esc
Printer-friendly Version Interactive Discussion
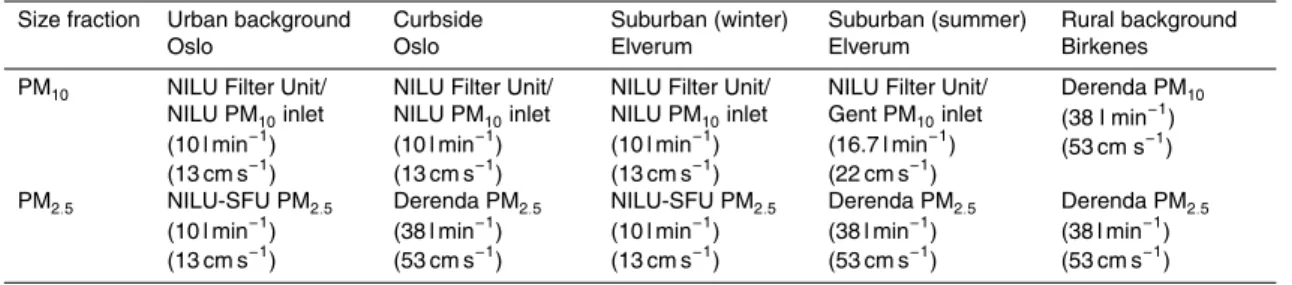
Table 1. Volumetric flow rate (l min−1) and filter face velocity (cm s−1) for the aerosol samplers
applied.
Size fraction Urban background Oslo Curbside Oslo Suburban (winter) Elverum Suburban (summer) Elverum Rural background Birkenes PM10 NILU Filter Unit/
NILU PM10inlet
(10 l min−1)
(13 cm s−1)
NILU Filter Unit/ NILU PM10inlet
(10 l min−1)
(13 cm s−1)
NILU Filter Unit/ NILU PM10inlet
(10 l min−1)
(13 cm s−1)
NILU Filter Unit/ Gent PM10inlet (16.7 l min−1) (22 cm s−1) Derenda PM10 (38 l min−1) (53 cm s−1) PM2.5 NILU-SFU PM2.5 (10 l min−1) (13 cm s−1) Derenda PM2.5 (38 l min−1) (53 cm s−1) NILU-SFU PM2.5 (10 l min−1) (13 cm s−1) Derenda PM2.5 (38 l min−1) (53 cm s−1) Derenda PM2.5 (38 l min−1) (53 cm s−1) 5792
ACPD
7, 5769–5803, 2007 Sugars and sugar-alcohols in ambient aerosols in Norway K. E. Yttri et al. Title Page Abstract Introduction Conclusions References Tables Figures ◭ ◮ ◭ ◮ Back CloseFull Screen / Esc
Printer-friendly Version Interactive Discussion
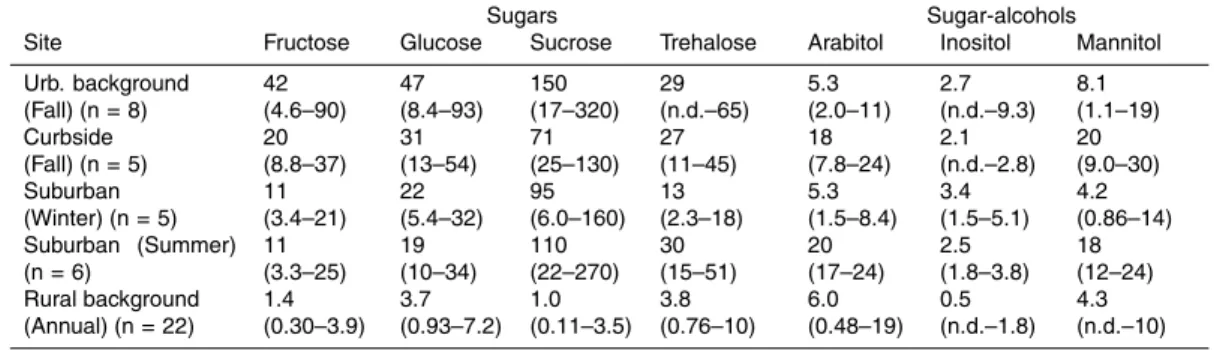
Table 2. Mean (min-max) concentrations of sugars and sugar-alcohols in PM10(ng m−3).
Sugars Sugar-alcohols
Site Fructose Glucose Sucrose Trehalose Arabitol Inositol Mannitol Urb. background (Fall) (n = 8) 42 (4.6–90) 47 (8.4–93) 150 (17–320) 29 (n.d.–65) 5.3 (2.0–11) 2.7 (n.d.–9.3) 8.1 (1.1–19) Curbside (Fall) (n = 5) 20 (8.8–37) 31 (13–54) 71 (25–130) 27 (11–45) 18 (7.8–24) 2.1 (n.d.–2.8) 20 (9.0–30) Suburban (Winter) (n = 5) 11 (3.4–21) 22 (5.4–32) 95 (6.0–160) 13 (2.3–18) 5.3 (1.5–8.4) 3.4 (1.5–5.1) 4.2 (0.86–14) Suburban (Summer) (n = 6) 11 (3.3–25) 19 (10–34) 110 (22–270) 30 (15–51) 20 (17–24) 2.5 (1.8–3.8) 18 (12–24) Rural background (Annual) (n = 22) 1.4 (0.30–3.9) 3.7 (0.93–7.2) 1.0 (0.11–3.5) 3.8 (0.76–10) 6.0 (0.48–19) 0.5 (n.d.–1.8) 4.3 (n.d.–10) n.d. = not detected 5793
ACPD
7, 5769–5803, 2007 Sugars and sugar-alcohols in ambient aerosols in Norway K. E. Yttri et al. Title Page Abstract Introduction Conclusions References Tables Figures ◭ ◮ ◭ ◮ Back CloseFull Screen / Esc
Printer-friendly Version Interactive Discussion
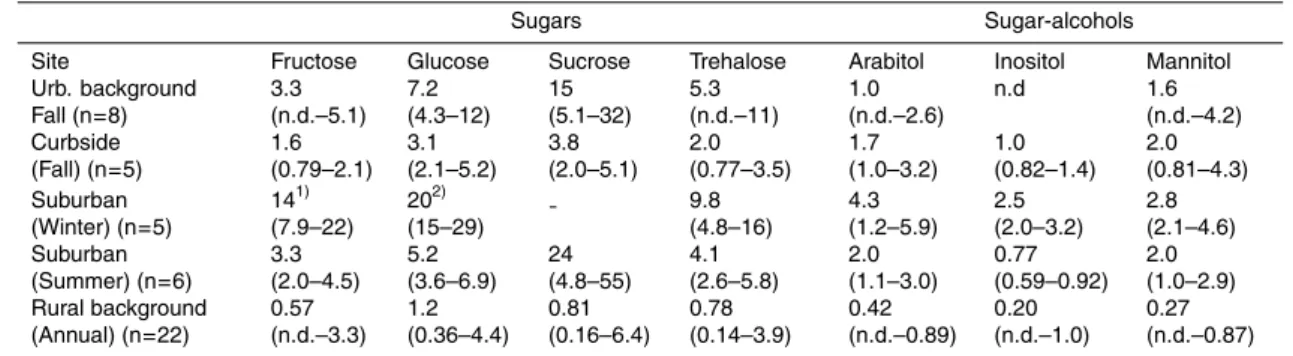
Table 3. Mean (min-max) concentrations of sugars and sugar-alcohols in PM2.5(ng m−3).
Sugars Sugar-alcohols
Site Fructose Glucose Sucrose Trehalose Arabitol Inositol Mannitol Urb. background Fall (n=8) 3.3 (n.d.–5.1) 7.2 (4.3–12) 15 (5.1–32) 5.3 (n.d.–11) 1.0 (n.d.–2.6) n.d 1.6 (n.d.–4.2) Curbside (Fall) (n=5) 1.6 (0.79–2.1) 3.1 (2.1–5.2) 3.8 (2.0–5.1) 2.0 (0.77–3.5) 1.7 (1.0–3.2) 1.0 (0.82–1.4) 2.0 (0.81–4.3) Suburban (Winter) (n=5) 141) (7.9–22) 202) (15–29) 9.8 (4.8–16) 4.3 (1.2–5.9) 2.5 (2.0–3.2) 2.8 (2.1–4.6) Suburban (Summer) (n=6) 3.3 (2.0–4.5) 5.2 (3.6–6.9) 24 (4.8–55) 4.1 (2.6–5.8) 2.0 (1.1–3.0) 0.77 (0.59–0.92) 2.0 (1.0–2.9) Rural background (Annual) (n=22) 0.57 (n.d.–3.3) 1.2 (0.36–4.4) 0.81 (0.16–6.4) 0.78 (0.14–3.9) 0.42 (n.d.–0.89) 0.20 (n.d.–1.0) 0.27 (n.d.–0.87) 1. n=3 2. n=4 5794
ACPD
7, 5769–5803, 2007 Sugars and sugar-alcohols in ambient aerosols in Norway K. E. Yttri et al. Title Page Abstract Introduction Conclusions References Tables Figures ◭ ◮ ◭ ◮ Back CloseFull Screen / Esc
Printer-friendly Version Interactive Discussion
Table 4. Mean (min-max) concentration of monosaccharide anhydrides in PM10(ng m−3).
Site Levoglucosan Mannosan Galactosan SUM MA
Urb. background (Fall) (n = 8) 193 (n.d.–475) 52 (n.d.–155) 1.7 (n.d.–6.9) 246 (n.d.–615)
Curbside (Fall) (n = 5) 45 (9.4–109) 8.5 (n.d.–21) 3.5 (n.d.–7.3) 57 (11–134) Suburban (Winter) (n = 5) 605 (232–971) 167 (56–286) 4.0 (1.1–6.8) 772 (288–1240) Suburban (Summer) (n = 6) 47 (n.d.–151) 10 (n.d.–42) 3 (n.d.–7.5) 60 (n.d.–201) Rural background (Annual) (n = 22) 7.8 (0.3–25) 1.9 (0.1–6.9) 0.6 (n.d.–2.3) 10 (0.5–35) 5795
ACPD
7, 5769–5803, 2007 Sugars and sugar-alcohols in ambient aerosols in Norway K. E. Yttri et al. Title Page Abstract Introduction Conclusions References Tables Figures ◭ ◮ ◭ ◮ Back CloseFull Screen / Esc
Printer-friendly Version Interactive Discussion
Table 5. Mean relative contribution of sugars and sugar-alcohols in the PM2.5 fraction to the PM10fraction (%).
Sugars Sugar-alcohols
Site Fructose Glucose Sucrose Trehalose Arabitol Inositol Mannitol
Urb. background (Fall) 8 15 10 18 19 20
Curbside (Fall) 8 10 5 7 10 49 10
Suburban (Winter) 921) 762) 75 82 75 66
Suburban (Summer) 29 27 23 14 10 31 11
Rural background (Annual) 40 33 85 20 7.0 39 6.3
1. n=3 2. n=4
ACPD
7, 5769–5803, 2007 Sugars and sugar-alcohols in ambient aerosols in Norway K. E. Yttri et al. Title Page Abstract Introduction Conclusions References Tables Figures ◭ ◮ ◭ ◮ Back CloseFull Screen / Esc
Printer-friendly Version Interactive Discussion
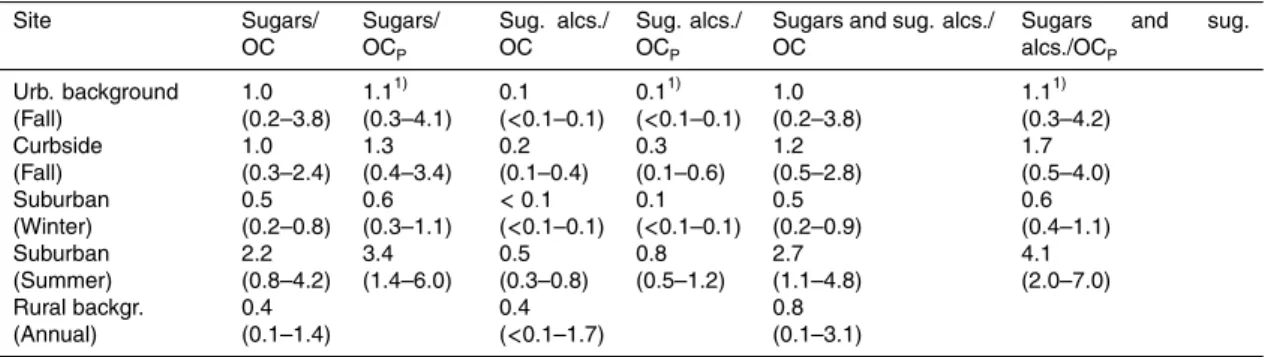
Table 6a. Mean (min-max) relative contribution of the carbon content of sugars and
sugar-alcohols to the non-corrected (OC) and the corrected OCP organic carbon fraction of PM10 (%). Site Sugars/ OC Sugars/ OCP Sug. alcs./ OC Sug. alcs./ OCP
Sugars and sug. alcs./ OC
Sugars and sug. alcs./OCP Urb. background (Fall) 1.0 (0.2–3.8) 1.11) (0.3–4.1) 0.1 (<0.1–0.1) 0.11) (<0.1–0.1) 1.0 (0.2–3.8) 1.11) (0.3–4.2) Curbside (Fall) 1.0 (0.3–2.4) 1.3 (0.4–3.4) 0.2 (0.1–0.4) 0.3 (0.1–0.6) 1.2 (0.5–2.8) 1.7 (0.5–4.0) Suburban (Winter) 0.5 (0.2–0.8) 0.6 (0.3–1.1) <0.1 (<0.1–0.1) 0.1 (<0.1–0.1) 0.5 (0.2–0.9) 0.6 (0.4–1.1) Suburban (Summer) 2.2 (0.8–4.2) 3.4 (1.4–6.0) 0.5 (0.3–0.8) 0.8 (0.5–1.2) 2.7 (1.1–4.8) 4.1 (2.0–7.0) Rural backgr. (Annual) 0.4 (0.1–1.4) 0.4 (<0.1–1.7) 0.8 (0.1–3.1)
1. Positive artefact estimated by QBQ-approach.
ACPD
7, 5769–5803, 2007 Sugars and sugar-alcohols in ambient aerosols in Norway K. E. Yttri et al. Title Page Abstract Introduction Conclusions References Tables Figures ◭ ◮ ◭ ◮ Back CloseFull Screen / Esc
Printer-friendly Version Interactive Discussion
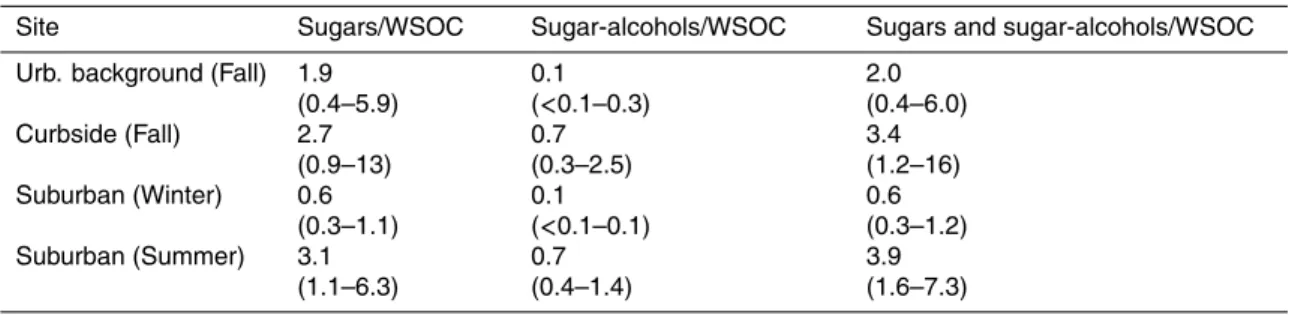
Table 6b. Mean (min-max) relative contribution the carbon content of sugars and
sugar-alcohols to the water-soluble organic carbon (WSOC) fraction of PM10(%).
Site Sugars/WSOC Sugar-alcohols/WSOC Sugars and sugar-alcohols/WSOC
Urb. background (Fall) 1.9
(0.4–5.9) 0.1 (<0.1–0.3) 2.0 (0.4–6.0) Curbside (Fall) 2.7 (0.9–13) 0.7 (0.3–2.5) 3.4 (1.2–16) Suburban (Winter) 0.6 (0.3–1.1) 0.1 (<0.1–0.1) 0.6 (0.3–1.2) Suburban (Summer) 3.1 (1.1–6.3) 0.7 (0.4–1.4) 3.9 (1.6–7.3) 5798
ACPD
7, 5769–5803, 2007 Sugars and sugar-alcohols in ambient aerosols in Norway K. E. Yttri et al. Title Page Abstract Introduction Conclusions References Tables Figures ◭ ◮ ◭ ◮ Back CloseFull Screen / Esc
Printer-friendly Version Interactive Discussion
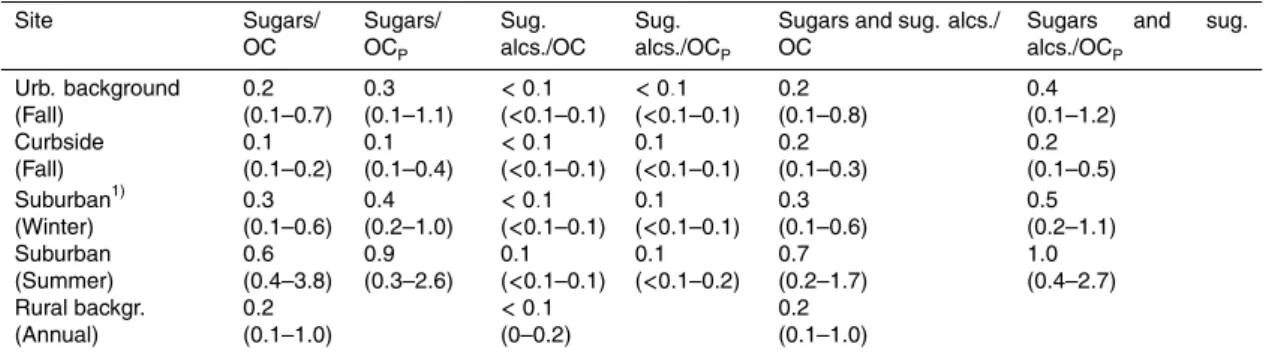
Table 7a. Mean (min-max) relative contribution of the carbon content of sugars and
sugar-alcohols to the non-corrected (OC) and the corrected OCP organic carbon fraction of PM2.5 (%). Site Sugars/ OC Sugars/ OCP Sug. alcs./OC Sug. alcs./OCP
Sugars and sug. alcs./ OC
Sugars and sug. alcs./OCP Urb. background (Fall) 0.2 (0.1–0.7) 0.3 (0.1–1.1) <0.1 (<0.1–0.1) <0.1 (<0.1–0.1) 0.2 (0.1–0.8) 0.4 (0.1–1.2) Curbside (Fall) 0.1 (0.1–0.2) 0.1 (0.1–0.4) <0.1 (<0.1–0.1) 0.1 (<0.1–0.1) 0.2 (0.1–0.3) 0.2 (0.1–0.5) Suburban1) (Winter) 0.3 (0.1–0.6) 0.4 (0.2–1.0) <0.1 (<0.1–0.1) 0.1 (<0.1–0.1) 0.3 (0.1–0.6) 0.5 (0.2–1.1) Suburban (Summer) 0.6 (0.4–3.8) 0.9 (0.3–2.6) 0.1 (<0.1–0.1) 0.1 (<0.1–0.2) 0.7 (0.2–1.7) 1.0 (0.4–2.7) Rural backgr. (Annual) 0.2 (0.1–1.0) <0.1 (0–0.2) 0.2 (0.1–1.0)
1. Sucrose is not accounted for at this site
ACPD
7, 5769–5803, 2007 Sugars and sugar-alcohols in ambient aerosols in Norway K. E. Yttri et al. Title Page Abstract Introduction Conclusions References Tables Figures ◭ ◮ ◭ ◮ Back CloseFull Screen / Esc
Printer-friendly Version Interactive Discussion
Table 7b. Mean (min-max) relative contribution of the carbon content of sugars and
sugar-alcohols to the water-soluble organic carbon (WSOC) fraction of PM2.5(%).
Site Sugars/WSOC Sugar-alcohols/WSOC Sugars and sugar-alcohols/WSOC
Urban background (Fall) 0.5
(0.2–1.2) <0.1 (<0.1–0.1) 0.5 (0.2–1.3) 5800
ACPD
7, 5769–5803, 2007 Sugars and sugar-alcohols in ambient aerosols in Norway K. E. Yttri et al. Title Page Abstract Introduction Conclusions References Tables Figures ◭ ◮ ◭ ◮ Back CloseFull Screen / Esc
Printer-friendly Version Interactive Discussion Oslo Elverum Birkenes
Norway
Sweden
Fig. 1. Map of the southern parts of Norway including the location of the sampling sites
Birkenes (rural background), Elverum (suburban), and Oslo (curbside and urban background).
ACPD
7, 5769–5803, 2007 Sugars and sugar-alcohols in ambient aerosols in Norway K. E. Yttri et al. Title Page Abstract Introduction Conclusions References Tables Figures ◭ ◮ ◭ ◮ Back CloseFull Screen / Esc
Printer-friendly Version Interactive Discussion 0.1 1 10 0 5 10 15 Trehalose Summer C = 7.5 ng m-3 dc /d log dp (n g m -3) Dp(µm) 0.1 1 10 0 5 10 15 Mannitol Summer C = 9.3 ng m-3 dc /d log dp (n g m -3) Dp(µm) 0.1 1 10 0 5 10 15 Arabitol Summer C = 4.3 ng m-3 dc /d log dp (n g m -3) Dp(µm) 0.1 1 10 0 1 2 3 4 5 Arabitol Winter C = 3.6 ng m-3 dc /d log dp (n g m -3) Dp(µm) 0.1 1 10 0 1 2 3 4 5 6 7 Glucose Summer C = 5.8 ng m-3 dc /d log dp (n g m -3) Dp(µm) Dp(µm) 0.1 1 10 0 1 2 3 4 5 6 7 Glucose Winter C = 7.7 ng m-3 dc /d log dp (n g m -3) 0.1 1 10 0 5 10 15 20 25 30 35 Sucrose Summer C = 24 ng m-3 dc /d log dp (n g m -3) Dp(µm) A C E G B D F
Fig. 2. Size-distributions of trehalose (a), mannitol (b), arabitol (c) and (d), glucose (e and f)
and sucrose (g) obtained from samples collected at the suburban site using a Berner impactor. Samples were collected for both a winter and a summer period. The size-distributions rep-resenting the winter campaign were collected during the period 11–13 March 2002, whereas the size-distributions representing the summer campaign were collected during the period 5–7 June 2002.
ACPD
7, 5769–5803, 2007 Sugars and sugar-alcohols in ambient aerosols in Norway K. E. Yttri et al. Title Page Abstract Introduction Conclusions References Tables Figures ◭ ◮ ◭ ◮ Back CloseFull Screen / Esc
Printer-friendly Version Interactive Discussion 0 10 20 30 0 10 20 30 0 10 20 30 40 50 PM2.5Sugars PM2.5Sugar-alcohols Fall Summer Spring Winter C oncent rat ion (ng m -3) C C oncent rat ion (ng m -3) PM 10Sugars PM 10Sugar-alcohols B C oncent rat ion (ng m -3)
PM10Sum sugars and sugar-alcohols PM2.5Sum sugars and sugar-alcohols PM10Levoglucosan A 1 2 3 4 5 6
Fig. 3. (a): Annual variation of the sum of sugars (fructose, glucose, sucrose and trehalose)
and sugar-alcohols (arabitol, inositol and mannitol) in PM10and PM2.5along with concentrations of levoglucosan in PM10at the rural site Birkenes. (b): Annual variation of sugars and sugar-alcohols in the PM10fraction at Birkenes. (c): Annual variation of sugars and sugar-alcohols in the PM2.5fraction at Birkenes.