UNIFIED KERNEL/USER-SPACE EFFICIENT LINUX TRACING ARCHITECTURE
DAVID GOULET
D´EPARTEMENT DE G ´ENIE INFORMATIQUE ET G´ENIE LOGICIEL ´
ECOLE POLYTECHNIQUE DE MONTR ´EAL
M ´EMOIRE PR ´ESENT´E EN VUE DE L’OBTENTION DU DIPL ˆOME DE MAˆITRISE `ES SCIENCES APPLIQU ´EES
(G´ENIE INFORMATIQUE) AVRIL 2012
´
ECOLE POLYTECHNIQUE DE MONTR´EAL
Ce m´emoire intitul´e :
UNIFIED KERNEL/USER-SPACE EFFICIENT LINUX TRACING ARCHITECTURE
pr´esent´e par : GOULET David
en vue de l’obtention du diplˆome de : Maˆıtrise `es Sciences Appliqu´ees a ´et´e dˆument accept´e par le jury constitu´e de :
M. ANTONIOL Giuliano, Ph.D., pr´esident
M. DAGENAIS Michel, Ph.D., membre et directeur de recherche M. BOIS Guy, Ph.D., membre
For a free and common knowledge for everyone on earth regardless of gender, race or color . . .
Pour un savoir libre et commun pour tous sans distinction de genre, race ou couleur . . .
LICENSE
Unified Kernel/User-space Efficient Linux Tracing Architecture
by David Goulet is licensed under a
Creative Commons Attribution-ShareAlike 3.0 Unported License Based on the work at lttng.org
Copyleft
This is a contribution to the global intellectual commons which provides the greatest benefit to all people and help realizing universal and free access to culture, education and research.
ACKNOWLEDGEMENTS
First of all, I would like to thanks my director Michel Dagenais for giving me the oppor-tunity to work with him and learn from his immense legacy in the tracing world which is still growing today. I will not thank him however for the pain endure during the Lafayette mountain hiking which greatly diminish my ability to walk the next morning. I have learn my lesson not to follow him anymore.
I would also like to thanks Yannick Brosseau and Matthew Khouzam who motivated me and followed my work greatly through out my master. Without them, LTTng would not be what it is today and would be seperated from Java.
Very special thanks to the great Dr. Tracing, Mathieu Desnoyers. His appetite for tracing and computer science is insatiable as well as his knowledge. Thanks to him for mentoring me through out this journey and making a leap of faith in my ability to improve the tracing world.
Thanks to mister Alexandre ”My-Pleasure” and Julien Desfossez for tolerating me in the DORSAL lab and making a difference in every decision of the LTTng project.
Thanks to Revolution Linux for their financial and technical support. Thanks to the Ericsson team in Montr´eal as well for helping us improve our work and giving us importan use cases. Thanks to the Research Council of Canada for the research funding.
I would like also to thanks the Dieu Du Ciel microbrewery who hosted most of our meetings and is basically a landmark in the LTTng community.
Finally, I would like to thank my love, H´el`ene, for supporting me all the way through by believing in me and keeping my moral high and happy.
R´
ESUM´
E
De nos jours, il n’est pas inhabituel de voir de grands centres de donn´ees regroupant des centaines de serveurs d´eployant de grosses applications, des syst`emes d’exploitation h´et´erog`enes et diff´erentes technologie de virtualisation. Implanter du tra¸cage dans ce genre d’environnement peut s’av´erer utile pour la surveillance et le d´ebogage de probl`emes de pro-duction. Avec les derni`ere architecture de tra¸cage d´evelopp´e, il peut ˆetre difficile d’atteindre un tel objectif dans un environnement multi-utilisateur et ´egalement traiter les questions de s´ecurit´e.
Dans cette recherche, nous proposons une nouvelle architecture de tra¸cage unifi´ee combi-nant l’espace noyau et utilisateur visant `a r´epondre aux contraintes de production en termes de s´ecurit´e et de performance. Avec le traceur en espace utilisateur, le nombre de sources de donn´ees augmentent, o`u non seulement le noyau peut ˆetre trac´ee mais plusieurs applications en mˆeme temps.
Cette nouvelle architecture pr´esente un d´emon de session qui devient une nouvelle com-posante de tra¸cage agissant comme un point de rendez-vous pour toutes les interactions avec les traceurs. Ce d´emon agit comme un registre de sessions de tra¸cage pour les utilisa-teurs abstrayant les traceurs `a des domaines. Nous proposer un ensemble de structure de donn´ees sans verrou et des algorithmes utilis´es pour construire la base de registre rendant cette composante tr`es performante.
Cela a permis la cr´eation du projet lttng-tools, bas´ee sur les traceurs de LTTng 2.0, qui met en oeuvre l’architecture propos´ee. Nous avons d´evelopp´e plusieurs algorithmes pour g´erer et fournir un syst`eme multi-session et multi-utilisateur tout en gardan une empreinte m´emoire et CPU basse sur la machine cible. Avec l’abilit´e du traceur de l’espace utilisateur de s’enregistrer au d´emarrage au d´emon de session, de nouvelles fonctionnalit´es sont disponibles comme lister des applications tracable et de permettre de tracer des ´ev`enements disponibles seulement au d´emarrage de l’application.
Nous avons d´emontrer l’exactitude de notre mod`ele en utilisant le tra¸cage noyau par ce nouveau composant pour analyser la performance de grosses applications de qui a ´et´e inspir´e la conception des m´ecanismes internes de parall´elisme.
Enfin, cette ´etude pr´esente les travaux futurs et les am´eliorations possibles du mod`ele propos´e et examine les d´efis `a venir.
ABSTRACT
Nowadays, it is not unusual to see large data centers regrouping hundreds of servers mixing large applications, heterogeneous kernels and different virtualization technology. De-ploying tracing in these kinds of environments can prove to be useful for monitoring and debugging production problems. With today’s tracing architecture, it can be difficult to achieve such goal in a multi-user environment while also dealing with security issues.
In this research, we propose a new unified tracing architecture combining kernel and user space aimed at addressing production constraints in terms of security and low-instrusiveness for large scale deployment. With user space tracers, data sources increase where not only the kernel can be traced but multiple applications at the same time.
This new architecture introduces a session daemon which becomes a new tracing com-ponent acting as a rendez-vous point for all interactions with the tracers. This daemon acts as a tracing registry providing tracing sessions to users, abstracting tracers to domains. We propose a set of lockless data structures and algorithms used to build the registry and making this component very efficient.
This brought to life the lttng-tools project, based on the LTTng 2.0 tracers, which implements the proposed architecture. We have developed several algorithms to handle and provide a multi-session and multi-user tracing environment with a low memory and CPU footprint on the target machine. With the user space tracer ability to register at startup to the session daemon, a new set of features are available, from listing traceable applications to enabling events before registration, allowing recording of very early events during the boostrap process of the program.
We have demonstrated the usability of our model by using kernel tracing through this new component to analyze the performance of large applications, which inspired us to design internal multithreaded mechanisms.
Finally, this study presents future work and possible improvements to the proposed model and discusses the next challenges.
CONTENTS
DEDICATION . . . iii ACKNOWLEDGEMENTS . . . v R´ESUM´E . . . vi ABSTRACT . . . vii CONTENTS . . . viii LIST OF TABLES . . . x LIST OF FIGURES . . . xiLIST OF APPENDICES . . . xii
LIST OF SIGNS AND ABBREVIATIONS . . . xiii
CHAPTER 1 INTRODUCTION . . . 1 1.1 Tracing overview . . . 1 1.2 Problem . . . 2 1.3 Objectives . . . 2 1.4 Contribution . . . 3 1.5 Outline . . . 3
CHAPTER 2 STATE OF THE ART . . . 4
2.1 Tracing infrastructure . . . 4
2.1.1 Tracing systems . . . 4
2.2 Multi-user architecture . . . 9
2.2.1 Popular applications . . . 10
CHAPTER 3 UNIFIED KERNEL/USER-SPACE EFFICIENT LINUX TRACING AR-CHITECTURE . . . 12
3.1 Abstract . . . 12
3.2 Introduction . . . 13
3.3.1 Tracing infrastructure . . . 14
3.3.2 Multi-user multithreaded application . . . 15
3.3.3 Synchronization . . . 17
3.4 Design Requirements . . . 17
3.5 Unified tracing architecture . . . 18
3.5.1 Tracing concepts . . . 20 3.5.2 Session daemon . . . 22 3.6 Experimental results . . . 35 3.6.1 Benchmarks . . . 35 3.6.2 Comparison . . . 40 3.6.3 Discussion . . . 44 3.7 Conclusion . . . 44
CHAPTER 4 GENERAL DISCUSSION . . . 45
4.1 Thread pooling . . . 45
4.2 Network streaming . . . 46
4.3 UST 0.x scalability . . . 47
CHAPTER 5 CONCLUSION . . . 49
5.1 Summary of the work . . . 49
5.2 Limitations . . . 50
5.3 Future work . . . 50
LIST OF REFERENCES . . . 51
LIST OF TABLES
Table 3.1 Scheme to avoid race condition between look up and lock . . . 34
Table 3.2 Test setup specification . . . 35
Table 3.3 write to pipe . . . 36
Table 3.4 read from pipe . . . 36
Table 3.5 send to socket . . . 37
Table 3.6 recv from socket . . . 37
Table 3.7 UST notification time breakdown . . . 40
Table 3.8 UST registration time breakdown . . . 40
Table 3.9 Memory usage of lttng-sessiond (size kB) . . . 41
Table 3.10 CPU usage of lttng-sessiond (% System CPU time) . . . 41
Table 3.11 Apache dispatch request time . . . 43
LIST OF FIGURES
Figure 3.1 Architecture . . . 19
Figure 3.2 Multi-user scenario . . . 23
Figure 3.3 UST registration synchronization . . . 25
Figure 3.4 UST registration wait/wake race . . . 25
Figure 3.5 User space tracer registration . . . 27
Figure 3.6 Session lock with the lockless hash table issue . . . 28
Figure 3.7 Tracing registry . . . 29
Figure 3.8 Two lockless hash table node . . . 30
Figure 3.9 Possible race with register before . . . 31
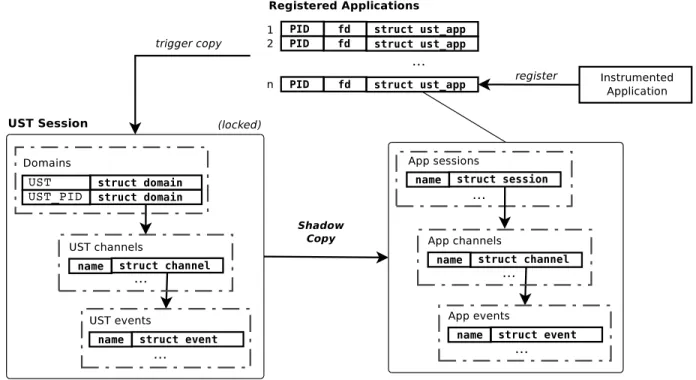
Figure 3.10 Lockless shadow-copy mechanism on application registration . . . 32
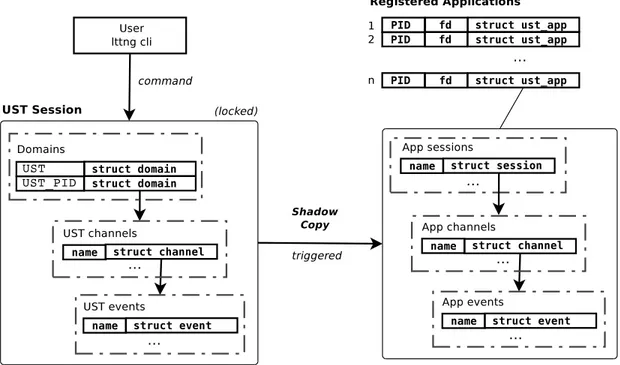
Figure 3.11 Lockless shadow-copy mechanism on client command . . . 33
Figure 3.12 Session lock with the lockless hash table issue . . . 34
Figure 3.13 Socket send() vs Pipe write() . . . 38
LIST OF APPENDICES
Appendice A LTTng-Tools session code snippet . . . 53
Appendice B CPU frequency acquisition code . . . 55
Appendice C Apache tests . . . 57
LIST OF SIGNS AND
ABBREVIATIONS
API Application Programming Interface
ASCII American Standard Code for Information Interchange BLOB Binary Large Object
CLI Command Line Interface CPU Central Processing Unit GDB GBU Debugger
FIFO First In First Out
HTTP Hypertext Transfer Protocol I/O Input/Output
IP Internet Protocol
IPC Inter Process Communication IT Information Technology
LDAP Lightweight Directory Access Protocol LTT Linux Trace Toolkit
LTTng Linux Trace Toolkit Next Generation
POSIX Portable Operating System Interface for Unix PID Process Identifier
RCU Read-Copy Update SHM Shared Memory
SMP Symmetric Multiprocessing SSL Secure Socket Layer
TCP Transport Control Protocol UST User Space Tracer
UID Unique Identifier
CHAPTER 1
INTRODUCTION
Since the beginning of the LTTng project, and the release of its low-intrusiveness Linux tracer, tracing is used on a daily basis in very large data centers from small and medium companies like Revolution Linux to large corporation like Ericsson and Google. Over time, it has proven that it is not only useful for debugging complex performance problems. An increasing number of people are looking at tracing as a new tool for monitoring health of large computer clusters.
However, production deployment is still not mainstream. Key aspects are missing for it to be considered an essential production infrastructure component. Efficient tracers and data analysis tools are not enough.
1.1
Tracing overview
In order to understand the research problem, this section makes a brief overview of tracing by defining basic concepts used throughout this document.
On popular operating systems such as Linux, tracing is the action of recording events or ”trace events” with a minimum of disturbance. In other words, it is an high throughput and efficient printf used to extract information from a running system, either from the kernel or from a simple user space application.
To achieve such goals, instrumentation is enabled on a trace source (Ex: kernel) called tracepoints. It can be added statically at the source code level or dynamically during runtime. Unlike traditionnal debug statements, tracepoints can be enabled or disabled at any point during the system lifetime. When a tracepoint is reached during execution, a probe, connected to it, is responsible for writing the data to buffers managed by the tracer. For each tracer, there is a consumer with a single task, writing the gathered information to a device (Ex: disk, network card).
A tracer is considered a tracing source, i.e. providing information for one contained sys-tem like the kernel or an application. With user space tracing, multiple sources are possible and can be merged with kernel data for extensive analysis of an application behaviour.
LTTV or TMF (Tracing Monitoring Framework) developed by Ericsson are used to display and understand collected data.
1.2
Problem
Today, many servers are running large number of applications with many different users. Thus, there is, at an unknown rate, always new programs spawning, chaging state (blocked, sleeping) and dying due to constant user interactions and potential heavy workload (Web servers). We are faced with new challenges both in terms of security and management of multiple tracing sources at once.
As mentionned, security is a very important issue here. Both user access control and data security have to be taken into account considering, for example, that critical applications like Web transactional software can be traced. With multiple programs running with different security credentials, it makes sense to consider managing user space tracing with a trusted central entity following an important security rule which is that no unprivileged user should be trusted.
The problem studied in this work is how can we achieve tracing in a production envi-ronment and still address resource usage and security constraints, using the LTTng tracer as research vehicle. We then propose a new architecture and demonstrate its effectiveness through the open source lttng-tools project which fulfills the needs for reliable tracing tools in both controlled and uncontrolled IT ecosystems.
1.3
Objectives
The methodology of this study focuses on the following four steps and resulted in a working implementation of our proposed model 3.1. The objective is to come up with a new architecture designed to combine kernel and user space tracing with a low overhead on the system. Improving usability is also highly desirable.
1. Study tracing impact and needs for large scale deployment.
Identify key architectural aspects of having tracing in production systems often involv-ing machines with heavy workloads.
2. Create new algorithms and design model to achieve our tracing goals. 3. Implement new tracing components to validate our model and algorithms. 4. Provide measurements for reference baseline results.
1.4
Contribution
The main contribution of this research is the design and creation of a tracing architecture suited and ready for production usage. This work includes the creation of efficient scheme and algorithm used to handle tracing for multiple applications. Those schemes extensively use RCU lockless data structures.
– Lockless dispatch mechanism to a thread pool. – Efficient tracing application registration scheme. – Tracing registry and lockless management.
– Kernel and user space tracing control unification.
The implementation of this work ended being the lttng-tools project providing a cen-tral point of control for tracing in the LTTng 2.0 toolchain.
1.5
Outline
Chapter 2 presents the state of the art of tracing systems and focuses on the infrastructure design. This section is a complete study of tracing related work, and relevant multithreaded multi-user daemon applications (in other areas than tracing but facing similar architectural requirements).
Then, Chapter 3 presents the article Unified efficient Linux tracing architecture combining kernel and user space submitted to the ACM Operating Systems Review. This article details the core of our research contributions. Section 3.3 is a subset of the state of the art Chapter and adds a note on performance. Section 3.5 presents the proposed unified efficient tracing architecture. Subsequently, section 3.6 shows the experimental results and performance baseline of the implemented solution.
Chapter 4 follows with some discussions on other work done and consideration on non-implemented parts of the model.
We will conclude in Chapter 5 by summarizing our work, explaining limitations to the solution and possible future work.
CHAPTER 2
STATE OF THE ART
This chapter presents different tracing related software tools and how they coped with multi-user tracing of multiple sources, from a performance and security point of view. This is highly relevant since it defines part of a tracing model for production environments.
Following this, we examine the work done on multithreaded Linux daemons handling large number of user requests. The actual benefit of this study is to explore architectures developed in other fields to solve similar problems. Thus, looking at existing APIs and mechanisms to deal with a large number of applications, interacting with a central service concurrently, is directly relevant.
2.1
Tracing infrastructure
The first subsection gives an overview of past and present software tracing systems and their architecture and design choices. This part is needed to identify some key elements missing for a good production tracing infrastructure and understand success and failures.
2.1.1
Tracing systems
In early 1994, a technique called dynamic instrumentation or Dyninst API was proposed to provide efficient, scalable and detailed data collection for large-scale parallel applications (Hollingsworth et al., 1994). Being one of the first tracing systems, the infrastructure built for data extraction was limited. The operating systems at hand were not able to provide efficient services for data extraction. They had to build a data transport component to read the tracing data, using the ptrace function, that was based on a time slice to read data. A time slice handler was called at the end of each time slice, i.e when the program was scheduled out, and the data would be read by the data transport program built on top.
Based on this technology, the DPCL project was created to extend the Dyninst tools using a robust scalable design. It offered, at the time, an API for installing and removing instrumentation from serial or parallel programs at runtime (Pase, 1998). The original motivation for DPCL was to provide application performance analysis tools for customers where no tool suppliers could build this kind of framework.
This framework provided components to manage tracing, with what they called special daemons that work in a client-server application scheme. The end-user-tools were able to communicate with a service provider (daemon) and that daemon could install, activate, de-activate and remove instrumentation in an application. Both synchronous and asynchronous requests could be handled. This instrumentation was defined combining probe expressions and probe modules, which is a concept that we will meet later in the Systemtap project.
DPCL introduced the concept of a central daemon processing client requests through a library. The client tool, wanting to create a connection to a process for data acquisition, spawned a super daemon, if it did not exist, that checked for a normal daemon. The normal daemon would change its ownership to the process credentials. The connection was then transfered to that daemon and a channel was opened to the target process. Thus, for each user, there was a DPCL daemon created. The infrastructure design was made to provide a secure infrastructure and to be scalable on multiple nodes. This way, user a cannot interact with the daemon of user b and vice versa. It basically offloads all access control to the kernel. This framework made possible new tools like DynaProf and graphical user interface for data analysis (DeRose et al., 2001). DynaProf is a dynamic profiling tool that provides a command line interface, similar to gdb, used to interact with the DPCL API and to basically control tracing all over your system.
Kernel tracing brought a new dimension to infrastructure design, having the problem of extracting data out of the kernel memory space to make it available in user-space for analysis. The K42 project (Appavoo et al., 2002) used shared buffers between kernel and user space memory, which had obvious security issues. A provided daemon waked up periodically and emptied out the buffers where all client trace control had to go through. This project was a research prototype aimed at improving tracing performance. Usability and security was simply sacrificed for the proof of concept. For example, a traced application could write to these shared buffers and read or corrupt the tracing data for another application, belonging to another user.
At this point, we can see that a central tracing control daemon is often used to handle the tracing back-end and for security issues. It works basically as a rendez-vous point for the user and tracer to manage their interactions, and to isolate components from each other. In the next sections, recent open source tracers and how they built their tracing infras-tructure will be examined. Even though most of these are kernel tracers, some projects also mix user space tracing, bringing up new issues.
LTT and LTTng
If we look at the first Linux Trace Toolkit project (LTT)(Yaghmour et Dagenais, 2000), it was designed to help finding performance issues in fairly complex Linux systems, and provide users with a view of the system behaviour. A set of tools was offered to interact with the tracer, and a user space daemon for data extraction. No user space tracing was offered at that time. Therefore, we ended up with a very basic control, for only one user and one tracing source, the kernel.
Its successsor, LTTng (Desnoyers et Dagenais, 2006), was designed to offer kernel tracing with low latency, deterministic real-time impact, small impact on the operating system throughput and linear scalability with the number of cores (Desnoyers, 2009). It was a new and greatly improved system that made possible new tracing technology to be incorporated in the Linux kernel, such as immediate values and tracepoints(Desnoyers, 2009). Still, the goal was to address important performance needs. The same subset of tools as the LTT project were offered to the user space for tracing control and data extraction but, again, only privileged users can use it and a single tracing source is available.
One common aspect of those two tracers is that tracing data can be fetched through a character device, for LTT, and, for LTTng, a per stream file descriptor exposed through the debugfs filesystem. For LTTng, a central daemon polls on all stream file descriptors (which is a blocking state) and, when data is available, it is consumed by writing to trace files that can later be analysed. Tracer control is achieved through the debugfs filesystem by writing commands to the right file representing a tracer object (Ex: events, channel).
Note that security was never a prerequisite during development since the kernel is the only data source and privileged credentials are always needed. Multiple user sessions are not supported so only one privileged user could trace the kernel at once, which is not well suited for production. Furthermore, tracing control was not integrated between the LTTng kernel tracer and the LTTng user space tracer (UST), which reduced usability.
DTrace
Then, Sun Microsystems released, in 2005, DTrace(Cantrill et al., 2004) which offers the ability to dynamically instrument both user-level and kernel-level software. As part of a mass effort by Sun, a lot of tracepoints were added to the Solaris 10 kernel and user space applications. Projects like FreeBSD and NetBSD also ported dtrace to their platform, as later did Mac OS X. The goal was to help developers find serious performance problems. The intent was to deploy it across all Solaris servers and to use it in production.
probes used to gather tracing data and write it to memory buffers. The framework provides a user space library (libdtrace) which interacts with the tracer through ioctl system calls. Through those calls, the DTrace kernel framework returns specific crafted data for immediate analysis by the dtrace command line tool. Thus, every interaction with the DTrace tracer is made through the kernel, even user space tracing.
On a security aspect(Gregg et Mauro, 2011), groups were made available for different level of user privileges. You have to be in the dtrace proc group to trace your own applications and in the dtrace kernel group to trace the kernel. A third group, dtrace user, permits only system call tracing and profiling of the user own processes.
This work was an important step forward in managing tracing in current operating sys-tems in production environment. The choice of going through the kernel, even for user space tracing, is a performance trade-off between security and usability.
SystemTap
In early 2005, Red Hat released SystemTap (Prasad et al., 2005) which also offers dynamic instrumentation of the Linux kernel and user applications. In order to trace, the user needs to write scripts which are loaded in a tapset library. SystemTap then translates these in C code to create a kernel module. Once loaded, the module provides tracing data to user space for analysis.
Two system groups namely stapdev and stapusr are available to separate possible trac-ing actions. The stapdev group can do any action over Systemtap facilities, which makes it the administrative group for all tracing control (Don Domingo, 2010) and module creation. The second group, stapusr, can only load already compiled modules located in specific protected directories which only contain certified modules.
The project also provides a compile-server which listens for secure TCP/IP connections using SSL and handles module compilation requests from any certified client. This acts as a SystemTap central module registry to authenticate and validate kernel modules before loading them.
This has a very limited security scheme for two reasons. First, privileged rights are still needed for specific task like running the compilation server and loading the modules, since the tool provided by Systemtap is set with the setuid bit. Secondly, for user space tracing, only users in SystemTap’s group are able to trace their own application, which implies that a privileged user has to add individual users to at least the stapusr group at some point in time, creating important user management overhead.
It is worth noting that the compilation server acts mostly as a security barrier for kernel module control. However, like DTrace, the problem remains that it still relies on the kernel for
all tracing actions. Therefore, there is still a bottleneck on performance if we consider that a production system could have hundreds of instrumented applications tracing simultaneously. This back and forth in the kernel, for tracing control and data retrieval, cannot possibly scale well.
Perf and Ftrace
In 2008 came the kernel function tracer Ftrace designed by Steven Rostedt and Ingo Molnar, and targeting kernel developer’s needs. It offered new features, not in LTTng at the time, and a mainline Linux tracer more efficient than SystemTap (which as of today is still not in the mainline kernel).
Perf made by Ingo Molnar and Thomas Gleixner, which also came in 2008, brought performance counters access coupled with a tracer that uses the available kernel instrumen-tation.
Like the previous project, those tools are aimed at providing system data, with minimal impact on the operating system. Most of the time, the kernel is the target and all tracing facilities are inside it.
To use Ftrace, every interaction with it is done through the debugfs filesystem in /debug/tracing subdirectory. Commands are executed by changing values in files located in this directory. For instance, enabling the function tracer would be as follows:
# echo function >/debug/tracing/current_tracer # echo 1 >/debug/tracing/tracing_enabled
[actions]
# echo 0 >/debug/tracing/tracing_enabled
Looking at the traced data is done by reading the trace file for human-readable output. Files latency trace and trace pipe are also available from which the trace can be read, organized respectively by system latencies and to be piped in a command. A trace cmd command is available to make tracing easier and user friendly.
Perf is similar to ftrace, also using debugfs for trace output and command input. A perf command is available which helps on the usability side. Here is an example of how to start tracing kernel events:
# perf record -c 1 -a -e sched:sched_wakeup
Option ”-c 1” says to sample every event and ”-a” to enable system-wide tracing. This command records all sched wakeup events in the system.
However, the design does not support production infrastructure with unprivileged users accessing the data. Moreover, aggregating tracing data from multiple sources is not possible. Every command has to be done as root and cannot be executed otherwise.
UST
One of the first user space alternative to DTrace and SystemTap came in January 2010 with the first official release of the user space tracer (UST) made by Pierre-Marc Fournier at
´
Ecole Polytechnique de Montr´eal(Fournier et al., 2009). Largely based on the LTTng kernel tracer, the goal was to offer a framework for developers to add static tracepoints to their applications and be able to trace them exclusively in user space (not using the kernel or having privileged rights like in the previous projects).
This project was the starting baseline of this study. The tools provided were not address-ing production needs and security issues, thus makaddress-ing this tracer only used by developers. With an in-process library, this tracer brought new concepts to tracing and thus new chal-lenges to make an integration in a real world environment. Among these chalchal-lenges, is the multi-user aspect, handling tracing session on a per-user basis with multiple tracing sources. One major factor of scalability is the one daemon per process design. With large number of applications being traced on a system, this scheme can consume a lot of resources (memory and CPU), thus degrading the server performance. However, the advantages of this tracer is that everything is done in user land, thus eliminating the need for a kernel component, bringing higher performance versus Dtrace and SystemTap. UST uses RCU data structures for a completely lockless tracer.
2.2
Multi-user architecture
We have highlighted in the last section that user space tracing brought issues to the production environment concept. In order to propose a new tracing component, the next sections explore multi-user support in areas other than tracing, and how widely used appli-cations are dealing with it.
Through this research, we propose a new approach to tracing by combining kernel and user space tracing through one central component. As mentioned before, with user space tracing, systems can now have an large number of tracing sources in a multi-user environment. Knowing that, challenges arise on how can we manage a potentially large number of requests from users and applications to our central component by keeping it fast and efficient.
The following studied applications are routinely deployed across all types of servers and workloads and can manage numerous client requests to be served efficiently. They could
serve as an inspiration for a scalable tracing infrastructure and help us choose a design synchronization model.
2.2.1
Popular applications
Pulseaudio
Pulseaudio is a cross-platform networked sound server, commonly used on the Linux-based and FreeBSD operating systems (Wikipedia, 2011). It is the most widespread program in all Unix operating systems to manage sound I/O. Audio streams management, transport and composition has been a difficult problem with a large number of proposals through the years which failed to offer the desired scalability, performance and architectural soundness.
The pulseaudio daemon acts like a central rendez-vous point for all sound sources. It then reroute sound streams to the corresponding hardware or even over a network stack. Through a library layer, the pulseaudio server can be controlled from multiple applications and also acts as a sound system registry.
They extensively uses the POSIX thread library (pthread) for synchronization using mu-texes and conditions. They also use shared memory for sound buffer sharing and semaphores for sound stream synchronization. This particular design is very interesting from a multi-source point of view, where one main server handles multiple commands, taken from a user space library API, and reroutes requests and replies through the server. Depending on the sound sources, the right hardware is chosen.
The routing commands concept was used in our work to develop a new tracing component sending client requests to tracers (tracing sources). We also created a similar API to control the central daemon handling tracing sources (here sound streams). The whole idea of being a rendez-vous point for sound sources is one of the core foundation behind our work.
Memcached
Memcached is an interesting software to look at in terms of distributed client and concur-rent data access. Memcached is a high-performance, distributed caching system used to speed up applications by using unused memory across remote nodes (Fitzpatrick, 2004)(Petrovic, 2008). It uses a distributed hash table shared between nodes so that every change could be seen by every node. Keys in the global hash table represent memory segments that an application could request using the user-space API.
The basic tasks of memcached are:
– Manage memory allocation (malloc/free) – Keep track of BLOB stored in memory
– Serve client for memory requests
The interesting aspect here to consider for this study is the storage technique used and effiency at getting coherent data between nodes. Using hash tables makes searches in O(1) for every existing or non existing memory object lookup. Although our approach in this work is different, being not distributed, the concept of tracking memory and using hash tables is used for our purposes.
In terms of code and threading model, having thread workers handling client requests, since using TCP/IP sockets can be costly, is a nice model to consider.
Apache 2.2 Web Server
The Apache project came to life in 1995 (Fielding et Kaiser, 1997) and brought to the open source world one of the most powerful and widespread Web server. This software is currently used to handle most of the busy Web sites like Wikipedia.
Apache uses a thread pool scheme. It allocates resources for a fixed number of threads at startup, and dispatches requests among them. A process pool (workers) is created by the MPM module (multi-processing module) (Kew, 2007) to handle client requests. By looking at the dispatch mechanism, (i.e. how the main listener thread hands over a user request to a process in the pool), helped us design the main part of the lttng-tools project.
Basically, each worker waits on a global queue using the queue’s global lock (pthread mutex (Rochkind, 2004)) and reads from the socket when it is able to acquire the lock. Once the element is read (here a HTTP request), it is processed by the worker thread. After finishing the request, the worker thread requeues itself by trying to reacquire the lock. The contention is basically handled by the kernel and starvation is avoided since this queue basically acts as a FIFO mechanism.
Section 3.6 looks at the time taken by the process to settle the contention between all worker threads and compares it to the proposed lttng-tools dispatch mechanism.
This overview of these three multi-user infrastructure applications, extensively used on high end production servers, gives us a good idea on how we can achieve our goals efficiently.
CHAPTER 3
UNIFIED KERNEL/USER-SPACE
EFFICIENT LINUX TRACING
ARCHITECTURE
Authors
David Goulet <[email protected]>
´
Ecole Polytechnique de Montr´eal
Michel Dagenais<[email protected]>
´
Ecole Polytechnique de Montr´eal
Mathieu Desnoyers <mathieu.desnoyers@efficios.com>
EfficiOS Inc.
Submitted to Operating Systems Review (ACM) Categories and Subject Descriptors
D.2.5 [Software Engineering]: Testing and Debugging - Tracing D.4.8 [Operating Systems]: Performance - Operational analysis
Date: March 23, 2012 Status Under review
3.1
Abstract
As tracing becomes increasingly efficient, new applications are envisioned such as mon-itoring servers farms. When dealing with multiple tracing sources, from user to kernel space, a production grade architecture is needed to handle multi-user environments and se-curity concerns. This work aims at creating a unified tracing architecture, combining tracers functionalities under one umbrella. The objective is to provide good performance and low resource footprint. This model motivated the lttng-tools project, based on the LTTng 2.0 tracers, which implements the proposed architecture.
3.2
Introduction
Tracing is used on a daily basis in large data centres from small companies to large corporation like Ericsson and Google. It has proven that it is not only useful for debugging complex performance problems (Bligh et al., 2007) but people are looking at tracing as a new tool for monitoring the health of large computer clusters.
Bringing tracing into production systems involves multi-user environments. For instance, software developers using shared servers with different credential levels imply using a session mechanism in order to isolate these from each other. Furthermore, with user space tracing comes the aspect of multiple tracing sources, where a large number of tracers (e.g. traced applications) can be running at the same time and controlled by different users. Security is an important factor addressed with sessions at two levels: tracer access control, and reliable tracing control.
This paper presents a new unified infrastructure to trace multiple sources (kernel and applications). This infrastructure addresses multi-user and security constraints. Moreover, it keeps the low-intrusiveness and efficiency properties that modern tracers offer. By unify-ing tracer control, we proposed new tracunify-ing components which act as a rendez-vous point, handling data consumption and interactions between users and tracers.
To achieve this, we propose a new tracing architecture, suited for production environment, unifying kernel and user space tracing. The results of our study, based on the LTTng 2.0 tracer1, resulted in the lttng-tools project.
In the next section, we present the existing work on tracing infrastructure from the design point of view. We also outline known multi-user multithreaded applications like Apache (Fielding et Kaiser, 1997) which address similar performance and efficiency concerns in a multi-user context. The following section 3.4 explains the design requirements for our architecture.
In section 3.5, we present our solution based on the aforementioned design requirements. This model was implemented in the lttng-tools project and now provides a new set of features. In section 3.6 experimental results are presented and demonstrate the performance and correctness of the proposed architecture and synchronization algorithms. We then con-clude this research, briefly discussing areas for improvement.
3.3
State of the Art
This paper proposes a new tracing component not found in existing tracing solutions, as detailed in this section. For this reason, efficient multi-user infrastructure applications in areas other than tracing were also examined, to study how they handle multiple requests from clients and scale on multi-processor systems.
3.3.1
Tracing infrastructure
The first section gives an overview of current software tracing systems and the design choices they made.
Sun Microsystems released, in 2005, DTrace (Cantrill et al., 2004) which offers the ability to dynamically instrument both user-level and kernel-level software. As part of a mass effort by Sun, numerous tracepoints were added to the Solaris 10 kernel and user space applications. Projects like FreeBSD and NetBSD also ported dtrace to their platform, as later did Mac OS X. The goal was to help developers find serious performance problems. The intent was to deploy it across all Solaris servers, to be used in production.
If we look at the DTrace architecture, it uses multiple data providers, which are probes used to gather tracing data and write it to memory buffers. The framework provides a user space library (libdtrace) which interacts with the tracer through ioctl system calls. Through those calls, the DTrace kernel framework returns specific crafted data for immediate analysis by the dtrace command line tool. Every interaction with the DTrace tracer is through the kernel, even for user space tracing. This creates an important bottleneck since the kernel handles every tracing source, slowing concurrent user space tracing.
On a security aspect (Gregg et Mauro, 2011), groups are available for different levels of user privileges. You have to be in the dtrace proc group to trace your own applications and in the dtrace kernel group to trace the kernel. A third group, dtrace user, permits only syscall tracing and profiling of the user’s own processes. This concept of tracing roles sepa-ration is good for dealing with credentials sepasepa-ration and not force users to have privileged rights (root).
In early 2005, Red Hat released SystemTap (Prasad et al., 2005) which also offers dynamic instrumentation of the Linux kernel and user applications. In order to trace, the user needs to write scripts which are loaded in a tapset library. SystemTap then translates these in C code to create a kernel module. Once loaded, the module provides tracing data to user space for analysis.
Two system groups, namely stapdev and stapusr, are available to separate possible tracing actions. The stapdev group can do any action over Systemtap facilities, making it
the administrative group for all tracing control (Don Domingo, 2010) and module creation. The second group, stapusr, can only load already compiled modules, located in specific protected directories which only contain certified modules.
The project also provides a compilation server, listening for secure TCP/IP connections using SSL and handling module compilation requests from any certified client. This acts as a SystemTap module central registry to authenticate and validate kernel modules before loading them.
This constitutes a very limited security scheme for two reasons. First, privileged rights are still needed for specific tasks like running the compilation server and loading the modules, since the tool provided by Systemtap is set with the setuid bit. Secondly, for user space tracing, only users in SystemTap’s group are able to trace their own application, which implies that a privileged user has to add individual users to at least the stapusr group at some point in time, creating important user management overhead.
It is worth noting that the compilation server acts mostly as a security barrier for kernel module control. However, like DTrace, the problem remains that it still relies on the kernel for all tracing actions. Thus, there is still a bottleneck on performance if we consider that a production system could have hundreds of instrumented applications tracing simultaneously. Transitioning back and forth in the kernel for tracing control and data retrieval cannot pos-sibly scale well.
Linux tracing is designed to be extremely efficient. Yet, until now, no existing solution provides good performance and security to handle tracing in a multi-user environment with multiple tracing sources.
3.3.2
Multi-user multithreaded application
Throughout this research, a main focus is to handle not only many users but also many tracing sources. The memcached and Apache project are two widespread applications that efficiently address these security and multi-user requirements.
This work proposes a new approach to tracing by combining kernel and user space tracing through one central component. As mentioned before, with user space tracing, a system can now have a large number of tracing sources in a multi-user environment. Knowing that, challenges arise on how can we manage a potentially large number of requests from users and applications to our central component by keeping it fast and efficient. Studying the following applications helped design our new architecture and algorithms for synchronization in a multithreaded environment.
Memcached
Memcached is a very interesting system to look at in terms of distributed client and concurrent data access. It is a high-performance, distributed caching system, used to speed up applications by using unused memory across remote nodes (Fitzpatrick, 2004) (Petrovic, 2008). It uses a distributed hash table shared between nodes so every change could be seen by every node. Keys in the global hash table represent memory segments that an application could request using the user space API.
The basic tasks of memcached are:
– Manage memory allocation (malloc/free) – Keep track of BLOB stored in memory – Serve clients for memory requests
Interesting aspects to considered for this study are the storage technique used and effi-ciency at getting coherent data between nodes. Using hash tables enables searches in O(1) for every existing or non existing memory object lookup.
Moreover, the client request handling threading model is based on libevent2 which
passes every new connection to a thread pool on a round-robin basis. However, to access the main hash table, a global lock is still needed, creating an important contention between requests.
Apache 2.2 Web Server
The Apache project started in 1995 (Fielding et Kaiser, 1997) and brought to the open source world one of the most powerful and widespread Web server. It is used to handle several of the busiest Web sites like Wikipedia.
Apache uses a thread pool scheme. It allocates resources for a fixed number of threads at startup, and dispatches requests among them. A process pool (workers) is created by the MPM module (multi-processing module) (Kew, 2007) to handle client requests. Looking at the dispatching mechanism, i.e. how the main listener thread hands over a user request to a process in the pool, helped us design the main part of the lttng-tools project.
Each worker waits on a global queue using the queue’s global lock (pthread mutex (Rochkind, 2004)) and reads from the socket when it is able to acquire the lock. Once the element is read (here a HTTP request), it is processed by the worker thread. After finishing the request, the worker thread requeues itself by trying to reacquire the lock. The contention is handled by the kernel and starvation is avoided since this queue essentially acts as a FIFO mechanism.
Section 3.6 looks at the time taken by the process to settle the contention between all worker threads, and compares it to the lttng-tools dispatching mechanism.
This overview of these multi-user infrastructure applications, extensively used on high end production servers, gives us a good idea on how we can achieve our goals efficiently.
3.3.3
Synchronization
Multithreaded applications come with important synchronization challenges. The key goal of our proposed architecture is to optimise the performance. A lockless scheme was devised using RCU technology (McKenney et Walpole, 2007) – a synchronization mecha-nism allowing reads to occur concurrently with updates. RCU enables concurrent access to data structures without locks for one updater and multiple readers. It differs from locking primitives that ensure mutual exclusion between threads, or reader-writer locks which allow concurrent reads but not during updates.
The basic idea is that updates are atomic, even for complex structures. A pointer to the complex structure is atomically replaced by another pointer to a fresh updated copy of the structure. Thus, while updating is protected by locks, reads can happen concurrently with updates and other reads. The tricky part in RCU algorithms is to determine when the previous version of the updated structure can be released, all concurrent reads accessing that version being terminated.
The user space RCU library (Desnoyers et al., 2010) provides a wide variety of lockless data structures, from linked lists to red-black trees. They were used extensively for the synchronization model of our proposed tracing rendez-vous point.
3.4
Design Requirements
This research is in part intended to meet the requirements set by industry partners such as Ericsson and Revolution Linux who helped define the missing parts of today’s tracing architecture. Four requirements were identified and are an important focus of this work.
1. Multi-user 2. Security 3. Performance 4. Reliability
Deployed servers support many users with different security rights and are often managed through a central directory (Ex: LDAP). For thin clients deployed by Revolution Linux3, tracing cannot be deployed unless the multi-user constraint is addressed. Since we are dealing with multiple tracing sources, it becomes important that users do not interfere with each other. Hence a separation is needed in terms of data coherency and security.
The next key point to consider is security. Again, multiple users means different access levels, where everyone is not a privileged user. Tracing data from critical applications, for example banking software and sensitive databases, should not be accessible by unprivileged users for obvious reasons.
Furthermore, there is the question of trace data protection and integrity to consider. For-tunately, the tracer itself can guarantee the correctness of data written to buffers. However, unifying tracers implies aggregating tracing sources, so care is needed for managing those traces beyond the tracer lifetime.
Production servers should not suffer performance issues from tracing and it should scale throughout hardware and software upgrades (e.g. adding more cores).
Tracers usually outsource the extraction of recorded data from buffers to disk using a separate user space process. Indeed, LTT (Yaghmour et Dagenais, 2000), LTTng (Desnoyers et Dagenais, 2006), SystemTap (Prasad et al., 2005) and DTrace (Cantrill et al., 2004) all use kernel IPC (Love, 2010) mechanisms to notify a user space daemon to consume buffers. On large server farms, the scalability of the data retrieval and analysis infrastructure is a concern.
Different types of efficient data transport, subject to security constraints (integrity and protection), were examined during the architectural design. For instance, the types of trans-port investigated are network streaming (using either UDP or TCP), local device writing, secure communication layer like SSH protocol (Ylonen et al., 2006) or memory caching (flight recorder).
Finally, a separation between the control and data path, for the telecommunication in-dustry, is very important to ensure reliability of their software and hardware. One failing should not cause the other one to stop.
3.5
Unified tracing architecture
One of the main problems faced throughout this research, encountered during the design phase of lttng-tools, is how to integrate all tracing components and create a rendez-vous point for all tracing activities, while addressing the previous considerations.
With a set of design goals and use cases to address, this section explains in detail the work done to design an efficient tracing infrastructure. This resulted in the lttng-tools project, based on the LTTng tracer family (Desnoyers et Dagenais, 2006) (Desnoyers, 2012), an important benefit of this research to the tracing and open source communities.
The lttng-tools project regroups three components which now allow large scale de-ployment of applications instrumented with the LTTng user space tracer alongside with the kernel tracer. Figure 3.1 shows the global architecture model and the three components being the lttng CLI, consumer daemons and session daemon.
Figure 3.1 Architecture
The lttng command line interface is a small program used to interact with the session daemon. Possible interaction are creating sessions, enabling events, starting tracing and so on (Goulet, 2012). For more information, look at appendix D.
The session daemon is the new main component proposed in this work and is the central point handling tracers and users. Tracing sessions are used to isolate users from each other and create coherent tracing data between all tracing sources (Ex: MariaDB vs Kernel). This daemon routes user commands to the tracers and keeps an internal state of the requested actions. The daemon makes sure that this internal state is in complete synchronization with the tracers, and therefore no direct communication with the tracers is allowed other than via the session daemon.
This daemon is self-contained between users. Each user can run its own session daemon but only one is allowed per user. No communication happens between daemons. Section 3.5.2 explains this separation.
Consumer daemons extract data from buffers containing recorded data and write it to disk for later analysis. There are two separate consumer daemons, one handling user space and the second one the kernel. A single consumer daemon handles all the user space (and similarly for kernel space) tracing sessions for a given session daemon. It is the session daemon that initiates the execution of the user space and kernel consumer daemons and feeds them with tracing commands. The session daemon implements our proposed architecture.
For illustration purposes, here is a small example on how you start tracing the kernel using this new architecture.
# lttng create mysession
# lttng enable-event sched_switch --kernel # lttng start
...
# lttng stop
First, a session is created using the lttng command line interface which send command to the session daemon. We then enable the event sched switch for the kernel domain (– kernel). So, the daemon receives the command, maintain an internal state for the session and finally enables the event on the tracer. Following this, the start action basically spawn the kernel consumer and start tracing for every session. Upon the stop command, the consumer stays alive but the tracer stops recording data.
The next section describes important tracing concepts for the global understanding of the model. The following section presents the session daemon internal algorithms, key to its efficiency.
3.5.1
Tracing concepts
One of the goals of the lttng-tools project is to bring LTTng’s tracers under one umbrella and creating an abstraction layer between the user and the tracers, hence the importance of the rendez-vous point concept.
Domains
First, we introduce the notion of tracing domains which is essentially, a type of tracer or tracer/feature tuple. We currently implement two domains in lttng-tools:
– UST
Global user space domain. Channels and events registered in that domain are enabled on all current and future registered user space applications.
– KERNEL
Three more domains are not yet implemented but are good examples of the tracer/feature concept. They are UST PID for specific PID tracing, UST EXEC NAME based on application name and UST PID FOLLOW CHILDREN which is the same as tracing a PID but follows spawned children.
Session
One of the key new features is the concept of tracing session. It is an isolated container used to separate tracing sources and users from each other. It takes advantage of the session feature offered by the tracer.
Each tracing session has a human readable name (Ex.: myapps) and a directory path where all trace data is written. It also contains the user UID/GID, in order to handle permissions on the trace data and also determine who can interact with it. We use credentials passing through UNIX socket (Rochkind, 2004) (Linux, 2008) for that purpose.
More importantly, it has pointers to each possible tracer session (kernel and user space). Each of them contains the list of domains which contain a list of channels. Appendix A shows the code snippet for the tracing session data structure.
Event
In earlier LTTng tracers (version 0.x) (Desnoyers et Dagenais, 2006), the term tracepoint was used and represented a probe in the code recording information. Here, to abstract different domains, the term event is used which relates to a TRACE EVENT statement in your application code or in the Linux kernel instrumentation.
Using the command line tool lttng D, you can enable and disable events for a specific tracing session on a per domain basis. An event is always bound to a channel and associated tracing context (Desnoyers, 2012).
Channel
Channels existed in the earlier LTTng tracers but were hardcoded and specified by the tracer. In the new LTTng 2.0 version, channels are now definable by the user and completely customizable (size of buffers, number of subbuffer, read timer, etc.).
A channel contains a list of user specified events (e.g. system calls and scheduling switches) and context information (e.g. process id and priority). Channels are created on a per domain basis, thus each domain contains a list of channels that the user creates.
Each event type in a session can belong to a single channel. For example, if event A is enabled in channel 1, it cannot be enabled in channel 2. However, event A can be enabled in channel 2 (or channel 1 but not both) of another session.
3.5.2
Session daemon
The session daemon handles all interactions between the users, consumers and tracers. Here is the list of the daemon’s roles. Each role is explained in depth to illustrate how are satisfied the requirements exposed in section 3.3.
– Rendez-vous point:
Handles user, consumer and tracer interactions, being the synchronization component across the tracing toolchain.
– Act as a tracing registry:
1. User space tracer registration (application register) 2. Tracing sessions management (user command)
Unlike the DPCL(Pase, 1998) project using a super daemon, our session daemons coexist and act independently, never exchanging data, managing their instrumented applications with the same credentials and handling their own consumers.
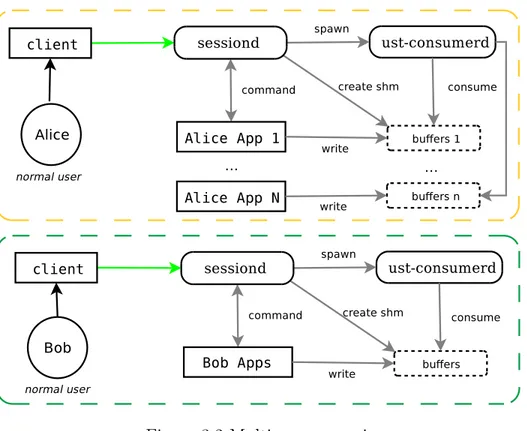
It is possible for multiple users to run a session daemon at the same time on the same machine. Figure 3.2 shows the interaction between all the components in a multi-user envi-ronment. It should be noted that the two session daemons of the figure never communicate. Such separation is crucial for usability. It allows any user to compile its own session dae-mon, run it and be able to trace his or her applications independently. Having two session daemons communicating would be useless since the information of another user is irrelevant. Section 3.5.2 explains the efficient mechanism behind applications and tracing sessions management.
For kernel tracing, the session daemon must run with privileged credentials (UID = 0). For obvious security reasons, only allowed users can gather kernel traces. A tracing group is defined, similar to SystemTap groups (Prasad et al., 2005), where everyone in that group can communicate with the session daemon running as root. This is achieved by using Unix sockets (Rochkind, 2004) and having read and write permissions for the tracing group.
In summary, the session daemon grants access to tracing resources by running under various credentials and allowing interactions only from users who possess enough rights to do so. Unprivileged users cannot access other user’s traces and only allowed users can control the kernel tracer. Moreover, the rendez-vous point concept allows it to provide a
Figure 3.2 Multi-user scenario
new set of features that tracers themselves cannot provide such as application registration, and synchronization of every tracer available on the system.
The next two sections explains the user and kernel space tracer interactions with the session daemon, looking in depth at application registration and kernel features. Following this, the tracing registry, the core of the session daemon, is described.
Kernel tracer
While the kernel tracer is the most complex entity in terms of code and algorithms, it is the simplest to handle. For the session daemon, this tracer is a single tracing source. You cannot have two kernels running concurrently, as opposed to user space tracers where multiple instrumented applications provide multiple tracing sources.
Managing the kernel tracer requires a different approach from user space tracing. The traced data is entirely controlled by the kernel. For security reasons, we can assume that they are not directly accessible by user space, at least not writable. As we saw in previous projects (Desnoyers et Dagenais, 2006) (Yaghmour et Dagenais, 2000) (Prasad et al., 2005), the kernel exposes a transport pipeline (Ex: character device or anonymous file descriptor) and a user space daemon simply extracts data through this mechanism.
project implemented a separate consumer for the kernel tracer. It is spawned and updated by the session daemon. At startup, the session daemon loads every LTTng kernel module and opens file /proc/lttng for upcoming interactions. As mention earlier, only a privileged session daemon can communicate with the kernel tracer, and only users in the tracing group can interact with it.
One specific feature of the kernel tracer is CPU hotplug. It is explained in section 3.5.2. The kernel notifications are handled by a thread that polls the kernel file descriptor notifies the consumer of the newly created per-cpu channel to consume.
User-space tracer
The user space tracer brings the possibility of multiple concurrent tracing sources. With the LTTng 2.0 UST tracer, instrumented applications register with the session daemon at the beginning of their execution.
Since the tracer functionality relies on a running session daemon, the registration mech-anism is crucial and, thus, has to be very efficient. Two challenging situations occur, where the session daemon is either running or not running. The most important premise is that the application runtime behaviour should not be altered by the user space tracer waiting for the session daemon. Thus, the user space tracer needs to follow this algorithm in a separate thread, since condition at line 1 might not be satisfied at first:
Require: New process (thread)
1: if connect succeed then
2: register
3: receive possible command(s)
4: begin normal program execution
5: else
6: begin normal program execution
7: wait for notification (passive blocking)
8: end if
Line 1 tests the condition by connecting to the session daemon application socket. On success, the application sends basic information used by the application registry 3.5.2 on line 3. Then, it waits for commands (Ex: create session, enabling events, etc.) and finally begins the normal execution of the program (C main()).
On connection failure, we immediately begin the program execution since we cannot wait for an unknown period of time. Finally, on line 7, we wait for notification, which is the more
complex part.
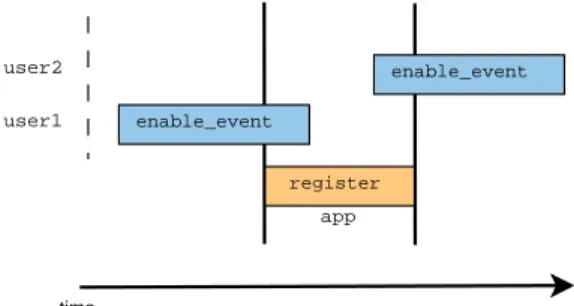
Figure 3.3 shows the three possible scenarios for the session daemon notification process. Three applications begin waiting respectively before, during and after the notify (wake) of the session daemon which indicates that it is ready to receive registration.
App1 and app3 are clearly able to register since the state of the wake is not racing with the wait process and the registration. However, app2 is a more problematic case which requires careful synchronization in order to avoid starvation on the tracer side and the possible wait/wake race shown in figure 3.4. This model is based on the fact that there are n > 0 wait processes and 1 waker.
Figure 3.3 UST registration synchronization
Figure 3.4 UST registration wait/wake race
This issue shows that a shared IPC is needed as a way to synchronize applications and a session daemon. A persistent memory location with the session daemon state (flag) is needed to ensure coherent state over time for all user space tracers. Commonly, this is called a semaphore (Abraham Silberschatz et Gagne, 2008) and we use it to synchronize processes. We elected to use a shared memory area (SHM) (Manpages, 2008) where we put the semaphore. The second important consideration is that if no session daemon is available,
the user space tracer should wait passively in a separate thread, hence not altering the execution behaviour of the application. A futex object (Drepper, 2011) was chosen.
A futex() system call provides a way for a program to wait passively on a value at a given address. It can also use a method to wake anyone waiting on that value. This mechanism is typically used to implement locking scheme in a shared memory area. Thus, it provides a passive blocking call for the session daemon state variable and the contention dealt by the kernel.
Overall, there are two critical concepts for the wait/wake scheme:
1. Persistent memory area with a state flag (using a semaphore) 2. Waiting has to be passive (no CPU usage)
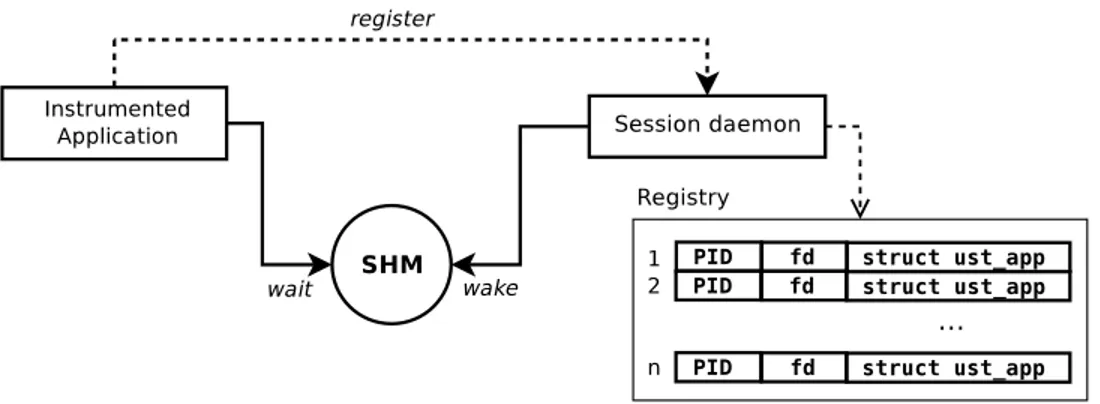
Figure 3.5 illustrates the data flow between the application and the tracer at this stage. The SHM area is created either by the user space tracer or the session daemon, whoever comes first, at a hardcoded path, and contains a futex object used to wake every process waiting on it.
The user space tracer waits on the futex and the session daemon, once spawned and ready for registration, notifies all waiting applications by atomically setting the state flag and waking the futex (FUTEX WAKE).
After this notification, instrumented applications register to the session daemon. At any point in time, if the session daemon dies, the same process is done all over again. The user space tracer returns waiting on the global futex which is reset atomically by the session daemon when quitting. If an application cannot connect to a daemon and the state of the flag indicates to register, the application will reset it.
There is a potential race at the user space level when two applications try to create the SHM area. The kernel ensures (Love, 2010) that only one shared memory segment is created with the same path, so if one creation fails with an already exist error message, the user space tracer retries immediately to wait on the futex.
This design is important because it avoids starvation on the tracer side by using futex synchronization. The tracer is either waiting or registering. There is absolutely no window where it could wait forever. It would be unacceptable for an instrumented application to never register hence not be traceable. Moreover, this registration phase is only done once and before the main() of the application is called. Little extra time is added to the program execution 3.6.
Figure 3.5 shows that once the session daemon wakes the futex, all applications, which can be numerous, immediately try to register by connecting to a socket (ust sock) created by
Figure 3.5 User space tracer registration
the session daemon and sending the registration data. The kernel allows us to queue multiple requests for connections with the listen() syscall. However, once accepted, handling the registration should be very fast.
Figure 3.6 illustrate the detailed scheme used to dispatch a registration to a thread pool without locks. Once the instrumented application sends its information, it is immediately enqueued in a wait-free queue provided by the URCU library (Desnoyers et al., 2010) and the next registration waiting on the socket can be handled. The dispatcher thread is the next step.
The dispatch thread is using the dequeue blocking call of the wait-free queue and, once the node is popped, it is written on a pipe (Rochkind, 2004) (a fast data IPC available for Linux, see section 3.6 for detailed benchmark). There is one pipe per thread in the thread pool and the dispatcher is going in a round-robin to assign the request to a thread. The registration request is the same size and time regardless of the application so the dispatch policy is pretty simple. Once the registration is completed, i.e. adding an entry in the lockless registry 3.5.2, a registration done packet is sent back and the socket is kept open and used for later commands.
This socket is added to a central application management thread which polls every user space socket and monitors events. This is how the session daemon can detect an unregister-ation. If the socket is closed on the application side, the session daemon picks it and handles the cleanup. This mechanism is particularly interesting for two reasons.
First, for any application dying unexpectedly, for instance a segmentation fault, the kernel closes the socket automatically so the in-process library (tracer) does not have to notify the session daemon (and in this example won’t be able to do so anyway).
Secondly, command synchronization is based on the availability of the socket. Any com-mand failing on the user space tracer (with a write error on the socket) automatically cleans
Figure 3.6 Session lock with the lockless hash table issue
up the application session registry of newly created data structure protected by RCU mech-anisms. It is however very important to close the socket on the session daemon side after releasing application and registry data structure memory, or else an application could regis-ter during that time, and the socket number be reused. This would create incoherent data in the registry having a session assigned to the application but non existent in the tracer.
By monitoring this socket, we are able to remove synchronization primitives between the user and the tracer since it is correct, by design, for the command to fail on the tracer side, even if the data is coherent on the session daemon.
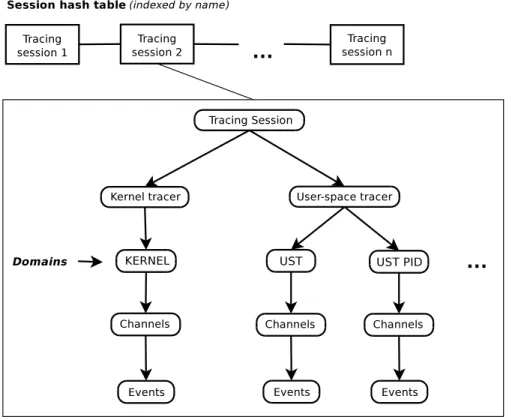
Tracing registry
The tracing registry stores tracing sessions and application information using lockless data structures. Figure 3.7 is a representation of the registry tree for tracing session objects 3.5.1.
A tracing session contains two tracer types, the first level nodes of the registry hierarchy, with the tracing session itself being the root node. Those nodes contain per domain channel hash tables. For example, the UST PID domain is a hash table indexed by PID and each bucket contains a hash table of channels. The UST and KERNEL domains are actually a single