HAL Id: hal-02971538
https://hal.archives-ouvertes.fr/hal-02971538
Submitted on 26 May 2021
HAL is a multi-disciplinary open access
archive for the deposit and dissemination of
sci-entific research documents, whether they are
pub-lished or not. The documents may come from
teaching and research institutions in France or
abroad, or from public or private research centers.
L’archive ouverte pluridisciplinaire HAL, est
destinée au dépôt et à la diffusion de documents
scientifiques de niveau recherche, publiés ou non,
émanant des établissements d’enseignement et de
recherche français ou étrangers, des laboratoires
publics ou privés.
Perceptual Characterization of 3D Graphical Contents
based on Attention Complexity Measures
Mona Abid, Matthieu Perreira, Patrick Le Callet
To cite this version:
Mona Abid, Matthieu Perreira, Patrick Le Callet. Perceptual Characterization of 3D Graphical
Con-tents based on Attention Complexity Measures. MM ’20: The 28th ACM International Conference
on Multimedia, Oct 2020, Seattle WA USA, United States. pp.31-36, �10.1145/3423328.3423498�.
�hal-02971538�
Perceptual Characterization of 3D Graphical Contents
based on Attention Complexity Measures
Mona Abid
Univ. Nantes, LS2N, CNRS Nantes, France [email protected]
Matthieu Perreira Da Silva
Univ. Nantes, LS2N, CNRS Nantes, France [email protected]
Patrick Le Callet
Univ. Nantes, LS2N, CNRS Nantes, France [email protected]ABSTRACT
This paper provides insights on how to perceptually characterize colored 3D Graphical Contents (3DGC). In this study, pre-defined viewpoints were considered to render static graphical objects. For perceptual characterization, we used visual attention complex-ity (VAC) measures. Considering a view-based approach to exploit the perceived information, an eye-tracking experiment was con-ducted using colored graphical objects.
Based on the collected gaze data, we revised the VAC measure, suggested in 2D imaging context, and adapted it to 3DGC. We also provided an objective predictor that highly mimics the experimen-tal attentional complexity information. This predictor can be useful in Quality of Experience (QoE) studies: to balance content selection when benchmarking 3DGC processing techniques (e.g., rendering, coding, streaming, etc.) for human panel studies or ad hoc key performance indicator, and also to optimize the user’s QoE when rendering such contents.
CCS CONCEPTS
• Computing methodologies → Perception; Interest point and salient region detections.
KEYWORDS
Attentional complexity; 3D graphical objects; content characteriza-tion; visual attention
ACM Reference Format:
Mona Abid, Matthieu Perreira Da Silva, and Patrick Le Callet. 2020. Percep-tual Characterization of 3D Graphical Contents based on Attention Com-plexity Measures. In 1st Workshop on Quality of Experience (QoE) in Visual Multimedia Applications (QoEVMA’20), October 16, 2020, Seattle, WA, USA. ACM, New York, NY, USA, 6 pages. https://doi.org/10.1145/3423328.3423498
Publication rights licensed to ACM. ACM acknowledges that this contribution was authored or co-authored by an employee, contractor or affiliate of a national govern-ment. As such, the Government retains a nonexclusive, royalty-free right to publish or reproduce this article, or to allow others to do so, for Government purposes only. QoEVMA’20, October 16, 2020, Seattle, WA, USA
© 2020 Copyright held by the owner/author(s). Publication rights licensed to ACM. ACM ISBN 978-1-4503-8158-1/20/10. . . $15.00
https://doi.org/10.1145/3423328.3423498
1
INTRODUCTION
Three-dimensional graphics are commonplace in applications such as digital entertainment, cultural heritage and architecture simu-lation. These data are increasingly rich and detailed; containing geometric primitives, enriched with various appearance attributes such as texture maps designed to produce a realistic material ap-pearance. While interacting with 3D Graphical Contents (3DGC) is possible, one should notice that visual characteristics, as well as visual interest, might change along with the viewpoint from which colored graphics are rendered. Figure 1 illustrates the ren-dering of two graphical objects under a predefined fixed viewpoints. With novel multimedia technologies and optimized 3D mod-elling tools (e.g., Unity3D, Unreal Engine, Maya, Blender, etc), we can construct and design high-resolution 3DGCs. Interacting with 3DGC represents a further step towards immersion [10]. Appropri-ate content characterization is crucial in order to design relevant subjective visual quality tests and evaluate algorithms that impact human visual attention when perceiving colored 3D objects. Despite its importance, when building a dataset, content selection has been often done based on convenience or content availability [8]. This is partly due to the lack of clear and straightforward guide-lines for appropriate content characterization and selection. Assuming that users are able to interact with the 3D objects, what they perceive during 3DGC visualization has an important impact on the way they interact with such objects [2]. Among used tools for 3DGC characterization, geometric features are commonly used [22, 23, 27]. It is however important to also take into account the perceived elements of 3D objects and not be limited by the geomet-rical characterization and intrinsic object representation in order to conduct relevant studies.
Visual content characterization can be based on the way the content is generated (e.g., synthetic vs. natural), its technical prop-erties (e.g., duration, resolution, frame rate, etc.), and its semantic category (e.g., sports, news, movies, etc.). Ad hoc measures have been suggested and used for various Quality of Experience (QoE) use cases: spatial and temporal complexity of a 2D video sequence [21], colorfulness of the visual information [9], depth features [29] and disparity [16] for stereoscopic 3D video, dynamic range fea-tures or gamut characterisation for HDR [20] and wide color gamut contents [18].
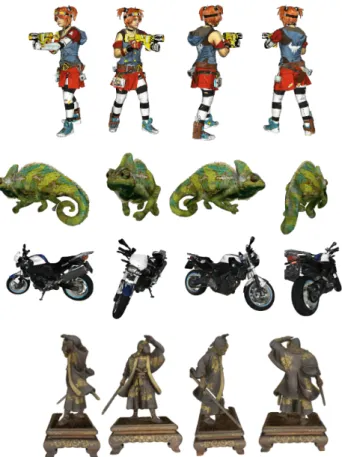
Figure 1:Illustration of the pre-defined viewpoints of two 3DGC from our dataset.
In this study, we focus on visual patterns to characterize the graphical contents.
Particularly crucial to our understanding is the measurement of Visual Attention Complexity (VAC). The VAC concept has been de-fined as a proxy for the variation in human gaze fixation or measure observers’ agreements for 2D content [15, 30]. It is supposed to re-flect how contents catch observers’ visual attention, distinguishing for example "exploratory" from "focused" contents.
We defined the VAC indicator at view-grain level, offering 3DGCs the possibility to measure the VAC along with different views. Such design was motivated by two use cases in mind:
- Providing criterion of 3DGC selection when building datasets for QoE subjective experimental studies and 3D processing algorithms evaluation .
- Enabling the application of adequate viewpoint-wise simplification strategies, thus ensuring a pleasant QoE during content rendering.
In this work, two research questions are addressed:
1. How can graphical objects be characterized based on attentional complexity measurement?
2. Can visual attention models be used to predict the attentional complexity of 3DGC?
In order to answer these two questions, we ran an eye-tracking ex-periment and used the collected data to evaluate VAC measures and
visual attention models ability to predict such measure. Next sec-tion presents our proposal of a visual attensec-tion complexity measure adapted to 3DGC.
2
PROPOSED METHOD
2.1
Characterization based on visual attention
patterns
When interaction with 3DGCs is possible, users are able to get around within the environment in order to obtain different views of the scene. This process of getting around a virtual environment while keeping track of one’s moves is often referred to by naviga-tion and camera/viewpoint control. There are several challenges faced when developing an effective technique for navigation for interactive 3D environments [10] such as viewpoint control in the context of free viewing task as well as technological constraints among which change of FoV and ensuring an optimal quality of rendered views.3DGCs could be rendered under various viewpoints as long as the user is moving through an environment.
In litterature, we distinguish four types of viewpoint movement for interactive 3D workspaces [19]: General movement, Targeted movement, Specified coordinate movement, and Specified trajec-tory movement. The latter is a movement along a position and orientation trajectory, such as a cinematographic camera move-ment, unlike the other techniques where users are free to navigate and explore. Specified trajectory movement category empowers the author to bring structure to the conducted subjective experience [10]. Although viewpoint control limits the user’s freedom while navigating through a virtual environment, it ensures the repro-ducibility of the subjective experiment, empowers the choice of relevant viewpoints of the scene.
Viewpoints are usually static - a viewpoint is simply a specific camera position and orientation defined by a pair of x, y, z coordi-nates, that is, a specific view of a 3D scene.
In this work, we adopt a view-based approach to characterize col-ored 3DGC based on the perceived information. We considered a constrained navigation as detailed: For a given graphical object, four plausible viewpoints (examples on figure 1) have been gen-erated corresponding to the 4 faces of a cube when the object is in its center. By rendering a view of the virtual 3D scene from a particular viewpoint, a 2D image can be shown on the display. Having four viewpoints of a given 3D object, we designed an eye-tracking experiment that enables us to evaluate the disparity of saliency once human gaze data collected. Note that visual saliency information represents the density probability of gazing at a given pixel in a given image [12].
2.2
Eye-tracking experiment - data collection
To compute VAC-3DGC, we need saliency information associated to the rendered 3DGC. However, in the context of colored 3D graphics, there are very few available datasets. The lack of such 3D datasets is an additional obstacle in investigating saliency prediction mech-anisms for colored 3D graphical contents.
In this work, we contributed to the field by conducting an eye-tracking experiment on colored 3DGCs rendered under pre-defined viewpoints.
2.2.1 Dataset - Stimuli generation. We selected twenty-one high-resolution colored 3D graphical objects that belong to four different semantic categories (human/character, animal, statue, object) and have different shapes (number of visible point clouds/meshes per viewpoint, occupancy of the object both horizontally, vertically, etc) and different colors (Monocolor, warm cool and dull colors). The number of vertices of these models are in range [250k, 600k]. Figure 1 shows two graphical objects belonging to two different semantic categories.
More details about the dataset could be found here1.
The visible surface of a 3D object changes along with the view-point from which the 3D object is rendered [28]. This leads to a different visual information depending on the visible side of the 3D object. Based on the constrained navigation defined earlier, virtual cameras were placed around the 3D object every 90 degrees at the equator. We therefore obtain 21 × 4 = 84 rendered images from the selected 3D graphical objects.
2.2.2 Apparatus & protocol design. Materials and apparatus To build the eye-tracking dataset, EyeLink 1000 Plus2device was used in remote mode (i.e. head free-to-move). It allows binocular tracking with a spatial accuracy between 0.25 and 0.50 degrees of visual angle. A computer monitor display with full HD resolution (1920 x 1080) was used as an experimental display. It was placed at a distance of approximately 110 cm from the observer’s eyes. In line with literature recommendation [4], the visual angle in each dimension is equal to 64𝑝𝑥/𝑑𝑒𝑔𝑟𝑒𝑒 in our experimental settings. The display resolution is about 30 × 17 visual degrees.
Participants We recruited 23 male and 11 female participants who were naive to eye-tracking experiments. The 34 participants had normal/corrected-to-normal vision with no color blindness issues.
Methodology The conducted eye-tracking experiment consists on free-viewing task. Participants were asked to look freely to the rendered views without any specific task.
In remote tracking mode, a target sticker is put on the forehead of the participants so that head movements can be compensated during tracking. Stimuli were displayed on a monitor with a refresh rate of 60𝐻𝑧. The distance between the observer and the experi-mental display which is a computer monitor display with full HD resolution (1920 x 1080) was approximately 110 cm. This distance was defined in such a way as to guarantee an accurate recording
1https://gitlab.univ-nantes.fr/E18E421U/3dgc-dataset 2https://www.sr-research.com/
while also ensuring comfortable viewing for the observer1. The total time of the experiment was 15 minutes including vision check, calibration and 21 x 4 = 84 stimuli visualization during 3 seconds each (which is sufficient to cover both bottom-up and top-down visual attention behaviors in a balanced manner). A trial session was performed to ensure the understanding of the proce-dure. The four used stimuli in this session don’t belong to the 84 generated ones. To minimize eventual "memory effect", the 84 stim-uli were displayed in a random order. By dividing the experiment into 3 sessions, we were able to check if the calibration was always valid, if not a 13-points eye-tracker calibration was done.
2.3
Data processing
From the collected gaze data, we derived fixations using three thresholds1: motion (◦), velocity (◦/𝑠𝑒𝑐), and acceleration (◦/𝑠𝑒𝑐2) . Afterwards, we computed ground-truth (GT) saliency maps, rep-resenting the probability of gazing for each pixel recorded from human data. This has been done with the usual technique: con-volving raw aggregated fixation data with a 2-D Gaussian kernel. 𝜎of the Gaussian distribution was set to 1◦of visual angle, which roughly estimates the fovea radius of the human visual system.
Before exploiting saliency maps, an important step was inte-grated in order to make sure that there is no bias introduced by occupancy of the 3D objects. A gray background was applied, dur-ing renderdur-ing, for its neutral attention-wise (i.e. does not contain any salient information). To take into account the visible surface of rendered 3D object, we considered a mask that changes from one content to another based on the visible surface of the 3D object.
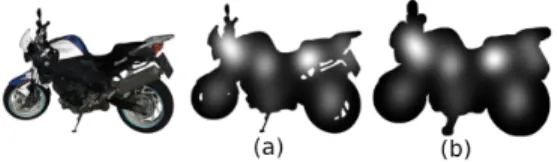
To take into account gaze data collected in the border of the visible surface of the 3D object, we enlarged the mask size by ap-plying a morphological dilatation on it. A disk-shaped structuring element was used for this morphological operation. Its diameter size corresponds to 1◦of visual angle; equal to 64 pixels in our experimental conditions. An illustration of the mask enlargement applied on the GT saliency information for the bike object is shown in figure 2.
Figure 2:Illustration of GT saliency information on the mask with-out (a) and with (b) morphological dilatation.
2.3.1 View-based attentional complexity analysis. Each 3D object was represented by a set of 2D views. Having the saliency informa-tion corresponding to each 2D view and based on the tools used in 2D imaging, we chose to evaluate the visual attention complexity (VAC) of different contents based on the method suggested in [30] which assess saliency dispersion to improve saliency-based image quality metric. Inter-Observer Congruency [15] method could have also been used. It characterizes the degree of agreement between observers freely viewing the same visual stimulus.
But in our use case, it is desirable to be able to predict VAC from visual attention computational model outputs. When computing Inter-Observer Congruency, one should use generative computa-tional models that produce plausible scanpaths (a.k.a saccadic mod-els). Whereas for the other indicator, one can use saliency map resulting from computational models. Given the fact that saliency models are more explored in the research field, we consider in this paper saliency dispersion tool [30] to evaluate the VAC. It consists on applying Shannon entropy on saliency information. Saliency maps are considered as realizations of a random variable. The entropy of the saliency map is defined as follows:
𝐸= −
𝑛
Õ
𝑖=1
𝑝𝑖𝑙 𝑜𝑔2𝑝𝑖 (1)
with 𝑝𝑖 = ℎ𝑖/𝐾 , where ℎ(𝑖)is the histogram entry for intensity value
i in the saliency map S, and K is the total number of pixels in S. In 2D imaging, when the entropy value is low, saliency is con-centrated in certain parts of the content (“focused images”). On the contrary, when entropy is high, saliency is more diffused, repre-senting “exploratory images”.
2.3.2 Adapting VAC measure to 3DGCs. There are 3 possible ways of computing entropy-based VAC on saliency information associ-ated to rendered 3DGC views:
1. Computing entropy on the mask that covers the visible surface of the graphical object as detailed above. In this case, the shape of the visible surface of the 3DGC is taken into consideration but not its size.
2. Computing entropy on the whole saliency map including the gray background. In this case, the size of the visible surface of the 3DGC is taken into consideration but not its shape.
3. Applying a normalization on the entropy value computed on the whole saliency map. This normalization takes into account the size of the visible surface of 3DGC. It consists on dividing the en-tropy value by a surface-wise ratio equal to𝑖𝑚𝑎𝑔𝑒 𝑠𝑖𝑧𝑒(𝑝𝑥 )𝑚𝑎𝑠𝑘 𝑠𝑖𝑧𝑒(𝑝𝑥 ) where 𝑖𝑚𝑎𝑔𝑒 𝑠𝑖𝑧𝑒is equal to the monitor screen size.
In this case, both shape and size information of 3DGC’s visible surface are taken into consideration. If the visible surface of the 3DGC covers the whole rendering screen, both entropy values are equal.
The first two computation ways (1. + 2.) do not allow relevant conclusions because they partially neglect saliency information either by omitting the background (which is a part of the eye-tracking experiment ) or by ignoring the surface ratio (representing the 3D object’s visible surface on the screen). We therefore consider the computation 3. as ourVAC-3DGC for the following analysis.
3
EXPERIMENTAL RESULTS
3.1
Subjective results analysis
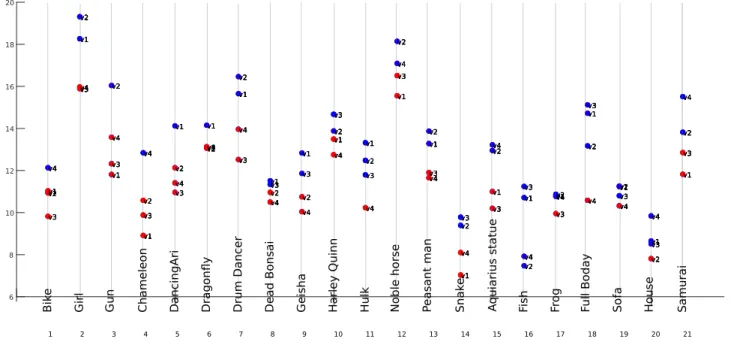
In our dataset, the surface ratio varies from an object to another in the range [0.12 , 0.45] and for the same 3DGC, ratio values vary from one view to another.For each of the twenty-one graphical objects, VAC-3DGC was computed across the 4 views. The obtained VAC values were reported in figure 4. They vary in range [ 7 , 19.3 ].
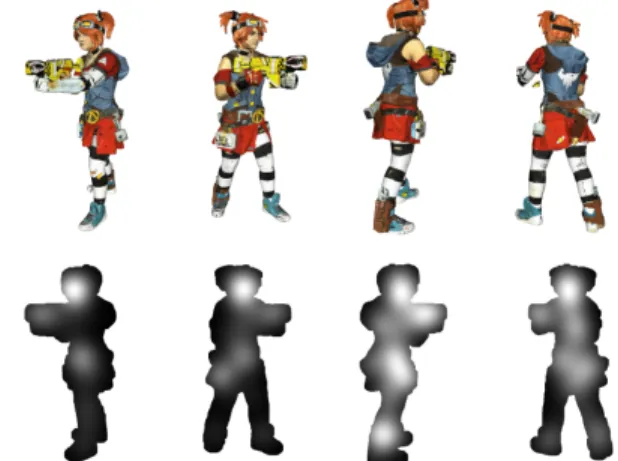
Figure 3:Saliency information of the 4 viewpoints of the "Girl".
For each 3D object, the values corresponding to the 4 views are plotted on the same x-axis where the object name is mentioned. Each scatter is labeled by an indexed viewpoint. It can be noticed that graphical objects have overall different VAC values. Moreover, in some graphical objects, there is a higher dispersion in terms of VAC values across views and others that have quite close values.
For each graphical object, we analyze the VAC values associated with the 4 different views. The view associated with the highest VAC value indicates that salient regions are spread out all over the saliency map. Thus, the view contains the fewest regions with strong saliency (i.e., the least semantically salient information). In this context, it has the lowest attentional complexity. On the contrary, the view associated with the lowest entropy value indi-cates that saliency is concentrated in certain part of the content (i.e., there are regions with strong saliency information). The view has highest attentional complexity.
Considering the object "Girl" shown in figure 1; v1, v2, v3 and v4 are illustrated in the order from right to left.
Based on figure 4, the scatters show that v1 and v2 have higher VAC values compared to v3 and v4. In fact, v3 and v4 both show the face of the "Girl" which corresponds to a strong salient region. In fact, when the face of a human model is visible it is always gazed by observers (leading to strong salienct regions). Whereas less salient regions are noticed when considering other viewpoints.
The saliency information obtained from the gaze data is illustrated for the "Girl" in figure 3.
To take into account the variability of the VAC values (over the views), we divide them into two clusters based on the k-nearest neighbors algorithm. Having 2 clusters per object indicate that small VAC values (corresponding to red colored scatters) have a lower visual attention complexity (i.e., perceptually concentrated attraction) than the high VAC values (corresponding to blue colored scatters).
Eye-tracking experiments are costly and time consuming thus, obtaining gaze data to compute saliency is not always possible. We therefore questioned the visual attention models’ ability to pre-dict saliency. Afterwards, we computed VAC-3DGC on correspond-ing saliency information of rendered views. Visual saliency models are traditionally used to predict where people gaze [6]. But, our aim is not to evaluate these models’ performance to predict saliency. We rather aim to evaluate their ability to predict attentional complexity based on our key performance indicator: VAC-3DGC (and therefore be used as predictors of VAC).
3.2
Saliency models as VAC objective predictors
3.2.1 Overview. In our context, visual information of the 3D graph-ics is crucial. When constructing a visual attention model, computer graphics community focuses on geometric patterns in saliency al-gorithms [17, 26] which seems sufficient for the application behind such as compression [26] or better object detection [13, 25]. How-ever, visual information remains important. In fact, recent works [14, 24] acknowledge the importance of visual information when computing saliency on 3D graphics, however a common guideline has yet to be done.
We suggest to get benefit from view-based visual attention models as they have extensively been explored in the research field and
showed impressive results [3].
We considered the best models resulting from MIT/Tuebingen Saliency Benchmark3restricted to those that provide executable code. Three among state-of-the-art models were investigated: SALI-CON [11], SAM-VGG [7], SAM-ResNet [7]. Based on deep learning architectures, these models were designed for natural images (i.e. not synthetic contents).
Traditionally, saliency models are evaluated based on their perfor-mances to predict where people look in different visualized contents (images, videos, stereo, 360°, etc).
Several metrics exist to measure the alignment between model pre-dictions and human eye fixations [5]. Such study was addressed on computer generated contents in [1].
In this paper saliency models performance is not detailed. We rather evaluate how well saliency models are aligned with the ground-truth in terms of visual attention complexity quantification on 3D graphics.
3.2.2 Evaluation of computed saliency results. To evaluate the aligne-ment of VAC values computed on the groud-truth saliency maps and the predicted ones resulting from saliency models, we consider a statistical measure by applying the Pearson Correlation Coeffi-cient (PCC).
We first computed saliency models on different 84 images. Once output saliency maps obtained - from the three computational mod-els -, we computed the view-wise VAC-3DGC (i.e. on the 84 rendered views).
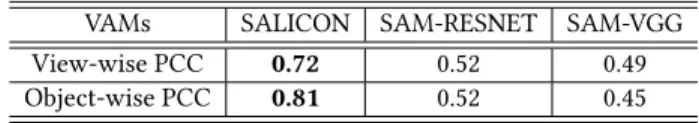
Table 1 reports the PCC on view-wise level by considering the over-all 84 rendered views, belonging to 21 different objects as well as the PCC on object-wise level.
3https://saliency.tuebingen.ai 6 8 10 12 14 16 18 20 v1 v2 v3 v4 v1 v2 v3 v4 v1 v2 v3 v4 v1 v2 v3 v4 v1 v2 v3 v4 v1 v2 v3 v4 v1 v2 v3 v4 v1 v2 v3 v4 v1 v2 v3 v4 v1 v2 v3 v4 v1 v2 v3 v4 v1 v2 v3 v4 v1 v2 v3 v4 v1 v2 v3 v4 v1 v2 v3 v4 v1 v2 v3 v4 v1 v2 v3 v4 v1 v2 v3 v4 v1 v2 v3 v4 v1 v2 v3 v4 v1 v2 v3 v4 v1 v2 v3 v4 v1 v2 v3 v4 v1 v2 v3 v4 v1 v2 v3 v4 v1 v2 v3 v4 v1 v2 v3 v4 v1 v2 v3 v4 v1 v2 v3 v4 v1 v2 v3 v4 v1 v2 v3 v4 v1 v2 v3 v4 v1 v2 v3 v4 v1 v2 v3 v4 v1 v2 v3 v4 v1 v2 v3 v4 v1 v2 v3 v4 v1 v2 v3 v4 v1 v2 v3 v4 v1 v2 v3 v4 v1 v2 v3 v4 v1 v2 v3 v4 v1 v2 v3 v4 v1 v2 v3 v4 v1 v2 v3 v4 v1 v2 v3 v4 v1 v2 v3 v4 v1 v2 v3 v4 v1 v2 v3 v4 v1 v2 v3 v4 v1 v2 v3 v4 v1 v2 v3 v4 v1 v2 v3 v4 v1 v2 v3 v4 v1 v2 v3 v4 v1 v2 v3 v4 v1 v2 v3 v4 v1 v2 v3 v4 v1 v2 v3 v4 v1 v2 v3 v4 v1 v2 v3 v4 v1 v2 v3 v4 v1 v2 v3 v4 v1 v2 v3 v4 v1 v2 v3 v4 v1 v2 v3 v4 v1 v2 v3 v4 v1 v2 v3 v4 v1 v2 v3 v4 v1 v2 v3 v4 v1 v2 v3 v4 v1 v2 v3 v4 v1 v2 v3 v4 v1 v2 v3 v4 v1 v2 v3 v4 v1 v2 v3 v4 v1 v2 v3 v4 v1 v2 v3 v4 v1 v2 v3 v4 v1 v2 v3 v4 v1 v2 v3 v4 v1 v2 v3 v4 v1 v2 v3 v4 v1 v2 v3 v4 1 Bik e 2 Girl 3 Gun 4 Chameleon 5 Danci ngAri 6 Drago n fl y 7 Drum Da ncer 8 Dead Bonsa i 9 Geis ha 10 Harl ey Qu inn 11 Hul k 12 Noble hors e 13 Peasa nt man 14 Snak e 15 A quiarius statu e 16 Fish 17 Fr og 18 Full Boda y 19 Sofa 20 Hou se 21 Samurai
The latter was defined as follow: for each graphical object, we com-puted the mean VAC measure along object’s different views. Table 1: PCC of VAC-3DGC between the GT saliency maps and the ones resulting from the 3 saliency models.
VAMs SALICON SAM-RESNET SAM-VGG View-wise PCC 0.72 0.52 0.49 Object-wise PCC 0.81 0.52 0.45
Based on table 1, SALICON model has the highest correlation score in terms of view-wise VAC. The level of correlation (view-wise 𝑃𝐶𝐶 =0.72) while fair and encouraging could be improved with more ad hoc efforts according to the considered use case. As we are investigating a criteria that enables content selection, we also performed an object-wise analysis.
As reported in table 1, SALICON model has the highest correlation score in terms of object-wise VAC with a high level of correlation (object-wise 𝑃𝐶𝐶 = 0.81) compared to other saliency models. Based on preliminary results, it is possible to perceptually charac-terize 3DGC by using SALICON model as an objective predictor based on the VAC-3DGC measure. As it is highly correlated with the experimental VAC information. A detailed look in the VAC values obtained from SALICON model shows that the range of variation of VAC values is wider (between 10 and 29) and the VAC values are overall higher than the ones obtained from human gaze data (between 7 and 19).
4
CONCLUSION
In this work, we extended the concept of visual attention complex-ity (VAC) indicator, already introduced in 2D imaging context, by adapting it to the perceptual characterization of 3D graphical con-tent (3DGC). Based on gaze data resulting from the eye-tracking experiment, we proposed a method to compute VAC suitable for 3DGC. We also investigated the ability of state-of-the-art compu-tational saliency prediction models to correlate with ground-truth VAC. This evaluation suggests that some saliency models (such as SALICON model) can achieve sufficient performances to predict VAC-3DGC measure. These saliency models could be used to bal-ance content selection in Quality of Experience (QoE) experiment or 3DGC rendering optimization.
5
ACKNOWLEDGMENTS
This work was supported by French National Research Agency as part of ANR-PISCo project (ANR-17-CE33-0005).
REFERENCES
[1] M. Abid, M. P. Da Silva, and P. L. Callet. 2019. On the usage of visual saliency models for computer generated objects. In 2019 IEEE 21st International Workshop on Multimedia Signal Processing (MMSP). 1–5.
[2] Dirk Bartz, Douglas W Cunningham, Jan Fischer, and Christian Wallraven. 2008. The Role of Perception for Computer Graphics.. In Eurographics (STARs). 59–80. [3] Ali Borji and Laurent Itti. 2012. State-of-the-art in visual attention modeling. IEEE
transactions on pattern analysis and machine intelligence 35, 1 (2012), 185–207. [4] ITU recommendation BT.500-13. 2002. Methodology for the subjective assessment
of the quality of television pictures. International Telecommunication Union (2002). [5] Zoya Bylinskii, Tilke Judd, Aude Oliva, Antonio Torralba, and Frédo Durand.
2019. What Do Different Evaluation Metrics Tell Us About Saliency Models? IEEE Transactions on Pattern Analysis and Machine Intelligence 41 (2019), 740–757.
[6] Zoya Bylinskii, Adrià Recasens, Ali Borji, Aude Oliva, Antonio Torralba, and Frédo Durand. 2016. Where should saliency models look next?. In European Conference on Computer Vision. Springer, 809–824.
[7] Marcella Cornia, Lorenzo Baraldi, Giuseppe Serra, and Rita Cucchiara. 2018. SAM: Pushing the Limits of Saliency Prediction Models. In Proceedings of the IEEE Conference on Computer Vision and Pattern Recognition Workshops. 1890–1892. [8] Francesca De Simone, Jesus Gutierrez, and Patrick Le Callet. 2019. Complexity
measurement and characterization of 360-degree content. Electronic Imaging 2019, 12 (2019), 216–1.
[9] David Hasler and Sabine E Suesstrunk. 2003. Measuring colorfulness in natural images. In Human vision and electronic imaging VIII, Vol. 5007. International Society for Optics and Photonics, 87–95.
[10] Jacek Jankowski and Martin Hachet. 2013. A Survey of Interaction Techniques for Interactive 3D Environments. In Eurographics.
[11] Ming Jiang, Shengsheng Huang, Juanyong Duan, and Qi Zhao. 2015. Salicon: Saliency in context. In Proceedings of the IEEE conference on computer vision and pattern recognition. 1072–1080.
[12] Christof Koch and Shimon Ullman. 1987. Shifts in selective visual attention: towards the underlying neural circuitry. In Matters of intelligence. Springer, 115–141.
[13] Hao-Yuan Kuo, Hong-Ren Su, Shang-Hong Lai, and Chin-Chia Wu. 2014. 3D object detection and pose estimation from depth image for robotic bin picking. In 2014 IEEE international conference on automation science and engineering (CASE). IEEE, 1264–1269.
[14] Guillaume Lavoué, Frédéric Cordier, Hyewon Seo, and Mohamed-Chaker Larabi. 2018. Visual attention for rendered 3D shapes. In Computer Graphics Forum, Vol. 37. Wiley Online Library, 191–203.
[15] Olivier Le Meur, Thierry Baccino, and Aline Roumy. 2011. Prediction of the inter-observer visual congruency (IOVC) and application to image ranking. In Proceedings of the 19th ACM international conference on Multimedia. 373–382. [16] Pierre Lebreton, Alexander Raake, Marcus Barkowsky, and Patrick Le Callet.
2014. Measuring perceived depth in natural images and study of its relation with monocular and binocular depth cues. In Stereoscopic Displays and Applications XXV, Vol. 9011. International Society for Optics and Photonics, 90110C. [17] Chang Ha Lee, Amitabh Varshney, and David W Jacobs. 2005. Mesh saliency.
ACM transactions on graphics (TOG) 24, 3 (2005), 659–666.
[18] Junghyuk Lee, Toinon Vigier, Patrick Le Callet, and Jong-Seok Lee. 2018. A Perception-Based Framework for Wide Color Gamut Content Selection. In 2018 25th IEEE International Conference on Image Processing (ICIP). IEEE, 709–713. [19] Jock D Mackinlay, Stuart K Card, and George G Robertson. 1990. Rapid controlled
movement through a virtual 3D workspace. In Proceedings of the 17th annual conference on Computer graphics and interactive techniques. 171–176. [20] Manish Narwaria, Claire Mantel, Matthieu Perreira Da Silva, Patrick Le Callet,
and Søren Forchhammer. 2014. An objective method for High Dynamic Range source content selection. In 2014 Sixth International Workshop on Quality of Multimedia Experience (QoMEX). IEEE, 13–18.
[21] ITU recommendation P.910. 2008. Subjective video quality assessment methods for multimedia applications. International Telecommunication Union (2008). [22] Jhony K Pontes, Chen Kong, Anders Eriksson, Clinton Fookes, Sridha Sridharan,
and Simon Lucey. 2017. Compact model representation for 3D reconstruction. arXiv preprint arXiv:1707.07360 (2017).
[23] Charles R Qi, Hao Su, Matthias Nießner, Angela Dai, Mengyuan Yan, and Leonidas J Guibas. 2016. Volumetric and multi-view cnns for object classifi-cation on 3d data. In Proceedings of the IEEE conference on computer vision and pattern recognition. 5648–5656.
[24] Ghazal Rouhafzay and Ana-Maria Cretu. 2018. Perceptually Improved 3D Object Representation Based on Guided Adaptive Weighting of Feature Channels of a Visual-Attention Model. 3D Research 9, 3 (2018), 29.
[25] Elizabeth Shtrom, George Leifman, and Ayellet Tal. 2013. Saliency detection in large point sets. In Proceedings of the IEEE International Conference on Computer Vision. 3591–3598.
[26] Ran Song, Yonghuai Liu, Ralph R Martin, and Paul L Rosin. 2014. Mesh saliency via spectral processing. ACM Transactions on Graphics (TOG) 33, 1 (2014), 6. [27] Hang Su, Subhransu Maji, Evangelos Kalogerakis, and Erik Learned-Miller. 2015.
Multi-view convolutional neural networks for 3d shape recognition. In Proceed-ings of the IEEE international conference on computer vision. 945–953. [28] X. Wang, D. Lindlbauer, C. Lessig, M. Maertens, and M. Alexa. 2016. Measuring the
Visual Salience of 3D Printed Objects. IEEE Computer Graphics and Applications 36, 4 (2016), 46–55.
[29] Stefan Winkler. 2014. Efficient measurement of stereoscopic 3D video content issues. In Image Quality and System Performance XI, Vol. 9016. International Society for Optics and Photonics, 90160Q.
[30] Wei Zhang, Ralph R Martin, and Hantao Liu. 2017. A saliency dispersion measure for improving saliency-based image quality metrics. IEEE Transactions on Circuits and Systems for Video Technology 28, 6 (2017), 1462–1466.