HAL Id: hal-01659258
https://hal.archives-ouvertes.fr/hal-01659258
Submitted on 8 Dec 2017HAL is a multi-disciplinary open access
archive for the deposit and dissemination of sci-entific research documents, whether they are pub-lished or not. The documents may come from teaching and research institutions in France or abroad, or from public or private research centers.
L’archive ouverte pluridisciplinaire HAL, est destinée au dépôt et à la diffusion de documents scientifiques de niveau recherche, publiés ou non, émanant des établissements d’enseignement et de recherche français ou étrangers, des laboratoires publics ou privés.
Tumour functional sphericity from PET images:
prognostic value in NSCLC and impact of delineation
method
Mathieu Hatt, Baptiste Laurent, Hadi Fayad, Vincent Jaouen, Dimitris
Visvikis, Catherine Cheze Le Rest
To cite this version:
Mathieu Hatt, Baptiste Laurent, Hadi Fayad, Vincent Jaouen, Dimitris Visvikis, et al.. Tumour functional sphericity from PET images: prognostic value in NSCLC and impact of delineation method. European Journal of Nuclear Medicine and Molecular Imaging, Springer Verlag (Germany), In press, �10.1007/s00259-017-3865-3�. �hal-01659258�
Tumor functional sphericity from PET images: prognostic value in NSCLC and
impact of delineation method
Mathieu Hatt1, Baptiste Laurent1, Hadi Fayad1, Vincent Jaouen1, Dimitris Visvikis1, Catherine Cheze Le Rest1,2
1
LaTIM, INSERM, UMR 1101, IBSAM, UBO, UBL, Brest, France 2
Department of Nuclear Medicine, CHU Milétrie, Poitiers, France
Corresponding author: M. Hatt
INSERM, UMR 1101, LaTIM
IBRBS – Institut Brestois de Recherche en Biologie et Santé Faculté de médecine, 22 rue Camille Desmoulins
29238, Brest, France Tel: +33(0)2.98.01.81.11 Fax: +33(0)2.98.01.81.24 E-mail: hatt@univ-brest.fr
Wordcount: ~5950
Compliance with ethical standards:
All authors declare they have no potential conflicts of interest.
This study was funded in part by the National Institute of Cancer (INCa project #PRT-K15-119). All procedures performed in studies involving human participants were in accordance with the ethical standards of the institutional and/or national research committee and with the 1964 Helsinki declaration and its later amendments or comparable ethical standards.
Abstract
Purpose: Sphericity has been proposed to characterize PET tumor volumes, with complementary
prognostic value with respect to SUV and volume in both head and neck and lung cancer. The objective of the present study was to investigate its dependency on the tumor delineation and the resulting impact on its prognostic value.
Materials and methods: Five segmentation methods were considered: 2 thresholds (40% and 50% of
SUVmax), the ant colony optimization (ACO), the fuzzy locally adaptive Bayesian (FLAB), and the gradient-aided region-based active contour (GARAC). The accuracy of each method to extract sphericity was evaluated on a dataset of 176 simulated, phantom and clinical PET images of tumors with associated ground-truth. The prognostic value of sphericity and its complementary value with volume for each segmentation method was evaluated in a cohort of 87 stage II-III lung cancer patients.
Results: Volume and sphericity associated values were dependent on the segmentation method. The
correlation between the segmentation accuracy and the sphericity error was moderate (|ρ| from 0.24 to 0.57). The accuracy in measuring the sphericity was not dependent on the volume (|ρ|<0.4). In the lung cancer cohort, sphericity had prognostic value although lower than volume, except for FLAB for which a small improvement over volume alone when combined with sphericity was observed (hazard ratio of 2.67 compared to 2.5). Substantial differences in patients’ prognosis stratification were observed depending on the segmentation.
Conclusion: The tumor functional sphericity was found to be dependent on the segmentation
method, although the accuracy to retrieve the true sphericity was not dependent on tumor volume. In addition, even an accurate segmentation can lead to an inaccurate sphericity, and vice-versa. Sphericity had similar or lower prognostic value than volume in the NSCLC cohort, except with one method (FLAB) for which there was a small improvement in stratification when combining both parameters.
Keywords: Radiomics, sphericity, PET functional volumes, image segmentation, prognosis.
Introduction
The extraction of advanced metrics from Positron Emission Tomography / Computed Tomography (PET/CT) images has been a productive field of research since the use of 3D shape descriptors and textural features was introduced for PET [1]. More recently, the radiomics approach has proposed the systematic, high-throughput extraction of quantitative data from radiology based medical images [2], which requires a complex workflow along with robust machine learning techniques to handle the numerous features that are calculated [3,4]. In functional PET imaging more specifically, the rationale behind the use of radiomics has been mostly related to the quantification of the tumor functional volume and the heterogeneity of the intra-tumor activity distribution, usually addressed by extracting 1st-order histogram-based metrics [1,5] or higher order textural features [1,6].
The use of a 3D shape descriptor named asphericity has been proposed to indirectly assess uptake heterogeneity in FDG PET images with prognostic value in both head and neck and non-small cell lung cancer (NSCLC) [7–9]. It was also shown to be correlated with underlying histopathological features and molecular markers [10].
Asphericity has up to now been evaluated mostly by one group [7–10], using a segmentation method based on adaptive thresholding taking into account the background activity concentration [11]. Two other groups investigated asphericity or a similar metric in squamous cell lung carcinoma [12] and in lymphoma [13]. Despite the early promising results associated with the use of asphericity as a PET image biomarker, the dependency of this parameter and its associated prognostic value on the choice of the segmentation methodology has not been investigated. The objective of this study was to determine this dependency using diverse segmentation techniques first in a large dataset of physical, simulated, and clinical PET tumor images with ground-truth, second in terms of prognosis stratification in a cohort of NSCLC patients.
Materials and methods
Sphericity and segmentation methods
Functional tumor sphericity is defined as , where V is the volume and S the surface of the segmented functional uptake of the tumor. Therefore, a value of 1 corresponds to a perfect sphere whereas lower values correspond to functional uptake with less spherical (i.e. more complex) shapes. Previous publications [7–10] used a slightly different (although similar) definition:
Asphericity= .
Four different segmentation approaches were considered: fixed thresholding (with two different values of 40% and 50% of SUVmax) and 3 semi-automatic methods chosen in order to include different paradigms. The fuzzy locally adaptive Bayesian (FLAB) combines a statistical measure with fuzzy modeling [14]. Ant colony optimization (ACO) mimics the behavior of real ants foraging for food [15]. Gradient-aided region-based active contour (GARAC) is a level-set combining region, edge and curvature constraints [16]. ACO and FLAB are both clustering methods but rely on completely different functions, whereas GARAC is a geometric model (additional details in the Supplementary material). We did not include an adaptive threshold because it requires optimization for each specific configuration of scanner model, acquisition protocol, reconstruction algorithm and parameters [17,18], yet the dataset we used is highly heterogeneous in that regard. Although the other algorithms were previously optimized during their development on various clinical and simulated datasets, they do not require scanner or reconstruction-specific optimization contrary to adaptive thresholding approaches. Fixed thresholding at 40% and 50% of SUVmax obviously do not require any previous optimization.
Datasets
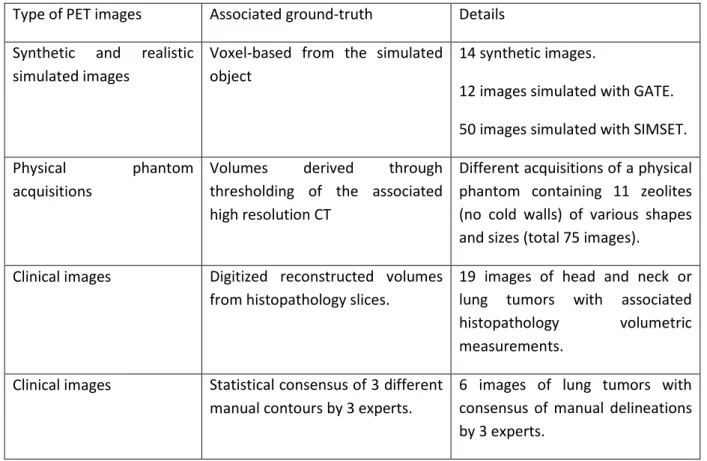
Following the recommendations of the recent report by the Taskgroup 211 of the American Association of Physicists in Medicine (AAPM), we collected a combination of three types of datasets: synthetic and simulated images, phantom acquisitions, and real clinical images [18,19]. Each category has different advantages and drawbacks in terms of realism and reliability of the ground-truth (or surrogate of truth). They are thus complementary within the context of a comprehensive and rigorous evaluation of the methods’ accuracy. The following dataset was assembled: 76 synthetic and simulated (with GATE or SIMSET) images, 75 zeolites physical phantom images and 25 clinical images (19 with corresponding histopathology volumes and 6 with consensus of three expert manual delineations) (table 1). All tumors in this dataset were isolated in cropped volumes of interest (VOI) containing only the tumor and its immediate surrounding. The ground-truth of each tumor image allows the computation of a sphericity ground-truth simply by calculating the sphericity on the binary map. The volume V and surface S were determined through the marching cubes algorithm for better accuracy [20].
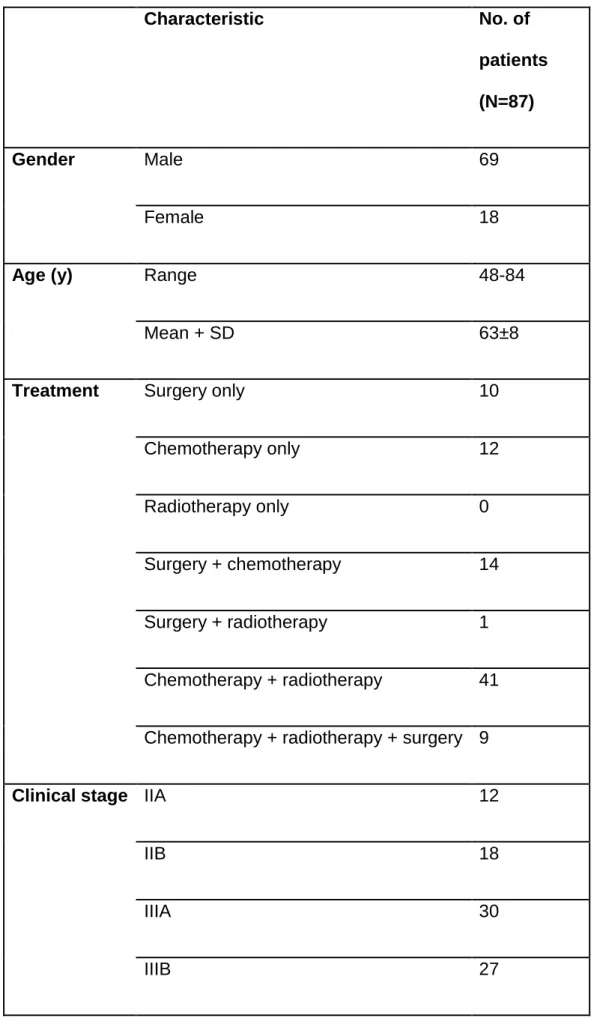
The second dataset exploited in the present work consists of 87 stage II (n=30) and III (n=57) NSCLC patients, diagnosed between 2008 and 2012 in the University Hospital of Poitiers (France) and already retrospectively recruited and analyzed for a previous study [21] (Table 1). Treatment consisted of (chemo)radiotherapy for 41 patients, whereas 34 underwent surgery (either alone or in combination with chemotherapy and/or radiotherapy) and 12 received palliative chemotherapy. Radiotherapy was with curative intent for all patients (mean dose 59.4 Gy). Stage II and III patients had similar OS (HR 1.4, p>0.2), with none of the clinical (age, gender, smoking status, N stage, treatment modality) or standard imaging features (SUVmax, SUVmean, SUVpeak) significantly associated with OS after correction for multiple testing and retained in multivariate analysis, contrary to volume and other radiomics features [21].
Mean up was 25 months (range 1.5-74 months). Median OS was 14.9 months. At last follow-up 65 patients were dead and 22 alive. A maximum of two weeks after diagnosis, all patients underwent an 18F-FDG PET/CT scan on a Philips GEMINI PET/CT scanner (Philips Medical Systems, USA) following standard routine protocol: image acquisition began after 6 hours of fasting and 60±5min after injection of 5MBq/kg of 18F-FDG (424±97MBq, range 220-690MBq). Non-contrast enhanced, non-respiratory gated (free breathing) CT images were acquired (120kV, 100mAs), with an in-plane resolution of 0.853×0.853mm2 and a 5mm slice thickness. PET data were acquired using 2 min per bed position. Images were reconstructed using a 3D row-action maximum likelihood algorithm (2 iterations, relaxation parameter 0.05, 4×4×4mm3 voxels) and post-filtered with a 5 mm full-width-at-half-maximum 3-D Gaussian. All PET images were corrected for attenuation using the associated CT. The primary tumors of each patient were isolated in VOIs for the previous study [21], and the same VOIs were used in the present work.
Figure 1 shows the distributions of volumes and sphericity values and figure 2 provides visual examples from each dataset.
Evaluation methodology and statistical analysis
In order to evaluate the accuracy of each segmentation method on the dataset with ground-truth, the combination of sensitivity (SE) and positive predictive value (PPV) was used as recommended by the taskgroup 211 since it provides the most comprehensive information on location, size and shape, as well as information regarding false positive and false negative rates [18]. In the present work, the accuracy was quantified using score = 0.5 × PPV + 0.5 × SE.
First, scatter diagrams of the volume-sphericity distributions were generated for the ground-truth and each segmentation method.
Second, the accuracy in retrieving the ground-truth sphericity value was evaluated by calculating the difference (%) between the sphericity of the ground-truth and the one calculated on the
segmentation map for each method. Scatter diagrams between these sphericity errors and the corresponding accuracy, as well as the corresponding volume were generated. Spearman rank correlations were used to quantify the correlation between variables and Mann-Whitney tests were used to compare distributions.
Assuming a larger volume and lower sphericity (higher asphericity) are both associated with poorer outcome [7] and their correlation is sufficiently low to provide complementary stratification power, we compared the prognosis stratification for OS in the cohort of the 87 NSCLC patients obtained using the tumor volume, sphericity, and the combination of the two parameters as provided by each segmentation method. For each parameter, the best cut-off value to stratify patients was determined through receiver operating characteristic (ROC) curve analysis and the Youden index. Regarding the combination of the two parameters, we generated survival curves for either 2 or 3 patient groups, according to the following combination of prognostic factors (i.e., volume above the identified threshold and sphericity below the identified threshold): for stratification into 2 groups, patients were classified as having both factors vs. patients having neither or either. For stratification into 3 groups, patients were classified as having neither (group 1), either (group 2), or both (group 3) factors. The obtained stratifications were compared in terms of hazard ratios, median survival in each group and p-value of the log-rank test of Kaplan-Meier curves. Statistical significance was set at p<0.01. Statistics are reported as mean±standard deviation (median). Statistical analyses were performed with MedCalcTM (Medcalc software, Belgium).
Results
As shown in figure 1, the ranges of volumes and sphericity varied with each category of data. Regarding the first dataset with ground-truth, the simulated dataset encompasses the largest range of configurations in both volume (<1 to 200 cm3) and sphericity (0.45-0.95). The phantom acquisitions (zeolites) have a smaller range of both volumes (<1 to 6 cm3) and sphericity (0.75-0.85), whereas the clinical data have volumes between 1 and 80 cm3, corresponding to sphericity values of
0.5 to 0.9. Overall, the rank correlation between volume and sphericity (ground-truth values) was weak although significant (ρ=-0.27), larger volumes exhibiting lower sphericity, mostly because of a much higher correlation in the phantom data (ρ=-0.73) compared to simulated (ρ=-0.21) and clinical (ρ=-0.12) images, mostly due to the lower range of sphericity values for phantom zeolites acquisitions (0.75-0.85). By comparison, the tumors in the NSCLC cohort exhibited somewhat larger volumes with however a large overlap with the volumes of the first dataset (1-400 cm3) and with a very close range of sphericity values (0.4-0.9). Correlation between volume and sphericity was ρ=-0.66.
Dataset with ground-truth
The volume-sphericity distributions obtained by each segmentation method show that ACO and FLAB overestimated volumes whereas GARAC and thresholds underestimated them (figure 3, Supplemental figure 1). Overall, higher segmentation accuracy was achieved on simulated and phantom images compared to clinical ones (figure 4a-b). This can be attributed to a combination of a higher complexity and a lower reliability of the surrogate of truth for clinical images. ACO had the best segmentation accuracy, followed by FLAB and GARAC, although there was no significant difference between them (figure 4c). All three had significantly higher segmentation accuracy than T40 (p<0.01) and T50 (p<0.0001). On the other hand, all five methods had similar accuracy in retrieving sphericity, with no statistically significant difference (p>0.1) in terms of absolute sphericity measurement errors, although the different methods had different behaviors: ACO, FLAB and both thresholds tended to either over- or under-estimate sphericity (0.2±18.4% (2.5%), 3.9±17.0% (0.5%), 2.5±13.3% (4.0%) and 0.74±15.8% (3.1%) for ACO, FLAB, T40 and T50 respectively), whereas GARAC had a clear bias towards overestimation (14.0±16.2% (11.3%)) (figure 4d). The correlation between the method accuracy and the resulting sphericity measurement error was moderate, and varied amongst the methods (figure 5): it was higher for GARAC and ACO (ρ=-0.57 and ρ=-0.54), whereas it was lower for FLAB and the thresholds (ρ=-0.25, ρ=-0.27 and ρ=-0.24 respectively). Some accurate
delineations still led to high sphericity errors. The ability to recover sphericity with accuracy was only weakly correlated with tumor volume (|ρ|<0.4) whatever the segmentation method (figure 6).
Stratification in NSCLC patients
Independently of the segmentation methodology, sphericity was correlated with the corresponding tumor volume, larger volumes exhibiting lower sphericity (supplemental material figure 3). However, the correlation varied from ρ=-0.55 according to GARAC, up to ρ=-0.75 with ACO. Nonetheless, sphericity showed some potential complementary information with respect to tumor volume for all segmentation methods.
Given the large differences in the volume distributions determined by the five segmentation methods, the best cut-off values were similarly different, ranging from 21 cm3 for T40 to 45 cm3 for GARAC (table 3). The corresponding sphericity had lower variability and the best thresholds ranged from 0.801 for T50 to 0.881 for GARAC.
Using volume alone to stratify patients into 2 groups, differences were seen amongst segmentation methods, although it was possible to obtain two groups with significantly different outcome for all methods (table 3). Hazard ratios ranged from 2.1 for T40 to almost 2.5 for ACO. The different distributions of volumes depending on the segmentation method led to different repartitions of patients in each risk group. For example, using ACO or GARAC led in classifying 29 patients in low risk and 58 patients in high risk, whereas using FLAB it was more balanced with 43 patients in low risk and 44 in high risk.
Using sphericity alone for 2-group stratification, only ACO and FLAB allowed to obtain significantly different outcome (p>0.02 for T40, T50 and GARAC). The hazard ratio associated with sphericity was higher than the one associated with volume only for FLAB (2.50 vs. 2.45). When combining the two parameters, a moderate improvement (with respect to volume or sphericity alone) was seen only for FLAB (2.67), whereas for the other methods it led to lower HRs than volume alone (table 3, figure 7).
Regarding the stratification into three groups, again substantial differences were observed (figure 8, supplemental table 1). The best stratification was obtained with FLAB, with a hazard ratio of 3.41 between groups 1 and 3, and the highest differentiation between group 2 and the two other groups. GARAC and ACO also provided good stratification but with slightly lower hazard ratios. The least convincing stratifications were obtained with T40 and T50 for which groups 1 and 2 were not differentiated.
Discussion
The application of radiomics in multimodality PET/CT imaging is a very active field of research. However, numerous issues have been identified that slow its transfer to the clinical practice [3]. These issues include the time-consuming and user-dependent tumor segmentation, the lack of standardization, as well as the challenges in identifying reliable, repeatable, robust and non-redundant biomarkers amongst the hundreds that can be calculated. A first selection of the most appropriate features can be made based on test-retest, reproducibility and robustness analyses. However, the need to combine a number of these biomarkers into multi-variable models requires the use of appropriate techniques from the field of machine learning [4], raising numerous additional issues, amongst others the choice of classifier and features selection methods and the need for complex statistical validation of findings [22].
In that context, the appeal of any single parameter that could complement tumor volume to further characterize functional tumor uptakes from PET images and can be relatively quickly implemented in clinical practice is strong. The shape descriptor sphericity has been recently highlighted as one such new measure that could provide complementary prognostic value for patients stratification in both H&N and NSCLC [7–10]. In addition, it could be also considered as indirectly quantifying uptake heterogeneity. Second and higher-order textural features require a complex calculation workflow involving multiple choices (quantization pre-processing, texture matrices design, etc.) [3] and it can be challenging to provide visual interpretation for them, although correlations were reported
[23,24]. This is especially the case for higher order features that may capture different information than the naked eye [25,26]. On the contrary, sphericity is easier to calculate and represents a more intuitive interpretation for clinicians. Another advantage of sphericity, amongst other shape descriptors, is its high test-retest repeatability [27,28]. Sphericity was also previously shown to be rather consistent across five different manual segmentation by experts with an inter-observer ICC of 0.80 [29], although this evaluation was performed on 23 images only, with manual delineation performed on fused PET/CT images, not using automated segmentation methods as in the present study.
In this work we compared sphericity and volume as determined by four different segmentation paradigms. We observed in a large physical, simulated and clinical dataset with associated ground-truth that sphericity was dependent on the segmentation methodology, with different volume-sphericity distributions. A higher segmentation accuracy according to a combination of PPV and SE was not necessarily associated with an accurate estimation of true sphericity. Indeed, a segmentation result could well overlap with the ground-truth without respecting its shape. For instance, spatial methods with explicit curvature regularization such as the GARAC deformable model tend to increase the sphericity value and reduce its variability across subjects. They should therefore be carefully tuned to allow for more accurate sphericity estimation. Although thresholds were significantly less accurate than more advanced methods in terms of segmentation for the first dataset, they nonetheless provided sphericity measurements with similar accuracy. However, in the NSCLC cohort, they provided metrics (either alone or combined) with consistently lower prognostic value than ACO and FLAB. This can be attributed in part to the fact that the first dataset contains a majority of simpler (homogeneous uptakes, less complex shapes) cases, whereas the NSCLC dataset contains a larger proportion of more complex shapes and more heterogeneous distributions.
In the clinical cohort of NSCLC patients, differences in patient stratification according to volume and sphericity were observed, depending on the segmentation. Although all segmentation methods
allowed stratifying patients into two groups with significantly different survival based on volume alone (HR between 2.10 and 2.48, p<0.006), corroborating similar observations in previous studies [30], such was not the case for sphericity alone, only FLAB and ACO providing sphericity with significant prognostic value. This highlights the potentially higher dependency of this parameter’s prognostic value on the segmentation choice compared to volume. In addition, sphericity did not demonstrate higher prognostic value than volume in our cohort, whatever method was considered. Combining volume and sphericity led to at best a moderate improvement only, from hazard ratios with volume or sphericity alone of 2.45 and 2.5 to 2.67 when combining both using FLAB. For the four other methods, the combination of parameters led to lower HRs than volume. Although for stratification into two groups, the differences between methods were small, when exploiting volume and sphericity for 3-group stratification, the three advanced methods provided metrics more useful than both thresholds. It is likely due to the combination of i) a reduced accuracy in the sphericity measurement of lesions with the most complex shapes and heterogeneous and ii) the level of intrinsic correlation between volume and sphericity, depending on the segmentation method.
Our results are therefore not in line with those obtained in 60 NSCLC patients where volume was not a significant prognostic factor for OS (despite a trend) whereas asphericity had a HR of 2.97 (p=0.03) [7] and was correlated with volume at |ρ|=0.54, which is similar to what we observed for the FLAB-derived values (|ρ|=0.67). A major difference was that the 60 patients were a more heterogeneous mixture of stage I to IV, whereas our cohort was limited to stage II and III. A metric similar to asphericity was also found moderately correlated (r=0.53) with heterogeneity visual scoring and associated with recurrence in 83 lung cancer patients [12]. In 57 lymphoma patients PET uptakes larger than 50 cm3 were characterized with numerous radiomics features including asphericity, after segmentation using two different fixed threshold (31 and 40% of SUVmax) [13]. Asphericity was not found to be predictive of metabolic response, contrary to other radiomics features. Although two different segmentation methods were considered, variability of the results according to
segmentation were presented only for the few features found significant, therefore no results were available for asphericity.
Our study has limitations. The first dataset is highly heterogeneous in image characteristics, owing to the fact that it results from various contributions of different types of data. This is a desirable property for the purpose of evaluating the image segmentation methods [18]. However this prevented us to include an adaptive thresholding technique due to the requirement of optimizing these methods for specific combinations of scanner models, acquisition protocols and reconstruction parameters [18]. Apart from the widely used fixed thresholds at 40% and 50% of SUVmax, the three other more advanced methods are not widely available. They are, however, representative of state-of-the-art developments of various image segmentation paradigms (clustering, fuzzy modeling, deformable models) that have been adapted for PET image segmentation [18]. Therefore the variability of the resulting sphericity we observed amongst these three approaches will likely be quite similar when comparing other PET segmentation algorithms (e.g adaptive thresholding, region growing, or contour/gradient-based segmentation). We focused on PET functional sphericity. NSCLC tumor shape has also been characterized from anatomical imaging such as CT, also providing prognostic value [31]. Future investigations may compare the prognostic value of anatomical tumor shape (from CT) and functional uptake shape (from PET) or their combination [21]. The cohort of patients was of limited size, which reduced the discriminative power in comparing the stratification results between methods. We also did not split the cohort into training and testing sets, as our goal was to compare the stratifications obtained using the parameters derived from different segmentations. We also did not include other shape features usually considered in radiomics studies (e.g. solidity, convexity, etc.). However, these shape features are highly correlated with each other and usually have similar behavior in robustness and repeatability studies [27–29], suggesting our results may be generalizable to other shape descriptors. Finally, the clinical PET acquisitions were carried out without respiratory gating, which could lead to biased estimation of the true sphericity in
some of the tumors most affected by motion. Ideally, when analyzing lung tumors in any radiomics study, respiratory motion correction is expected to improve the results.
To conclude, caution should be exercised regarding the method used for tumor volume delineation in the PET images, as this could have a strong impact on the estimated clinical value of the sphericity parameter. In particular, methods exploiting curvature or shape priors should be carefully evaluated and subsequently optimized for sphericity determination. Finally, the prognostic value of sphericity in NSCLC might be limited with respect to that of volume alone, and this warrants further investigations in larger cohorts.
Conclusions
The tumor functional sphericity was found to be dependent on the segmentation methodology. An accurate segmentation can nonetheless lead to an inaccurate sphericity, and vice-versa. The resulting impact in patients’ prognosis stratification was found to be important; not all segmentation methods allowing to demonstrate a complementary or additional prognostic value of sphericity compared to volume. In conclusion, caution should be exercised regarding the method used for tumor volume delineation in the PET image for any study investigating the prognostic value of sphericity and potentially other shape descriptors.
Acknowledgements
Thanks to TG211 members who contributed datasets: Assen Kirov, John Lee, Michalis Aristophanous, Emiliano Spezi, Béatrice Berthon, Elisabetta De Bernardi. Assen Kirov’s contribution was funded in part by NIH/NCI grant P30CA008748.
References
1. El Naqa I, Grigsby P, Apte A, Kidd E, Donnelly E, Khullar D, et al. Exploring feature-based approaches in PET images for predicting cancer treatment outcomes. Pattern Recognit. 2009;42:1162–71.
2. Lambin P, Rios-Velazquez E, Leijenaar R, Carvalho S, van Stiphout RG, Granton P, et al. Radiomics: extracting more information from medical images using advanced feature analysis. Eur J Cancer. 2012;48:441–6.
3. Hatt M, Tixier F, Pierce L, Kinahan PE, Le Rest CC, Visvikis D. Characterization of PET/CT images using texture analysis: the past, the present… any future? Eur. J. Nucl. Med. Mol. Imaging. 2017;44:151–65.
4. Parmar C, Grossmann P, Bussink J, Lambin P, Aerts HJWL. Machine Learning methods for Quantitative Radiomic Biomarkers. Sci. Rep. 2015;5:13087.
5. van Velden FH, Cheebsumon P, Yaqub M, Smit EF, Hoekstra OS, Lammertsma AA, et al. Evaluation of a cumulative SUV-volume histogram method for parameterizing heterogeneous intratumoural FDG uptake in non-small cell lung cancer PET studies. Eur J Nucl Med Mol Imaging. 2011;38:1636–47. 6. Tixier F, Le Rest CC, Hatt M, Albarghach N, Pradier O, Metges JP, et al. Intratumor heterogeneity characterized by textural features on baseline 18F-FDG PET images predicts response to concomitant radiochemotherapy in esophageal cancer. J Nucl Med. 2011;52:369–78.
7. Apostolova I, Rogasch J, Buchert R, Wertzel H, Achenbach HJ, Schreiber J, et al. Quantitative assessment of the asphericity of pretherapeutic FDG uptake as an independent predictor of outcome in NSCLC. BMC Cancer. 2014;14:896.
8. Apostolova I, Steffen IG, Wedel F, Lougovski A, Marnitz S, Derlin T, et al. Asphericity of pretherapeutic tumour FDG uptake provides independent prognostic value in head-and-neck cancer. Eur. Radiol. 2014;24:2077–87.
9. Hofheinz F, Lougovski A, Zöphel K, Hentschel M, Steffen IG, Apostolova I, et al. Increased evidence for the prognostic value of primary tumor asphericity in pretherapeutic FDG PET for risk stratification in patients with head and neck cancer. Eur. J. Nucl. Med. Mol. Imaging. 2015;42:429–37.
10. Apostolova I, Ego K, Steffen IG, Buchert R, Wertzel H, Achenbach HJ, et al. The asphericity of the metabolic tumour volume in NSCLC: correlation with histopathology and molecular markers. Eur. J. Nucl. Med. Mol. Imaging. 2016;43:2360–73.
11. Hofheinz F, Pötzsch C, Oehme L, Beuthien-Baumann B, Steinbach J, Kotzerke J, et al. Automatic volume delineation in oncological PET. Evaluation of a dedicated software tool and comparison with manual delineation in clinical data sets. Nukl. Nucl. Med. 2012;51:9–16.
12. Kim D-H, Jung J-H, Son SH, Kim C-Y, Jeong SY, Lee S-W, et al. Quantification of Intratumoral Metabolic Macroheterogeneity on 18F-FDG PET/CT and Its Prognostic Significance in Pathologic N0 Squamous Cell Lung Carcinoma. Clin. Nucl. Med. 2016;41:e70-75.
13. Ben Bouallègue F, Al Tabaa Y, Kafrouni M, Cartron G, Vauchot F, Mariano-Goulart D. Association between textural and morphological tumor indices on baseline PET-CT and early metabolic response on interim PET-CT in bulky malignant lymphomas. Med. Phys. 2017;
14. Hatt M, Cheze le Rest C, Turzo A, Roux C, Visvikis D. A fuzzy locally adaptive Bayesian segmentation approach for volume determination in PET. IEEE Trans Med Imaging. 2009;28:881–93. 15. Fayad H, Hatt M, Visvikis D. PET functional volume delineation using an Ant colony segmentation approach. J. Nucl. Med. 2015;56:1745.
16. Jaouen V, Hatt M, Fayad H, Tauber C, Visvikis D. Gradient-aided localized deformable model for PET image segmentation. Strasbourg, France; 2016.
17. Hatt M, Cheze Le Rest C, Albarghach N, Pradier O, Visvikis D. PET functional volume delineation: a robustness and repeatability study. Eur J Nucl Med Mol Imaging. 2011;38:663–72.
18. Hatt M, Lee J, Schmidtlein CR, El Naqa I, Caldwell C, De Bernardi E, et al. Classification and evaluation strategies of auto-segmentation approaches for PET: Report of AAPM Task Group No. 211. Med. Phys. 2017;
19. Berthon B, Spezi E, Galavis P, Shepherd T, Apte A, Hatt M, et al. Towards a standard for the evaluation of PET Auto-Segmentation methods: requirements and implementation. Med. Phys. 2017;in press.
20. Lorensen WE, Cline HE. Marching cubes: A high resolution 3D surface construction algorithm. ACM SIGGRAPH Comput. Graph. 1987;21:163–9.
21. Desseroit M-C, D. Visvikis, Tixier F, Majdoub M, Guillevin R, Perdrisot R, et al. Development of a nomogram combining clinical staging with 18F-FDG PET/CT image features in Non-Small Cell Lung Cancer stage I-III. Eur. J. Nucl. Med. Mol. Imaging. 2016;in press.
22. Chalkidou A, O’Doherty MJ, Marsden PK. False Discovery Rates in PET and CT Studies with Texture Features: A Systematic Review. PloS One. 2015;10:e0124165.
23. Tixier F, Hatt M, Valla C, Fleury V, Lamour C, Ezzouhri S, et al. Visual versus quantitative assessment of intratumor 18F-FDG PET uptake heterogeneity: prognostic value in non-small cell lung cancer. J. Nucl. Med. 2014;55:1235–41.
24. Orlhac F, Nioche C, Soussan M, Buvat I. Understanding Changes in Tumor Texture Indices in PET: A Comparison Between Visual Assessment and Index Values in Simulated and Patient Data. J. Nucl. Med. Off. Publ. Soc. Nucl. Med. 2017;58:387–92.
25. Hatt M, Tixier F, Visvikis D, Cheze Le Rest C. Radiomics in PET/CT: More Than Meets the Eye? J. Nucl. Med. Off. Publ. Soc. Nucl. Med. 2017;58:365–6.
26. Yip SSF, Liu Y, Parmar C, Li Q, Liu S, Qu F, et al. Associations between radiologist-defined semantic and automatically computed radiomic features in non-small cell lung cancer. Sci. Rep. 2017;7:3519. 27. van Velden FHP, Kramer GM, Frings V, Nissen IA, Mulder ER, de Langen AJ, et al. Repeatability of Radiomic Features in Non-Small-Cell Lung Cancer [(18)F]FDG-PET/CT Studies: Impact of Reconstruction and Delineation. Mol. Imaging Biol. MIB Off. Publ. Acad. Mol. Imaging. 2016;
28. Desseroit M-C, Tixier F, Weber WA, Siegel BA, Cheze Le Rest C, Visvikis D, et al. Reliability of PET/CT Shape and Heterogeneity Features in Functional and Morphologic Components of Non-Small Cell Lung Cancer Tumors: A Repeatability Analysis in a Prospective Multicenter Cohort. J. Nucl. Med. Off. Publ. Soc. Nucl. Med. 2017;58:406–11.
29. Leijenaar RTH, Carvalho S, Velazquez ER, van Elmpt WJC, Parmar C, Hoekstra OS, et al. Stability of FDG-PET Radiomics features: an integrated analysis of test-retest and inter-observer variability. Acta Oncol. Stockh. Swed. 2013;52:1391–7.
30. Hatt M, Visvikis D, Albarghach NM, Tixier F, Pradier O, Cheze-le Rest C. Prognostic value of 18F-FDG PET image-based parameters in oesophageal cancer and impact of tumour delineation methodology. Eur J Nucl Med Mol Imaging. 2011;38:1191–202.
31. Grove O, Berglund AE, Schabath MB, Aerts HJWL, Dekker A, Wang H, et al. Quantitative computed tomographic descriptors associate tumor shape complexity and intratumor heterogeneity with prognosis in lung adenocarcinoma. PloS One. 2015;10:e0118261.
Table 1: The dataset containing 176 PET images with ground-truth Type of PET images Associated ground-truth Details Synthetic and realistic
simulated images
Voxel-based from the simulated object
14 synthetic images.
12 images simulated with GATE. 50 images simulated with SIMSET. Physical phantom
acquisitions
Volumes derived through thresholding of the associated high resolution CT
Different acquisitions of a physical phantom containing 11 zeolites (no cold walls) of various shapes and sizes (total 75 images).
Clinical images Digitized reconstructed volumes from histopathology slices.
19 images of head and neck or lung tumors with associated histopathology volumetric measurements.
Clinical images Statistical consensus of 3 different manual contours by 3 experts.
6 images of lung tumors with consensus of manual delineations by 3 experts.
Table 2: Patients characteristics
Characteristic
No. of
patients
(N=87)
Gender
Male
69
Female
18
Age (y)
Range
48-84
Mean + SD
63±8
Treatment
Surgery only
10
Chemotherapy only
12
Radiotherapy only
0
Surgery + chemotherapy
14
Surgery + radiotherapy
1
Chemotherapy + radiotherapy
41
Chemotherapy + radiotherapy + surgery 9
Clinical stage IIA
12
IIB
18
IIIA
30
Table 3. Stratification of patients into 2 groups using volume, sphericity or both derived by each segmentation. Segmentation methods Volume (cm3) threshold Sphericity threshold
Stratification using volume Stratification using sphericity Stratification using volume and sphericity Median OS Hazard ratio Log-rank p-value Median OS Hazard ratio Log-rank p-value Median OS Hazard ratio Log-rank p-value 1st group 2nd group 1st group 2nd group 1st group 2nd group ACO > 42.2 ≤ 0.831 41.9 (n=29) 12.5 (n=58) 2.48 0.0009 28.0 (n=35) 13.1 (n=52) 1.96 0.0091 25.1 (n=41) 12.4 (n=46) 2.02 0.0043 FLAB > 35.8 ≤ 0.845 27.9 (n=43) 9.9 (n=44) 2.45 0.0002 41.9 (n=25) 13.1 (n=62) 2.50 0.0020 27.9 (n=46) 9.1 (n=41) 2.67 <0.0001 GARAC > 44.9 ≤ 0.883 31.3 (n=29) 13.1 (n=58) 2.31 0.0025 17.6 (n=16) 14.9 (n=71) 1.72 0.1243 30.4 (n=33) 13.4 (n=54) 2.13 0.0044 T40 > 21.1 ≤ 0.819 30.4 (n=30) 13.1 (n=57) 2.10 0.0055 25.1 (n=30) 14.3 (n=57) 1.81 0.0291 17.6 (n=46) 12.5 (n=41) 1.84 0.0119 T50 > 15.6 ≤ 0.801 30.4 (n=35) 10.8 (n=52) 2.26 0.0013 23.0 (n=31) 14.1 (n=56) 1.75 0.0376 17.6 (n=58) 9.1 (n=27) 1.99 0.0051
3.6 cm3 – S=0.555 0.6 cm3 - S=0.902 103 cm3 – S=0.503 195 cm3 – S=0.861
2.9 cm3 – S=0.725 0.6 cm3 – S=0.846 4.5 cm3 – S=0.722 4.2 cm3 – S=0.815
0.1 cm3 – S=0.660 0.4 cm3 – S=0.835 25.7 cm3 – S=0.563 43.8 cm3 – S=0.771
Figure legends
Figure 1: Distributions of sphericity and volume for each dataset.
Figure 2: Visual examples with ground-truth (green contour) volume and sphericity values. First row
are simulated images, second row are zeolites from phantom acquisitions and third row are clinical images with contours from either consensus of manual delineation (first two images on the left) or digitized histopathology slices (two images on the right).
Figure 3: Sphericity-volume scatter diagrams in the first dataset for (a) ground-truth and (b-f) the
segmentation methods: (b) ACO, (c) FLAB, (d) GARAC, (e) T40 and (f) T50.
Figure 4: (a, c) Segmentation accuracy and (b, d) sphericity measurement error for all segmentation
methods. (a, b) show results for each data category, whereas (c, d) show results for the entire dataset. (b) presents absolute errors (showing no significant differences), whereas (d) shows relative errors to highlight the bias of GARAC towards overestimation.
Figure 5: Scatter diagrams and Spearman rank correlations (ρ) between the segmentation accuracy
and the corresponding sphericity absolute error for (a) ACO, (b) FLAB, (c) GARAC, (d) T40 and (e) T50.
Figure 6: Scatter diagrams and Spearman rank correlations (ρ) between the volume and the
corresponding sphericity absolute error for (a) ACO, (b) FLAB, (c) GARAC, (d) T40 and (e) T50.
Figure 7: Kaplan-meier curves for OS stratification into two groups using volume and sphericity as
determined by (a) ACO, (b) FLAB, (c) GARAC, (d) T40 and (e) T50.
Figure 8: Kaplan-meier curves for OS stratification into 3 groups obtained using volume and
sphericity as determined by (a) ACO, (b) FLAB, (c) GARAC, (d) T40 and (e) T50. Hazard ratios are listed for group 1 vs. 2, 2 vs. 3 and 1 vs. 3.