Publisher’s version / Version de l'éditeur:
Vous avez des questions? Nous pouvons vous aider. Pour communiquer directement avec un auteur, consultez la première page de la revue dans laquelle son article a été publié afin de trouver ses coordonnées. Si vous n’arrivez pas à les repérer, communiquez avec nous à PublicationsArchive-ArchivesPublications@nrc-cnrc.gc.ca.
Questions? Contact the NRC Publications Archive team at
PublicationsArchive-ArchivesPublications@nrc-cnrc.gc.ca. If you wish to email the authors directly, please see the first page of the publication for their contact information.
https://publications-cnrc.canada.ca/fra/droits
L’accès à ce site Web et l’utilisation de son contenu sont assujettis aux conditions présentées dans le site LISEZ CES CONDITIONS ATTENTIVEMENT AVANT D’UTILISER CE SITE WEB.
8th Canadian Marine Hydromechanics and Structures Conference [Proceedings], 2007
READ THESE TERMS AND CONDITIONS CAREFULLY BEFORE USING THIS WEBSITE. https://nrc-publications.canada.ca/eng/copyright
NRC Publications Archive Record / Notice des Archives des publications du CNRC : https://nrc-publications.canada.ca/eng/view/object/?id=72fbbd67-3848-465e-be2f-89658ec92ea9 https://publications-cnrc.canada.ca/fra/voir/objet/?id=72fbbd67-3848-465e-be2f-89658ec92ea9
NRC Publications Archive
Archives des publications du CNRC
This publication could be one of several versions: author’s original, accepted manuscript or the publisher’s version. / La version de cette publication peut être l’une des suivantes : la version prépublication de l’auteur, la version acceptée du manuscrit ou la version de l’éditeur.
Access and use of this website and the material on it are subject to the Terms and Conditions set forth at
LDA experiments - flow characterization of the NRC-IOT cavitation and water re-circulation tunnel
LDA Experiments – Flow Characterization of the NRC-IOT Cavitation
and Water Re-circulating Tunnel
Ahmed Derradji-Aouat (1),, Joel T. Park (2), and Darrel Sparkes (1),
(1),
National Research Council of Canada, Institute for Ocean Technology, NL, Canada; (2),
Naval Surface Warfare Center Carderock Division, Maryland, USA
Keywords: LDA, LDV, flow velocity, cavitation tank, water tunnel, uncertainty analysis
Introduction
Flow characterization experiments were conducted at the NRC-IOT cavitation and water re-circulating tunnel http://iot-ito.nrc-cnrc.gc.ca/. These experiments were a part of a task for the 25th ITTC Uncertainty Analysis Committee (http://ittc.sname.org/). Flow characteristics of the test section were measured with a two-component Dantec LDA (Laser Doppler Anemometer) system. The fibre-optic head of the LDA was mounted on a 3-dimensional traversing system. The long term temporal velocity stability at various tunnel velocities was measured at the centerline of the test section over a time period of about 100 to 120 minutes. The spatial variation across the test section (velocity uniformity) was also measured via LDA profile sweeps. All 3-velocity components were measured using the LDA head looking from the bottom and from the side windows of the test section. From the bottom window of the test section, the axial and transverse veloc-ity components (x and y velocities) were measured. From the side window, however, the axial and vertical velocity components were measured (x and z velocities). Together, LDA measurements from the bottom and the side windows provide a 3-D volumetric wa-ter velocity profile in the test section.
The experiments were conducted at the center of the forward window in the test section. Tests for two different water nominal speeds were completed (1.6 m/s & 6.0 m/s, in the test section). These speeds are typical of low and medium tunnel testing speeds. It is aimed that high water speed experiments (> 9 m/s) are to be conducted in future dates.
All experiments at the center of the test window were repeated at distances of ± 250 mm (“aft” and “fwd” tests).
In this paper, the results of this experimental work are reported. Velocity Tempo-ral Stability (VTS) and Velocity Spatial Uniformity (VSU) results are provided. A com-parison between the present NRC-IOT test results and those from much larger cavitation tunnels (in Japan and the US) is provided.
NRC-IOT Cavitation and Water Circulating Tunnel - Descriptions and History
In 1956, The National Research Council of Canada acquired a cavitation tunnel from Kempf and Remmers, a German manufacturer. Its engineering design work goes back to 1955, and various documents indicate that actual commissioning tests were per-formed at the NRC Ottawa in 1956 and 1957.
In 1984, the tunnel was dismantled and moved from Ottawa to NRC-IOT (in St. John’s, NL). Since then, the tunnel underwent through several major upgrades. This in-cluded the control system, the Data Acquisition System (DAS), the 6-component dyna-mometer, the opens-boat apparatus, and the Dantec LDA components and software.
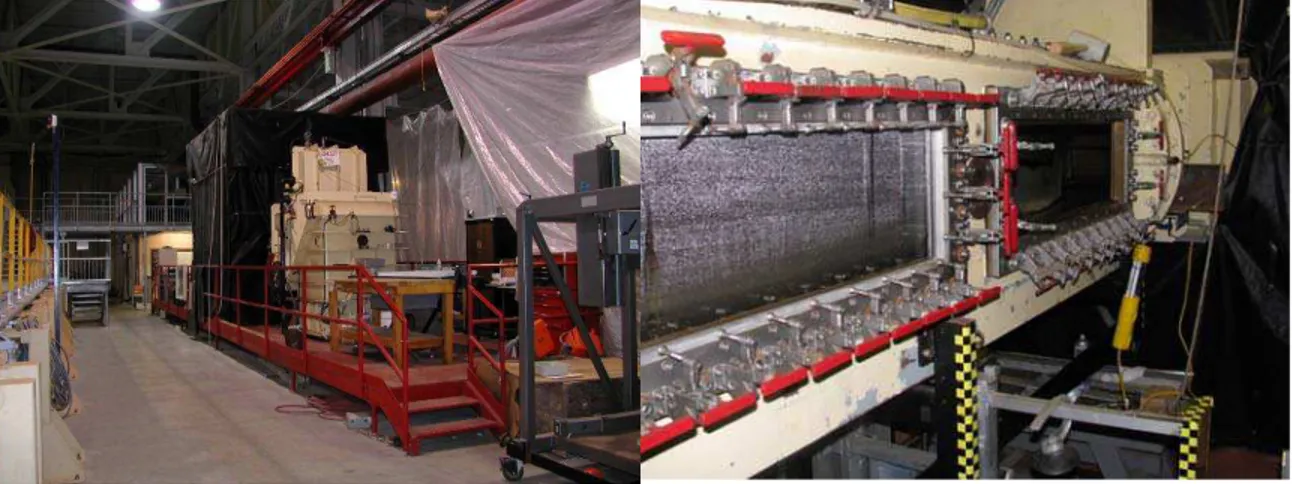
a) General View b) Test Section Figure 2: The NRC-IOT Cavitation Tank
Laneville et al (2005) presented a detailed history of the NRC-IOT K-09 Cavita-tion and Water Tunnel. They reported that in 1956 and 1957, Kempf and Remmers
plied 4 identical water tunnels to various clients (test section 500 mm X 500 mm and maximum water speed of 11 m/s). They are:
i) K-08 for Vosper Ltd., Portsmouth, England
ii) K-09 for NRC, Ottawa, Canada
iii) K-10 for Ship-Model Research Institute, Zagreb (former Yugoslavia)
iv) K-12 for Statens Skepps oprovning sanstalt, Goteborg, Sweden.
v)
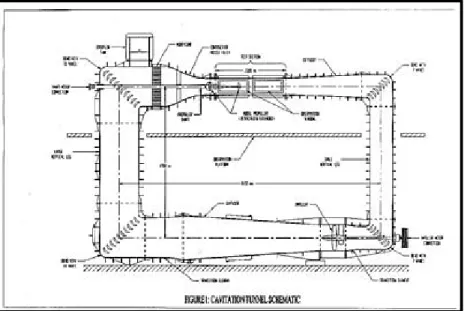
The tunnel is designed for maximum flow velocity (in the 500 mm X 500 mm test section) of 11 m/s, although historically experimental work at the NRC-IOT is limited to a maximum of 9 m/s). A sketch for the K09 engineering design is given in Fig. 1, and pictures of the tunnel (as it stands at NRC-IOT now) are given in Fig. 2. The tunnel is made up of 5 mm thick steel sheets assembled by welding; it is divided into 14 sections. The inlet and outlet of each section are identified by numbers, the inlet of the impeller section is given number 1. Doucet (1999) conducted a feasibility study for building a lar-ger water tunnel at the NRC-IOT.
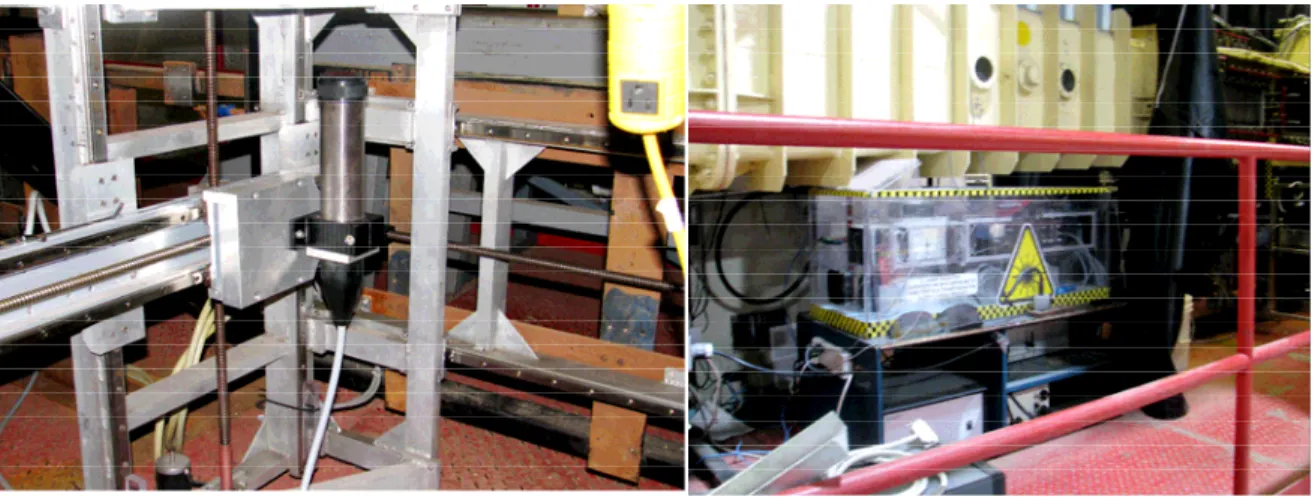
a) LDA Head & Traversing System b) Dantec LDA Laser & Processor. Figure 3: The NRC-IOT Dantec LDA system
Flow Characterization Experiments
The present test program required running tests using empty tunnel condition (no model in the test section) at various water velocities. The long-term temporal velocity and stability at various tunnel velocities were measured at the centerline of the test section over a time period of about 100 to 120 minutes. The spatial variation across the test sec-tion “or velocity uniformity” was also measured and analyzed
The two LDA head positions considered are: 1) the LDA head is installed under the bottom window of the test section, and it is pointing upwards (Z direction), and 2) the LDA head is installed on the outside of the side window of the test section, and it is pointing across the test section (Y direction).
CMHSC-2007 – LDA Experiments – Derradji Aouat, Park, and Sparks
4
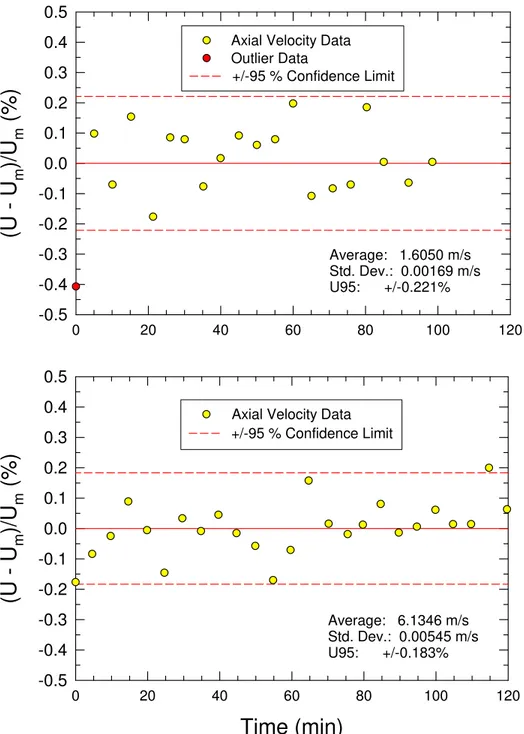
Figure 4. Temporal Stability of Test Section Axial Velocity
Flow velocities in the test section of the tank were measured with a two-component Dantec LDA system (Fig 3). In the case where the LDA head was mounted under the bottom window, both axial and lateral (X and Y) velocities of the water were measured. In the case where the LDA head was mounted laterally, both axial and vertical (X and Z) velocities of the water were measured. Consequently, by combining the results of experiments from the bottom window with those from the side window, 3-D velocity measurements are obtained.
Time (min)
0 20 40 60 80 100 120(U
- U
m)/U
m(%)
-0.5 -0.4 -0.3 -0.2 -0.1 0.0 0.1 0.2 0.3 0.4 0.5Axial Velocity Data Outlier Data +/-95 % Confidence Limit Average: 1 Std. Dev.: 0. U95: +/-0. .6050 m/s 00169 m/s 221%
Time (min)
0 20 40 60 80 100 120(U - U
m)/U
m(%)
-0.5 -0.4 -0.3 -0.2 -0.1 0.0 0.1 0.2 0.3 0.4 0.5 Average: 6. Std. Dev.: 0 U95: +/-0 1346 m/s .00545 m/s .183% Axial Velocity Data+/-95 % Confidence Limit 8th Canadian Marine Hydromechanics and Structures Conference, 16-17 October 2007, St. John's, NL
Since the head of the LDA can be mounted on a traversing system (meaning the LDA head can move back and forth, Fig. 3), experiments that target area velocity con-tours (velocities for X-Y concon-tours, and/or velocities for X-Z concon-tours) can be conducted. By combining the results of velocity contour experiments from the bottom win-dow with those from the side winwin-dow, complete 3-D velocity volumetric iso-profiles can be obtained (although now-days, 3-D LDA systems are commercially available)
The analysis of the results from the centerline tests will provide information re-garding long-term temporal velocity stability at various tunnel velocities. However, the profile test results will provide information regarding the spatial variation across the test section “or velocity uniformity”.
Tests Matrix and Testing Objectives
Two different velocities were completed (1.5 m/s and 6.0 m/s). Tests for 9 m/s are planned for future phases of the project. It is hypothesized that water velocities of 1.5 m/s and 6.0 m/s are representative for low and medium water speed tests, respectively. Veloc-ity of 9 m/s is considered high-speed water tests.
Table 1: Test Matrix Centre Line Experiments Section Profiles
Bottom-up Side In Bottom-up Side In 1.50 m/s 1.50 m/s 1.50 m/s 1.50 m/s
6.0 m/s 6.0 m/s 6.0 m/s 6.0 m/s
The test program (Table 1) required measurements of flow velocities for 1000 to 2000 data point (target sampling rate was 100 to 200 Hz.), wait for 5 minutes, and then collect another 1000 to 2000 data points. This processes is repeated for at least 20 times. Note that it takes several seconds to collect the required 1000 to 2000 data points (thus averaged and mean flow values are realistic). For example, the total time needed for a centreline test is 20 times 5 minutes (almost 2 hours per test).
The time histories for each test segment (1000 to 2000 data points) were recorded; their mean value and standard deviation were obtained. Thus, the overall final output from a test is 20 mean data points and their corresponding 20 standard deviations (each spaced about 5 minutes apart). Figures 4 shows typical results from the 20 mean data points.
For the profile experiments (LDA sweeps), the LDA head was programmed to move on the traversing system (Fig. 3). Tests on a grid of about 300 points were con-ducted, and for each point of the grid, 1000 to 2000 measurements were collected. If the LDA head changed position every 5 minutes, one sweep tests lasts about 5 hours.
Test Results and Discussion
`Temporal Velocity Stability
The results for set points of 1.5 and 6.0 m/s are presented in Fig 4 for measure-ments through the floor of the test section. As the figure indicates, the data are randomly scattered about the mean value over the total time interval of the measurement. For the velocity at the set point of 1.5 m/s, the measured velocity was 1.6050 ±0.0035 m/s (±0.22 %) at the 95 % confidence limit, while for the 6.0 m/s set point the velocity was 6.1346 ±0.0054 m/s (±0.18 %).
In both cases, the measured velocity was 0.1 m/s higher than the set point. The source of the difference is probably lack of calibration of the pressure transducer for the dynamic pressure measurement (or an error in the control algorithm).
Velocity Spatial Uniformity
Velocity profiles were measured at 3 locations in the test section with 250 mm be-tween each profile. At each station, the profiles were measured through a side window and bottom window. With this combination of measurements, all 3-velocity components were measured: U (axial), V (transverse), and W (vertical). The measurement area was 200 x 485.3 mm or 38.8 % of the tunnel cross-sectional area. The grid size was 20 x 19.4 mm with the 19.4 mm dimension along the probe axis. Velocity was measured at a total of 288 points. The velocity at each point was computed from a time series of approxi-mately 1000 points. The results of the measurements are summarized in Table 2.
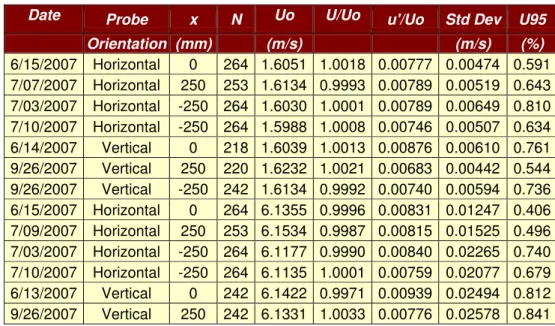
The results in Table 1 are for measurements outside the boundary layer. Table 2a gives a summary for the axial velocity component and it includes the number of spatial data points used in the statistics (N). From the last column of the table, the range of val-ues for the test section velocity uniformity is between 0.41 and 0.84 % at the 95 % confi-dence level.
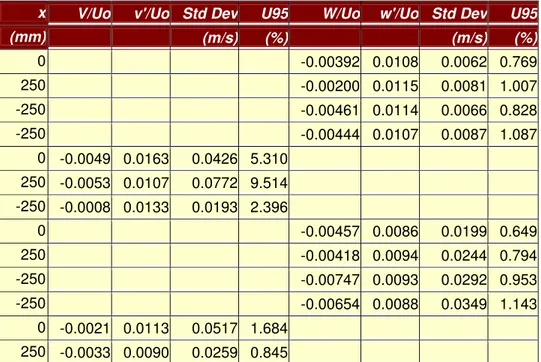
Similar data are included in Table 2b for the velocity components normal to the axial velocity. The results for the relative turbulence intensities, v’/Uo and w’/Uo, are similar to those for the axial component. The spatial variation in velocity for the vertical component is similar to the axial, where the range of values is 0.65 to 1.1 %. For some reason, the values for the traverse component, V/Uo, are high with a range of 0.84 to 9.5 %. Values above 2 % are likely an instrument noise problem related to location of the probe. A beam blocker may be required for beams reflected back into the probe.
Table 2 contains the average relative turbulence intensity (u’/Uo) outside the boundary layer. Typically, this value is 1 % or less. This value is a measure of the noise level of the LDA (and not the test section turbulence). For a good water tunnel, the rela-tive turbulence intensity is about 0.1 to 0.2 %.
7
a) Axial Velocity Profile b) Axial Relative Turbulence Intensity
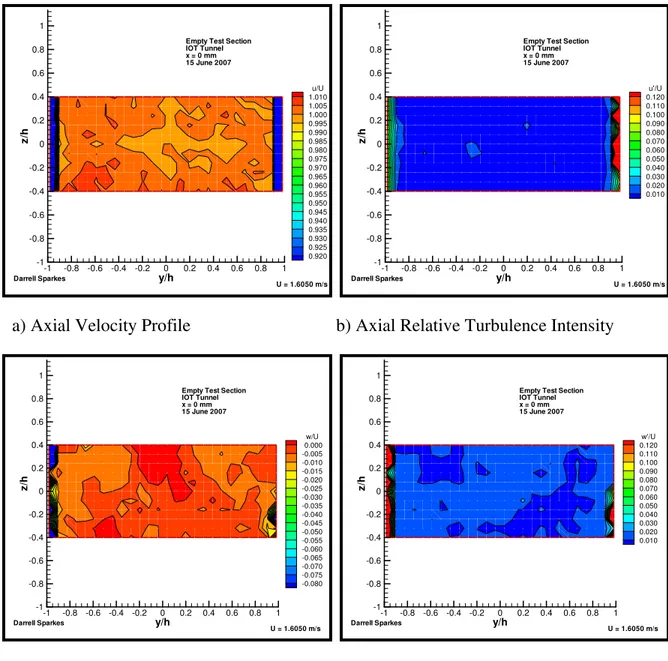
c) Vertical Velocity Profile d) Vertical Relative Turbulence Intensity Figure 5. Velocity Profiles at 1.5 m/s from Side Window
Contour plots for one test condition at the center profile for a tunnel set point of 1.5 m/s are shown in Figs. 5 and 6 (for vertical and lateral LDA head positions, respec-tively). The location of the wall boundary is quite evident in these plots, particularly for the relative turbulence intensity. The values are highest near the wall. The velocity gra-dient is also evident for the axial profiles.
Figure 6 has the axial and vertical velocity contour plots for the measurements through the side window. The variation in the colors outside the boundary layer is an
in-y/h z/ h -1 -0.8 -0.6 -0.4 -0.2 0 0.2 0.4 0.6 0.8 1 -1 -0.8 -0.6 -0.4 -0.2 0 0.2 0.4 0.6 0.8 1 u/U 1.010 1.005 1.000 0.995 0.990 0.985 0.980 0.975 0.970 0.965 0.960 0.955 0.950 0.945 0.940 0.935 0.930 0.925 0.920
Empty Test Section IOT Tunnel x = 0 mm 15 June 2007 Darrell Sparkes U = 1.6050 m/s 0.8 0.6 y/h z/ h -1 -0.8 -0.6 -0.4 -0.2 0 0.2 0.4 0.6 0.8 1 -1 -0.8 -0.6 -0.4 -0.2 0 0.2 0.4 1 u'/U 0.120 0.110 0.100 0.090 0.080 0.070 0.060 0.050 0.040 0.030 0.020 0.010
Empty Test Section IOT Tunnel x = 0 mm 15 June 2007 Darrell Sparkes U = 1.6050 m/s y/h z/ h -1 -0.8 -0.6 -0.4 -0.2 0 0.2 0.4 0.6 0.8 1 -1 -0.8 -0.6 -0.4 -0.2 0 0.2 0.4 0.6 0.8 1 w/U 0.000 -0.005 -0.010 -0.015 -0.020 -0.025 -0.030 -0.035 -0.040 -0.045 -0.050 -0.055 -0.060 -0.065 -0.070 -0.075 -0.080
Empty Test Section IOT Tunnel x = 0 mm 15 June 2007 Darrell Sparkes U = 1.6050 m/s y/h z/ h -1 -0.8 -0.6 -0.4 -0.2 0 0.2 -1 -0.8 -0.6 -0.4 -0.2 0 0.2 0.4 0.6 0.8 1 0.4 Empty IOT T x = 0 15 Ju Darrell Sparkes w'/U 0.120 0.110 0.100 0.090 0.080 0.070 0.060 0.050 0.040 0.030 0.020 0.010 0.6 0.8 1 Test Section unnel mm ne 2007 U = 1.6050 m/s
CMHSC-2007 – LDA Experiments – Derradji Aouat, Park, and Sparks
8
dication of the velocity uniformity. These results are similar to those previously de-scribed by Mori et al (2007) and Park et al. (2005).
a) Axial Velocity Profile b) Axial Relative Turbulence Intensity
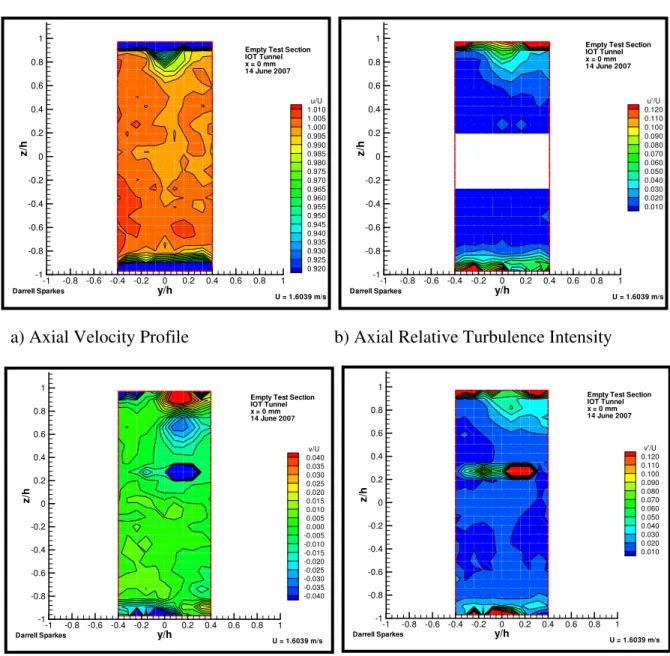
c) Transverse Velocity Profile d) Transverse Relative Turbulence Intensity Figure 6 Velocity Profiles at 1.5 m/s from Bottom Window
For this particular case (in Fig 6), the results from the bottom window for the ax-ial and transverse velocities, U and V, in are quite different. In particular, the boundary layer at the top of the test section in the figure has a noticeable bulge. This bulge is caused by a vortex that is indicated in Figs 6c and 6d. This phenomenon also appears in the 6.0 m/s data, which were acquired at the same time. This feature disappeared in sub-sequent tests (2 months after the first set of tests was completed).
y/h z/ h -1 -0.8 -0.6 -0.4 -0.2 0 0.2 0.4 0.6 0.8 1 -1 -0.8 -0.6 -0.4 -0.2 0 0.2 0.4 0.6 0.8 1 u/U 1.010 1.005 1.000 0.995 0.990 0.985 0.980 0.975 0.970 0.965 0.960 0.955 0.950 0.945 0.940 0.935 0.930 0.925 0.920
Empty Test Section IOT Tunnel x = 0 mm 14 June 2007 Darrell Sparkes U = 1.6039 m/s y/h z/ h -1 -0.8 -0.6 -0.4 -0.2 0 0.2 -1 -0.8 -0.6 -0.4 -0.2 0 0.2 0.4 0.6 0.8 1 u'/U 0.120 0.110 0.100 0.090 0.080 0.070 0.060 0.050 0.040 0.030 0.020 0.010 0.4 0.6 0.8 1
Empty Test Section IOT Tunnel x = 0 mm 14 June 2007 U = 1.6039 m/s Darrell Sparkes y/h z/ h -1 -0.8 -0.6 -0.4 -0.2 0 0.2 0.4 0.6 0.8 1 -1 -0.8 -0.6 -0.4 -0.2 0 0.2 0.4 0.6 0.8 1 v/U 0.040 0.035 0.030 0.025 0.020 0.015 0.010 0.005 0.000 -0.005 -0.010 -0.015 -0.020 -0.025 -0.030 -0.035 -0.040
Empty Test Section IOT Tunnel x = 0 mm 14 June 2007 Darrell Sparkes U = 1.6039 m/s y/h z/ h -1 -0.8 -0.6 -0.4 -0.2 0 0.2 -1 -0.8 -0.6 -0.4 -0.2 0 0.2 0.4 0.6 0.8 1 v'/U 0.120 0.110 0.100 0.090 0.080 0.070 0.060 0.050 0.040 0.030 0.020 0.010 0.4 0.6 0.8 1
Empty Test Section IOT Tunnel x = 0 mm 14 June 2007
U = 1.6039 m/s Darrell Sparkes
Another anomaly that is apparent in the transverse velocity only appears in Fig 5c and 5d at slightly above the centerline. At y/h = 0.27, three (3) points have a value of over 20 % for the relative turbulence intensity when the neighbouring points have values near 1 %. Clearly, these high values are not associated with the flow and are noise in the LDA system apparently due to reflections from the window.
Table 2a: Spatial Uniformity of Axial Velocity, U
Conclusions
These results demonstrate that the IOT tunnel has relatively high quality flow characteristics similar to other water tunnels, such as the LCC (Large Cavitation Channel in the US). The long-term velocity stability of the tunnel is between ±0.18 and ±0.22 % at the 95 % confidence level for velocities of 1.6 and 6.1 m/s for duration of 100 to 120 minutes in comparison to ±0.15 % from Park, et al (2005). The long-term stability is suf-ficiently low that it has minimal influence on the measurement of the spatial variation of the velocity.
The spatial variation of axial velocity is between ±0.41 and ±084 % in compari-son to ±0.34 to ±0.6 % from Park, et al. (2005). Mori, al. (2007) have reported a varia-tion of ±1 %. For the vertical velocity, the non-uniformity in the IOT tunnel is between ±0.65 and ±1.1 % in comparison ±1.8 to ±2.3 % from Park, et al. (2005). The high vari-ability in the transverse component for the IOT tunnel appears to be an LDA noise prob-lem.
Some of the spatial variation in velocity from Mori, et al. (2007) seems to be caused by imperfections in the windows. The spatial variation was different when meas-ured from each side of the tunnel. Such a possibility may exist in the work of Park, et al. (2007). The thinner windows in the IOT tunnel may have less effect.
Date Probe x N Uo U/Uo u'/Uo Std Dev U95
Orientation (mm) (m/s) (m/s) (%) 6/15/2007 Horizontal 0 264 1.6051 1.0018 0.00777 0.00474 0.591 7/07/2007 Horizontal 250 253 1.6134 0.9993 0.00789 0.00519 0.643 7/03/2007 Horizontal -250 264 1.6030 1.0001 0.00789 0.00649 0.810 7/10/2007 Horizontal -250 264 1.5988 1.0008 0.00746 0.00507 0.634 6/14/2007 Vertical 0 218 1.6039 1.0013 0.00876 0.00610 0.761 9/26/2007 Vertical 250 220 1.6232 1.0021 0.00683 0.00442 0.544 9/26/2007 Vertical -250 242 1.6134 0.9992 0.00740 0.00594 0.736 6/15/2007 Horizontal 0 264 6.1355 0.9996 0.00831 0.01247 0.406 7/09/2007 Horizontal 250 253 6.1534 0.9987 0.00815 0.01525 0.496 7/03/2007 Horizontal -250 264 6.1177 0.9990 0.00840 0.02265 0.740 7/10/2007 Horizontal -250 264 6.1135 1.0001 0.00759 0.02077 0.679 6/13/2007 Vertical 0 242 6.1422 0.9971 0.00939 0.02494 0.812 9/26/2007 Vertical 250 242 6.1331 1.0033 0.00776 0.02578 0.841
CMHSC-2007 – LDA Experiments – Derradji Aouat, Park, and Sparks
10
Table 1b: Spatial Uniformity of Transverse, V, and Vertical, W, Velocities
A vortex flow appears near the top of the test section for the IOT tunnel at both velocities. This vortex did not occur in subsequent measurements. The cause should be investigated so that this flow disturbance does not re-appear in the future.
Finally, the mean axial velocities at set points of 1.5 and 6.0 m/s are higher by 0.1 m/s as measured by the LDA system. This discrepancy should be investigated. The cali-bration of the differential pressure transducer for the tunnel set point should be checked, and the control system algorithm should be reviewed. A differential pressure measure-ment will not be reliable at low pressures. A digitally controlled shaft speed on the pump may provide a more stable flow, particularly at very low speeds.
References
• Doucet M. (1999): Cavitation Tunnel Feasibility Study. NRC-IOT. CR 1999 12 • Laneville A. and Williams C.D. (2005). The Cavitation and Water Recalculating
Tunnel of the NRC-IOT. IOT Report
• Mori, Takayuki, Naganuma, Kenji, Kimoto, Risa, Yakushiji, Ryo, and Nagaya, Shigeki, 2007, “Hydrodynamic and Hydroacoustic Characteristics of the Flow Noise Simulator,” ASME Paper FEDSM2007-37531, 5th ASME/JSME Joint Flu-ids Engineering Conference, San Diego, American Society of Mechanical Engi-neers, New York.
• Park, Joel T., Cutbirth, J. Michael, and Brewer, Weseley H., 2005, “Experimental Methods for Hydrodynamic Characterization of a Very Large Water Tunnel,” Journal of Fluids Engineering, Vol. 127, No. 6, pp. 1210-1214
x V/Uo v'/Uo Std Dev U95 W/Uo w'/Uo Std Dev U95
(mm) (m/s) (%) (m/s) (%) 0 -0.00392 0.0108 0.0062 0.769 250 -0.00200 0.0115 0.0081 1.007 -250 -0.00461 0.0114 0.0066 0.828 -250 -0.00444 0.0107 0.0087 1.087 0 -0.0049 0.0163 0.0426 5.310 250 -0.0053 0.0107 0.0772 9.514 -250 -0.0008 0.0133 0.0193 2.396 0 -0.00457 0.0086 0.0199 0.649 250 -0.00418 0.0094 0.0244 0.794 -250 -0.00747 0.0093 0.0292 0.953 -250 -0.00654 0.0088 0.0349 1.143 0 -0.0021 0.0113 0.0517 1.684 250 -0.0033 0.0090 0.0259 0.845