This paper is available online free of all access charges (see http://jxb.oxfordjournals.org/open_access.html for further details)
RESEARCH PAPER
Cavitation and water fluxes driven by ice water potential in
Juglans regia during freeze–thaw cycles
Katline Charra-Vaskoua,b,*, Eric Badela,b, Guillaume Charrierc, Alexandre Ponomarenkoa,b, Marc Bonhommea,b, Loïc Foucatd, Stefan Mayrc and Thierry Améglioa,b
a INRA, UMR PIAF, F-63100 Clermont-Ferrand, France
b Clermont Université, Blaise Pascal University, UMR PIAF, F-63100 Clermont-Ferrand, France c Department of Botany, University of Innsbruck, A-6020 Innsbruck, Austria
d INRA UR BIA, F-44316 Nantes, France
* To whom correspondence should be addressed. E-mail: katline.charravaskou@gmail.com Received 12 June 2015; Revised 6 October 2015; Accepted 21 October 2015
Editor: Jeremy Pritchard, University of Birmingham
Abstract
Freeze–thaw cycles induce major hydraulic changes due to liquid-to-ice transition within tree stems. The very low water potential at the ice–liquid interface is crucial as it may cause lysis of living cells as well as water fluxes and embolism in sap conduits, which impacts whole tree–water relations. We investigated water fluxes induced by ice formation during freeze–thaw cycles in Juglans regia L. stems using four non-invasive and complementary approaches: a microdendrometer, magnetic resonance imaging, X-ray microtomography, and ultrasonic acous-tic emissions analysis. When the temperature dropped, ice nucleation occurred, probably in the cambium or pith areas, inducing high water potential gradients within the stem. The water was therefore redistributed within the stem toward the ice front. We could thus observe dehydration of the bark’s living cells leading to drastic shrink-age of this tissue, as well as high tension within wood conduits reaching the cavitation threshold in sap vessels. Ultrasonic emissions, which were strictly emitted only during freezing, indicated cavitation events (i.e. bubble for-mation) following ice formation in the xylem sap. However, embolism formation (i.e. bubble expansion) in stems was observed only on thawing via X-ray microtomography for the first time on the same sample. Ultrasonic emissions were detected during freezing and were not directly related to embolism formation. These results provide new insights into the complex process and dynamics of water movements and ice formation during freeze–thaw cycles in tree stems.
Key words: Acoustic emissions, bark shrinkage, embolism, Juglans regia L., microdendrometer, walnut tree, winter biology,
X-ray microtomography.
Introduction
Freezing events are a limiting factor for plant survival and distribution in temperate, alpine, and boreal biomes (Sakai and Larcher, 1987; Charrier et al., 2013a). Injuries generated
by freezing temperatures can cause the death of plants (Burke et al., 1976; Sakai and Larcher, 1987; Cinotti, 1989;
Charrier et al., 2015a) or impair their reproductive success
© The Author 2015. Published by Oxford University Press on behalf of the Society for Experimental Biology.
This is an Open Access article distributed under the terms of the Creative Commons Attribution License (http://creativecommons.org/licenses/by/3.0/), which permits unrestricted reuse, distribution, and reproduction in any medium, provided the original work is properly cited.
(Rodrigo, 2000; Chuine and Beaubien, 2001). In trees, typi-cally two types of damage can be generated by freeze–thaw stress, which affect the hydraulic integrity (Charrier et al., 2013a) and survival (Sakai and Larcher, 1987; Neuner and Pramsohler, 2006; Hacker and Neuner, 2008) of the plant: vessel embolism (Utsumi et al., 1999; Feild and Brodribb, 2001; Cruiziat et al., 2002; Ball et al., 2006) and lysis of living cells (Mazur, 1984; Charrier et al., 2013b).
Ice nucleation creates a high water driving force toward the ice front, inducing major water fluxes within the stem (Palta et al., 1977; Cinotti, 1989, 1991; Steponkus and Webb, 1992) or leaf (Ball et al., 2006). The very low water potential (Ψ) of ice at any given freezing temperature can be calculated from the Clausius–Clapeyron relationship (Rajashekar and Burke, 1982; Rajashekar et al., 1983; Guy, 1990):
∆ΨT = –1.16T (1)
where ΔΨT (MPa) is the difference in Ψ between two com-partments at temperature T, and where T (° C) is the tempera-ture below the effective freezing point. This equation shows that living cells are excessively dehydrated by decreasing tem-peratures (–1.16 MPa K−1). Low Ψ induced by ice can there-fore explain the significant shrinkage of the stem detected during freezing events (Cinotti, 1989; Zweifel and Häsler, 2000; Améglio et al., 2001; Sevanto et al., 2006). It may also be sufficient to induce cavitation and embolism within xylem conduits (Sucoff, 1969; Ewers, 1985; Robson et al., 1988).
Intracellular ice formation leads to the death of living cells in the stem (Mazur, 1963, 1969; Guy, 1990; Andrews, 1996; Wolfe and Bryant, 2001). At low freezing rates or in acclimated stems, ice nucleation occurs in the apoplastic compartment. Extracellular ice causes a drastic dehydration and induces osmotic stress affecting the cytoplasm and mem-branes of living cells (Gusta et al., 1975; Steponkus, 1984;
Ruelland et al., 2009), but, due to extracellular freezing, not necessarily the death of cells.
Xylem water transport capacity is impacted by freeze–thaw cycles when winter embolism is induced in xylem conduits (Sperry and Sullivan, 1992; Tyree et al., 1994; Hacke et al., 2001; Mayr et al., 2007), but the mechanisms and dynamics of this phenomenon are still unclear. The ‘thaw–expansion hypothesis’ (Ewers, 1985; LoGullo and Salleo, 1993; Lemoine et al., 1999;Hacke and Sperry, 2001; Tyree and Zimmermann, 2002; Pittermann and Sperry, 2003, 2006) postulates that gas bubbles are formed in conduits when sap freezes, because air is barely soluble in ice. During thawing, these bubbles expand when the pressure of the surrounding sap becomes sufficiently negative to counter the bubble-collapsing force of surface tension (Pittermann and Sperry, 2006). Several experimental studies are consistent with this ‘thaw–expansion hypothesis’ with observations of bubbles during freezing (Sucoff, 1969;
Ewers, 1985; Robson et al., 1988), embolism formation linked to vessel diameter (Davis et al., 1999; Sperry and Robson, 2001; Pittermann and Sperry, 2003; Pittermann and Sperry, 2006; Charrier et al., 2013a, 2014a), or negative xylem sap pressure as a precondition to induce embolism formation (Sperry and Sullivan, 1992; Langan et al., 1997; Davis et al.,
1999; Sperry and Robson, 2001; Améglio et al., 2002; Mayr et al., 2003; Pittermann and Sperry, 2006; Stuart et al., 2007;
Mayr and Sperry, 2010). Nevertheless, other studies have con-tradicted the ‘thaw–expansion hypothesis.’ First, several stud-ies have shown that the rate of embolism increased with the number of freeze–thaw cycles (Sperry et al., 1994; Sparks and Black, 2000; Sparks et al., 2001; Mayr et al., 2003, 2007; Mayr and Zublasing, 2010; Charra-Vaskou et al., 2012b), although all conduits of critical size should cavitate in the first freez-ing cycle. Secondly, a lack of correlation between conduit size and intrinsic vulnerability was found (Mayr et al., 2007). According to the ‘thaw-expansion hypothesis,’ the probability of cavitation increases with conduit size as larger bubbles are formed during freezing. Thirdly, ultrasonic emissions (UEs), commonly related to embolism, were registered during freez-ing (Kikuta and Richter, 2003; Mayr et al., 2007; Mayr and Sperry, 2010), while embolism should occur during thawing.
Measurement of UEs is a standard method for drought-induced embolism monitoring in the laboratory (Salleo and Lo Gullo, 1986; Borghetti et al., 1993; Salleo et al., 2000;
Mayr and Rosner, 2011; Vergeynst et al., 2014) and in the field (Jackson and Grace, 1996; Höllta et al., 2005; Ogaya and Penuelas, 2007). During freeze–thaw cycles, UEs are emitted on freezing (Weiser and Wallner, 1988; Raschi et al., 1989; Kikuta and Richter, 2003; Mayr et al., 2007; Mayr and Sperry, 2010; Mayr and Zublasing, 2010; Kasuga et al., 2015). Charrier et al. (2014a) observed a significant correla-tion between UEs and loss of hydraulic conductivity after a freeze–thaw cycle. The authors hypothesized that UEs were not correlated with embolism but rather were emitted by bub-ble formation in the freezing sap (‘freeze cavitation hypoth-esis’; see also Charrier et al., 2015b), as observed previously within artificial vessel devices (Ponomarenko et al., 2014). In contrast, bubble expansion within conduits (embolism for-mation) was suggested to occur on thawing. Embolism was observed previously during thawing by cryoscanning elec-tron microscopy in Betula platyphylla and Salix
sachalinen-sis (Utsumi et al., 1998) and Fraxinus mandshurica (Utsumi
et al., 1999) and by Ball et al. (2006) on leaves. However, to date, embolism formation during freeze–thaw cycle has never observed on the same sample. In this study, a direct meas-ure of embolism formation via X-ray microtomography dur-ing freeze–thaw cycles on the same sample allowed us to test both hypotheses and to analyze the dynamics of embolism formation.
The main objective of this study was to understand and to visualize the hydraulic processes during successive events of freezing and thawing. We hypothesized that ice nucleation is located in the cambium and/or pith areas (Améglio et al., 2001; Ball et al., 2006) and that it generates spatial heteroge-neity in Ψ. Water would be attracted toward the site of ice nucleation, leading to dehydration of the bark and xylem, so that cavitation thresholds are reached in xylem conduits (‘freeze cavitation hypothesis’). On thawing, we expected embolism formation, according to the ‘thaw–expansion hypothesis’, to concur with the two current hypotheses dis-cussed. We combined four complementary tools: (i) micro-dendrometers to monitor the stem diameter and indicate the
radial water fluxes during freeze–thaw events (Zweifel et al., 2000; Améglio et al., 2001, 2003); (ii) nuclear magnetic res-onance imaging (MRI) allowing visualization of the liquid water allocation before and after freeze–thaw cycles (Faust et al., 1997; Holbrook et al., 2001; Clearwater and Clark, 2003; Van As, 2007); (iiii) X-ray microtomography to visu-alize embolism inside plants, and also during freezing; this has been performed previously with drought-stressed plants (Brodersen et al., 2010; Charra-Vaskou et al., 2012a; Dalla-Salda et al., 2014; Torres-Ruiz et al., 2014), and is now becoming a reference technology in order to measure embo-lism in plants without cutting artifacts (Wheeler et al., 2013;
Cochard et al., 2014); and (iv) UE measurement to analyze the dynamics of cavitation events (Ponomarenko et al., 2014) during freeze–thaw cycles (Charrier et al., 2015b).
Materials and methods
Plant materialPlant material was sampled in the INRA PIAF orchard, site de Crouël, Clermont-Ferrand, France (350 m above sea level, 45°46′ N, 3°04′ E). Samples from current and 1-year-old branches were collected from sun-exposed branches of walnut trees (Juglans regia L. cv. Franquette) in winter. Branches of about 40 cm in length were
cut, immediately wrapped in plastic bags, transferred to the labora-tory, rehydrated overnight, and cut again under water the day after (about 30 cm long) in order to gradually release the xylem tension. Branches were shortened under water to obtain 14 final samples of around 10 cm in length and 1 cm in diameter for all experiments, and three samples of around 25 cm in length for MRI measurements. Both ends were rapidly soaked in liquid paraffin wax to seal ves-sel ends, and samples were wrapped in Parafilm (Pechiney Plastic Packaging, Chicago, IL, USA) to avoid dehydration.
Temperature treatments (except for MRI imaging)
Temperature treatments were performed within a temperature-con-trolled chamber (Binder GmbH, Tuttlingen, Germany) over 37 h. The temperature protocol contained one freeze–thaw cycle (+5 °C, down to –40 °C, up to +8 °C) with a rate of 5 K h−1 over 1 h,
fol-lowed by a 1 h step every 5 °C (Table 1). This minimum temperature of –40 °C allowed us to stop and avoid all active mechanism and any physiological reactions (such as possible refilling) in order to focus on physical phenomena (plasmolysis or embolism) induced by the low ice water potential. This temperature dynamics is a reference treatment to study the effects of freeze–thaw cycles (Charrier et al., 2014a; Kasuga et al., 2015). The final temperature of +8 °C was also chosen to avoid active refilling and stem pressure in samples (Sperry et al., 1987; Améglio et al., 1995; Hacke and Sauter, 1996; Holbrook and Zwieniecki, 1999; Améglio et al., 2001). Control sam-ples were kept at +5 °C for 37 h in chambers computer controlled by a circulator bath (Ministat Huber, Offenburg, Germany: –25 °C to
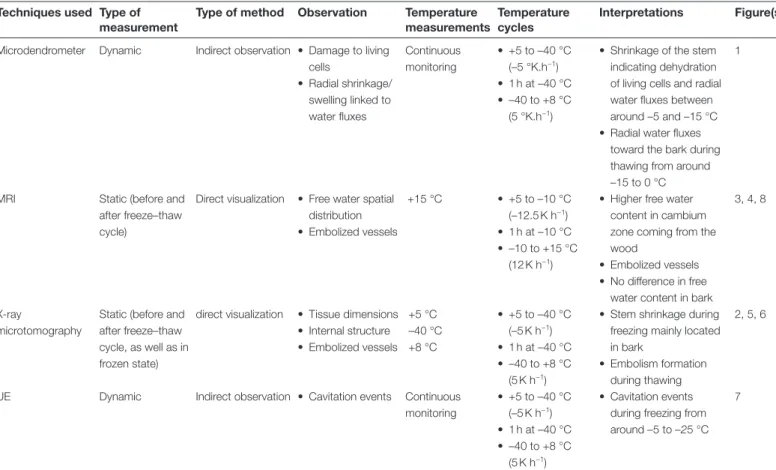
Table 1. Characteristics, indications, and observations provided by the different techniques used in the study
The type of measurement (dynamic or static), type of method (direct or indirect), indications given by each technique, temperature
measurements (frequency in the case of dynamic measurement and temperature of measurement in the case of static measurements), minimum temperature reached during the temperature treatment, observations/interpretations with each technique in this study, and related figures for the four techniques used: microdendrometer, MRI, X-ray microtomography, and UEs, are given.
Techniques used Type of measurement
Type of method Observation Temperature measurements
Temperature cycles
Interpretations Figure(s) Microdendrometer Dynamic Indirect observation • Damage to living
cells • Radial shrinkage/ swelling linked to water fluxes Continuous monitoring • +5 to –40 °C (–5 °K.h−1) • 1 h at –40 °C • –40 to +8 °C (5 °K.h−1) • Shrinkage of the stem indicating dehydration of living cells and radial water fluxes between around –5 and –15 °C • Radial water fluxes
toward the bark during thawing from around –15 to 0 °C
1
MRI Static (before and after freeze–thaw cycle)
Direct visualization • Free water spatial distribution • Embolized vessels +15 °C • +5 to –10 °C (–12.5 K h−1) • 1 h at –10 °C • –10 to +15 °C (12 K h−1) • Higher free water content in cambium zone coming from the wood
• Embolized vessels • No difference in free
water content in bark
3, 4, 8
X-ray
microtomography
Static (before and after freeze–thaw cycle, as well as in frozen state)
direct visualization • Tissue dimensions • Internal structure • Embolized vessels +5 °C –40 °C +8 °C • +5 to –40 °C (–5 K h−1) • 1 h at –40 °C • –40 to +8 °C (5 K h−1) • Stem shrinkage during freezing mainly located in bark
• Embolism formation during thawing
2, 5, 6
UE Dynamic Indirect observation • Cavitation events Continuous monitoring • +5 to –40 °C (–5 K h−1) • 1 h at –40 °C • –40 to +8 °C (5 K h−1) • Cavitation events during freezing from around –5 to –25 °C
7
+120 °C). The temperature in chambers was controlled using ther-mocouples and recorded every 1 s with a data logger (DL2e, Delta T devices, UK).
Microdendrometer
Stem diameter variations were monitored on three samples dur-ing one freeze–thaw cycle down to –40 °C, as described above. The diameter variation of a single sample is shown in Fig. 1 and is rep-resentative of the three samples. We used a special linear variable differential transformer sensor with data acquisition every 1 min (sensitivity±1 µm; PépiPIAF system, Forest Future, Nancy, France).
MRI imaging
The MRI observations were performed at INRA, Clermont-Ferrand, France, on an Avance DRX-400 micro-imaging system (Bruker, GmbH, Ettlingen, Germany) with a wide-bore (89 mm) vertical 9.4 T magnet and an actively shielded gradient coil allowing a maximum gradient strength of 1000 mT m−1. The samples were
placed in a 30 mm diameter birdcage radiofrequency coil used for both excitation and signal reception. During MRI measurements, the temperature was monitored (±0.5 °C) inside the probe. For freeze–thaw treatment, a cooling and warming rate of 12.5 K h−1
was applied and maintained at –10 °C for 1 h (Table 1). All MRI images (before and after the freezing process) were recorded at sta-bilized temperature of 15 °C. Below 0 °C, as the water was in a solid state (ice), no scans were performed as a signal was not detectable.
Due to the rapid decline of the water MRI signal (character-ized by a transverse relaxation time T2 of ≤1 ms, estimated from the
line width of the water peak of about 300 Hz at 15 °C), a gradient echo sequence with a minimum echo time of 2.6 ms was used for image acquisition. To reduce the acquisition time and to optimize the signal-to-noise ratio, a short repetition time of 150 ms and an excitation pulse at a 30° tip angle were used. Four contiguous trans-verse slices (perpendicular to the stem axis) were acquired simul-taneously in sequential mode. Each slice was 3 mm thick. Images were obtained with a 1.28 × 1.28 cm2 field of view. The images were
256 × 256 pixels, giving an in-plane resolution of 50 × 50 µm2. The
acquisition time was 30 min. Images were acquired before (t=0) and after (t=6 h) the freezing/thawing process on two treated samples and one control sample.
Three-dimensional X-ray microtomography
The 10 cm long samples were scanned with an X-ray microtomo-graph (Nanotom 180 XS, GE, Wunstorf, Germany) at the PIAF lab-oratory (INRA, Clermont-Ferrand, France). This method is based
on the local X-ray absorption behavior of the sample mainly accord-ing to the local density. It provides direct observation of the internal structure of an intact sample without surface or cutting prepara-tion (Brodersen et al., 2010; Charra-Vaskou et al., 2012a; Dalla-Salda et al., 2014; Torres-Ruiz et al., 2014). Eight samples were observed: five were submitted to one freeze–thaw cycle (see above). X-ray microtomographic scans were recorded before (+5 °C), after (+8 °C) and at the minimum point (–40 °C) of the freeze–thaw cycle (Table 1). The three other samples were kept at a constant tempera-ture (+5 °C) during the whole experiment (control samples). They were also scanned at the same time as the treated samples (t=0, 18, and 36 h). During the temperature course, samples were taken three times out of the temperature-controlled chamber, weighed, and immediately inserted within a polystyrene insulating cylinder for the X-ray scan. The sample temperature could not be measured during X-ray scans, but the quality of images showed that no changes in dimension occurred during acquisitions, suggesting that the sample stayed frozen during scans. Furthermore, no variation in sample weight was observed before and after scanning, indicating no sample water losses (data not shown).
The scanning setup was adjusted in order to manage the trade-off between the spatial resolution and the limitation of the sample heating during the scan. The field of view was adjusted in order to cover the whole sample cross-section. The spatial resolution was 11 × 11 × 11 µm3 per voxel. The X-ray parameters were 60 kV and
200 µA. For each sample, 600 images were recorded during a 360° rotation of the sample. A fast scan time was fixed at 13 min. Full three-dimensional volumes were reconstructed by datos|× 2.0 software (Phoenix, Nanotom 180 XS, GE, Wunstorf, Germany). Volumetric image analysis and visualization were performed using VGStudio Max© 2.1 software (Volume Graphics, Heidelberg, Germany). After
each scan, samples were removed from the insulating cylinder, weighed again, and put back into the temperature-controlled cham-ber. Samples were kept out of the chamber for less than 15 min.
Image analysis
MRI analysis was performed using MatLab (MathWorks, Massachusetts, USA). Since the contrast between the vessels filled with water and the other areas was very high, a threshold process was used to allow us to discriminate between water-filled and air-filled vessels. The threshold value was the same for all of the treated images. The area and the major and minor axes of an elliptic approx-imation were measured. The equivalent diameter was computed for every vessel based on its area (Deq= 2 A
π , where Deq is the equiva-lent diameter and A is the area of vessel cross-section). The number of water-filled vessels and the size distribution of the vessel diam-eters were measured. The grey level intensity, which refers to the
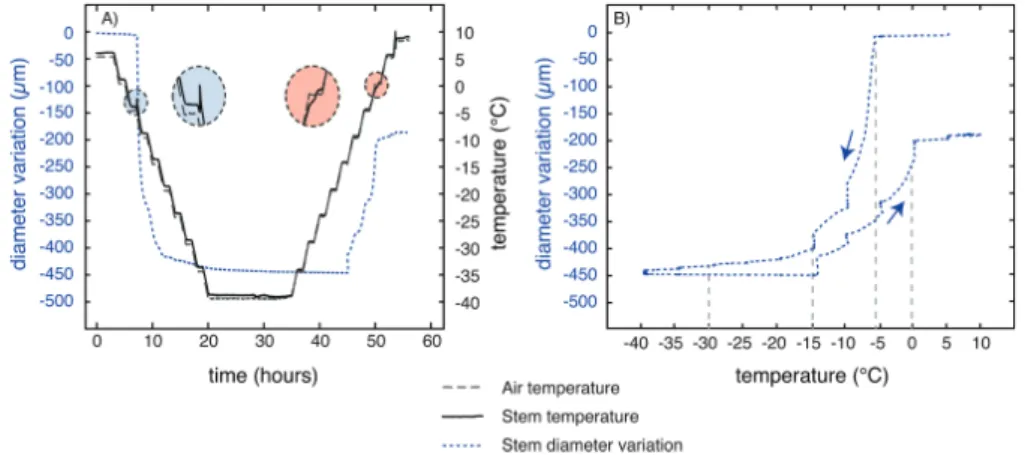
Fig. 1. Stem diameter variation during one freeze–thaw cycle. Diameter variation was recorded on three stem samples with a PépiPIAF over one freeze– thaw cycle (+5 °C/–40 °C/+8 °C). The diameter variation of a single sample is shown and is representative of the three samples. Data acquisition was every 1 min (sensitivity±1µm, PépiPIAF system, Forest Future, Nancy, France).
amount of water, was measured for outer bark, inner bark, pitch, and the cambium–phloem zone to follow the evolution of the water signal intensity. The means and standard errors of intensity were calculated in each area based on individual pixels. X-ray microto-mography scan analysis (n=5) was performed with ImageJ software to determine stem diameter and tissue thickness variations of the bark, wood, and pith, as well as the percentage of embolism before (+5 °C), during (–40 °C), and after (+8 °C) freeze–thaw cycles. For controls (n=3), tissue thickness and embolisms were determined on scans done at t=0, 18 and 36 h, which corresponded to each tem-perature step.
UEs
Three stem samples were subjected to one freeze–thaw cycle down to –40 °C (see above), while UEs (Mayr and Sperry, 2010; Mayr and Zublasing, 2010; Mayr and Rosner, 2011; Charrier et al., 2014b, 2015b) were recorded (Table 1).
One ultrasonic sensor (150 kHZ resonance sensor, R15/C, 80–400 kHz) was attached to each samples. In the middle of the sam-ple (10 cm in length), 3 cm2 of the Parafilm and bark were removed
and the xylem was covered with silicone grease in order to improve acoustic coupling and prevent evaporation. R15C sensors were then attached with clamps (plastic-coated metal springs). Sensors were connected to a 20/40/60 dB preamplifier set to 40 dB and plugged into a SAMOS device (SAMOS PAC 125 18-bit A/D, 3 kHz to 3 MHz PCI2). All components of the UE system were supplied by Mistras (Sucy-en-Brie, France).
The acoustic detection threshold was set at 45 dB. Peak definition time, hit definition, and hit lockout times were 200, 400, and 2 µs, respec-tively. Recording analysis of UEs used AEwin software (Mistras).
For vulnerability analysis, the cumulative number of ultrasonic emissions during temperature treatments was related to the total number of UEs until all acoustic activity stopped.
Statistics
All values are given as means±standard error (the number of sam-ples is given in the text). Differences between sample sets were tested with Student’s t-test after testing for Gaussian distribution (Kolmogorov–Smirnov test) and variance homogeneity (Levene test) of data. In the case of heterogeneous variances, Welch’s test was used. All tests (two-tailed) were performed pairwise at a prob-ability level of 5% using SPSS (version 15.0; SPSS Inc, Chicago, IL, USA).
Results
Diameter and tissues thickness variations
During freezing, immediately after the exotherm was detected (–5 °C; Fig. 1), a drastic radial shrinkage of stem diameter was observed (~54 µm K−1 between –5 °C and –10 °C). A shrinkage of lower intensity was observed between –10 and –15 °C (~9 µm K−1). The stem diameter then tended to stabi-lize (~1.8 µm K−1 between –15 and –40 °C; Fig; 1) reaching 96% of the initial size at –40 °C (Fig. 2).
During thawing, no stem diameter variation occurred between –40 and –15 °C, but it suddenly increased at a tem-perature higher than –15 °C. Stem diameter variation was related to temperature steps but stopped after the endotherm was observed (~+6 °C; Fig. 1). Between –40 and +8 °C, stem diameter recovered to 99% of initial diameter (Figs 1 and 2).
X-ray microtomography observations provided new infor-mation at the tissue level: neither wood nor pith showed
any significant thickness variation. Stem diameter variation during the freeze–thaw cycle was mostly due to changes in the bark. Indeed, a diameter shrinkage of about 3.7% was observed (96.3% of its initial thickness at –40 °C; Fig. 2) in the sample about 8200 µm in diameter, i.e. a shrinkage of 303 µm. A bark shrinkage of 13.9% was observed (86.1% of initial thickness at –40 °C; Fig. 2). The bark measured about 930 µm, which corresponded to a shrinkage of 129 µm (this had to be multiplied by 2 for both sides of the bark). During freezing, the bark shrinkage was then about 258 μm when the total diameter shrinkage was about 303 µm. The relative bark shrinkage (13.9%) thus explained almost the entire relative diameter variation of the stem (3.7%). We observed incom-plete recovery on thawing with a loss in diameter of almost 200 µm (~2% of initial size) after the freeze–thaw cycle down to –40 °C (Fig. 1).
MRI image observations
MRI images depicted free liquid water distribution within samples at +15 °C (Fig. 3) as bright areas, i.e. the higher the free liquid water content, the brighter it appeared. During the discussion of this study, water signal intensity will be con-sidered as free water content. The minimum temperature of the freeze–thaw cycle for MRI measurement was –10 °C. This temperature was sufficient to analyze the changes in free water content, without the death of cells.
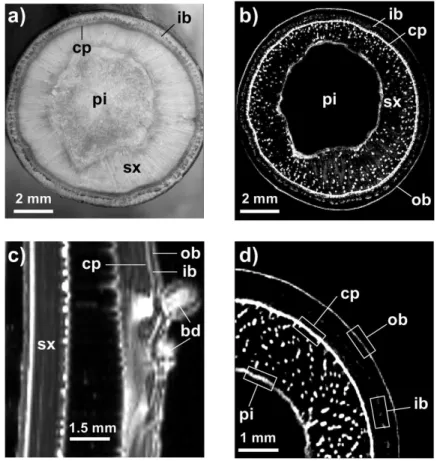
Before treatment, water-filled vessels were visible within the xylem (Fig. 3b, 3d) as well as two high-intensity zones (cambium–phloem and pith) and two middle-intensity zones (inner and outer bark; Fig. 3b–d). Longitudinal observation (Fig. 3c) confirmed that the cambium–phloem zone was the most hydrated part.
After a complete freeze–thaw cycle, the water signal inten-sity increased significantly in the cambium–phloem and pith areas (Fig. 4). In contrast, the outer and inner bark did not shown any change. In control samples (maintained at a con-stant temperature of +15 °C for 6 h), the water signal intensity
Fig. 2. Thickness variations of stem tissues during the freeze–thaw cycle. The thickness of the bark, wood, and pith, as well as the diameter, were measured from X-ray microtomography pictures using image analysis software (ImageJ). Image acquisitions of stems (n=5) at +5 °C (before, t=0), during (–40 °C, t=18 h), and after (+8 °C, t=36 h) the freeze–thaw cycle were used. Results are shown as means±SE (n=5). Bars with a different letter differed significantly at P≤0.05.
decreased in the cambium–phloem and pith areas, while no variation was observed in the outer or inner bark.
X-ray microtomography observations of frozen and thawed samples
The grey levels of three-dimensional images obtained by X-ray microtomography indicate the matter density, i.e. the denser the material, the brighter it appears. Air-filled vessels thus appeared as black spots (Fig. 5). During freezing (from
t=0 to t=18 h, corresponding to +5 and –40 °C, respectively),
no significant xylem embolism could be detected. X-ray image analysis revealed that, between +5 °C and –40 °C, the number of embolized vessels (18.4 ± 2.2 and 21.0 ± 1.8% at +5 and –40 °C, respectively) and the total area of embo-lized vessels (14.1 ± 2.2 and 18.0 ± 2.3%, respectively) were not significantly different (Fig. 6). Likewise, no significant difference was observed in control samples, both for number of embolized vessels (22.6 ± 1.1 and 26.2 ± 3.2%, at t=0 and 18 h corresponding to +5 and –40 °C in freeze–thaw samples, respectively; Fig. 6) and for total area of embolized vessels (14.5 ± 0.7 and 16.8 ± 1.7%; respectively; Fig. 6). Control samples with a constant embolism rate during the whole experiment validated our experiment design with open ves-sels. Furthermore, the tension of samples was released before experiments by recutting under water several times.
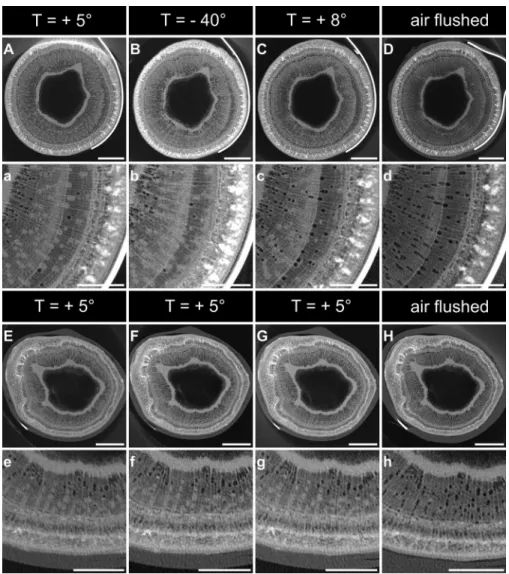
In contrast, embolism in vessels increased during thawing between –40 and +8 °C as shown by X-ray microtomography pictures (Fig. 5, upper row), while no change was observed in control stems at t=18 and 36 h (corresponding to –40 and +8 °C of treated samples; Fig. 5, lower rows). The num-ber of embolized vessels shifted from 21.0 ± 1.8% at –40 °C (18.0 ± 2.3% in terms of embolized area) to 66.3 ± 3.5% at +8 °C (64.0 ± 5.5% in terms of embolized area; Fig. 6), whereas the number of embolized vessels and the embolized area of the control samples were not significantly different (from 26.2 ± 3.2 and 16.8 ± 1.7% at t=18 h to 29.0 ± 1.0 and 20.3 ± 1.4% at t=36 h, respectively; Fig. 6). This observation enabled us to observe for the first time the increase in embo-lism in one identical stem sample during the thawing process.
UEs during freezing and thawing
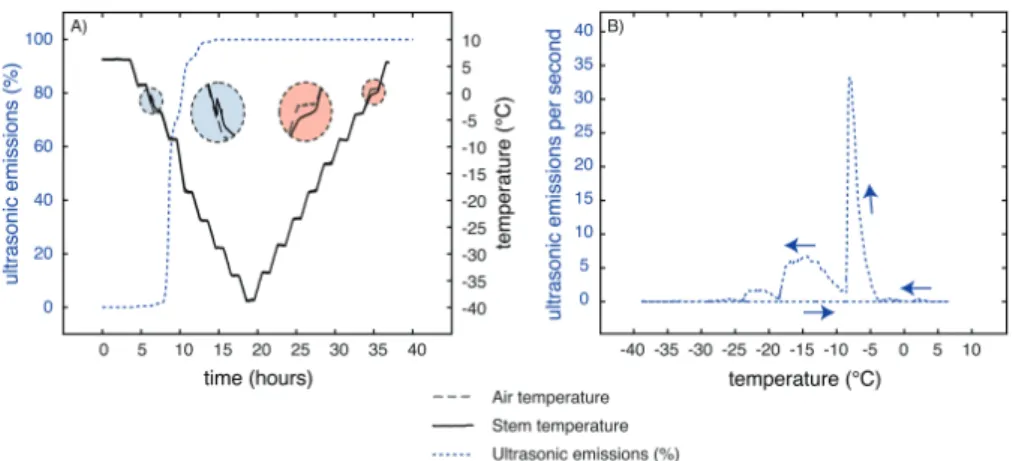
UEs were strictly emitted only during freezing (Fig. 7), start-ing exactly when the exotherm generated by ice formation was detected. Cumulated UEs increased stepwise following the decreasing temperature steps, and stopped when the tem-perature reached around –30 °C. Around 80% of UEs were recorded between –5 °C (corresponding to the beginning of the exotherm) and –15 °C, and 100% of UEs were reached at –30 °C (Fig. 7). No UEs were detected during thawing from –40 to +8 °C.
Fig. 3. Light microscopy and MRI micrograph comparisons of transverse and longitudinal sections of 1-year-old stem of J. regia L. (a) Transverse light microscopy section. (b) Transverse MRI image of the same stem as in (a). (c) Longitudinal MRI image of a stem with an axial bud. (d) Detail from a transverse MRI image of the same stem as in (b). pi, Pith; sx, secondary xylem; ob, outer bark; ib, inner bark; cp, cambium–phloem zone; bd, bud. The four rectangles in (d) represented the four different zones used for MRI signal intensity analysis (related to free water content).
Discussion
Freezing
At the onset of ice nucleation, inducing an exotherm at –5 °C (Figs 1 and 7), a drastic radial shrinkage of the stem immedi-ately started (Fig. 1), as also observed previously by Winget and Kozlowski (1964), Zweifel and Häsler (2000), Améglio et al. (2001), and Litunen et al. (2015). Freezing of acclimated stems induced a combination of living cell shrinkage due to water losses by plasmolysis (Améglio et al., 2001, 2003) or involving putative aquaporine activity (Steppe et al., 2012), and physical shrinkage of cell walls in frozen tissues (Kubler, 1983; Sakai and Larcher, 1987; Zweifel and Häsler, 2000).
Within acclimated stems, as in our experiments, ice nuclea-tion occurs in extracellular spaces, and living cells are dehy-drated as protection against frost temperatures (Lu and Rieger, 1993; Rodrigo, 2000; Neuner and Pramsohler, 2006). Water fluxes from living cells to extracellular spaces, resulted in a cell volume drop, which mostly contributed to global stem radial shrinkage (Fig. 1, Table 1). Steppe et al. (2012)
suggested that, in J. regia, the radial hydraulic conductance is variable and is probably mediated by putative aquaporin abundance and/or activity, and that the two possible path-ways are the apoplastic and transmembrane routes.
The higher free water content observed in the cambium and pith after a complete freeze–thaw cycle (Fig. 4, Table 1) suggested that ice nucleation took place in these tissues, inducing high Ψ gradients, which drove water from the bark and xylem toward this point and generated strong dehydra-tion during freezing of surrounding tissues (Mazur, 1969;
Guy, 1990; Améglio et al., 2001). Améglio et al. (2001) found in J. regia stems and Ball et al. (2004) within non-acclimated leaves that the ice nucleation point is located in the cam-bium area, which drives water from the bark and xylem to this area.
During freezing, stem shrinkage was caused mainly by bark shrinkage and hardly at all by changes in wood and pith dimension (Fig. 2). The volume variation of ice with
temperature (see ‘Thawing’ below) induced a contraction of the bark to a lesser extent. However, bark shrinkage was mainly due to water fluxes leaving the bark from dehydrating living cells (Zweifel and Häsler, 2000; Améglio et al., 2001). The volume changes in wood were small for two reasons: (i) stiffness is much higher in wood than in bark tissues due to lignified cells; and (ii) the low proportion of living cells in wood limits any active movement of water.
No embolism was detected at –40 °C in frozen ves-sels (Fig. 5), as was also observed with cryoscanning elec-tron microscopy by Utsumi et al. (1999) on stems from
Fraxinus mandshurica, or by Ball et al. (2006) on leaves from
Eucalyptus sp.
UEs were continuously detected during the temperature decrease (Fig. 7, Table 1), as reported in previous stud-ies (Mayr et al., 2007; Mayr and Sperry, 2010; Mayr and Zublasing, 2010). We assume that cavitation events (air bubble formation, a prerequisite for embolism formation) occurred during freezing due to ice-induced high Ψ gradients (Sevanto et al., 2012) and caused UEs, according to Charrier et al. (2014a, 2015a) and Ponomarenko et al. (2014). Hacker and Neuner (2008) and Pramsohler et al. (2012) reported that ice propagation started from the nucleation point and spread along the sample with a higher longitudinal than radial speed, and Charrier et al. (2015b) reported that cavitation events occur at the ice front. Although the spatial resolution of our images was too low to detect whether air bubbles were already formed within vessels, such bubbles have been observed previ-ously within conifer xylem (Sucoff, 1969; Robson et al., 1988) and angiosperms leaves (Ball et al., 2006).
Interestingly, 90% of UEs were already emitted and 90% of shrinkage occurred at –15 °C, which is the temperature cor-responding to 50% of cell death (LT50) within J. regia stems in winter (Poirier et al., 2010; Charrier et al., 2011, 2013b). This suggests that at this temperature all extracellular water was frozen, living cells were almost dehydrated, and cavitation occurred within the xylem. At –30 °C, UEs stopped and 98% of shrinkage was observed. During this temperature decrease
Fig. 4. Analysis of MRI images to determine the relative intensity for the four zones indicated in Fig. 3. Means±SE are shown (n=12, 4, and 8, respectively) for the control (t=0 h), the control after 6 h at +15 °C, and the treated (t=6 h) stems after a freeze–thaw treatment (+15 °C/–10 °C/+15 °C). *P≤0.01; **P≤0.05; U.A., arbitrary units; NS, not significant.
(from –15 to –30 °C), we assumed that completion of living cell dehydration occurred, some cavitation still took place, and some living cells died, as indicated by the irreversible shrinkage (Améglio et al., 2001, 2003). Finally, at –40 °C, stem shrinkage and UEs tended to stabilize as Ψ gradients were equilibrated (Cochard et al., 2001; Ponomarenko et al., 2014). Theoretically, according to the Clausius–Clapeyron relationship, ice water potential decrease linearly with temperature (–1.16 MPa K−1 below the freezing point occurring around –5 °C). At –40 °C, ice water potential should reach –40.6 MPa. Nevertheless, at this temperature, except for some negligible quantities of water hyperconcentrated within cells, all the water is frozen and the theoretical water potential has a very limited effect and only on the ice contraction, depending on the temperature.
Thawing
During the temperature increase, stems swelled between –15 and +8 °C (Fig. 1, Table 1). Swelling was stronger as temper-atures increased and lower when the temperature remained
constant at a plateau, indicating that the diameter variation was directly correlated with temperature changes. Around 80% of the shrinkage and total swelling occurred at the same temperature range, respectively, between the exotherm/endo-therm and –15 °C.
The diameter increase from –15 to –5 °C was mainly due to water fluxes toward the cytoplasm of living cells. Indeed, extracellular water with the highest solute con-centration, which froze last at around –15 °C, started to thaw first at the same temperature and to refill the most dehydrated living cells with the highest osmotic potential (Fig. 1) (Sevanto et al., 2006). The highest swelling rate was observed between –5 and 0 °C, when most of the ice turned into liquid water, allowing intense water fluxes toward living cells.
From –15 to –5 °C, to a lesser extent, physical dilation of tis-sues and ice swelling with temperature also increased the stem diameter (Kubler, 1983; Sakai and Larcher, 1987; Zweifel and Häsler, 2000). The linear deformation of ice (in the order of 0.01% K–1; Haynes, 2014) would induce a diameter increase Fig. 5. Transverse cross-sections of stem segments observed by X-ray microtomography during a freeze–thaw cycle, showing whole cross-sections (upper rows) and a more detailed view (lower rows). Scans were performed at the temperatures indicated during one freeze–thaw cycle for each sample (n=5; A–C, a–c) and control samples (n=3; E–G, e–g) were scanned at the same times (t=0, 18, and 36 h) but were kept at a constant temperature (+5 °C). D and H represent respectively the Scans of air-flushed treated samples and control samples are shown in (D/d) and (H/h), respectively. Bars, 1 mm.
of ~10 µm, which is much lower than our observation (diam-eter increase of ~150 µm).
Similar to the freezing phase, the increase in sample diam-eter during thawing was mainly due to swelling of the bark (Fig. 2). When the ice turned into water, fluxes moved in the opposite direction from those during freezing, and the water went back into the highly dehydrated living cells of the bark (Uemura et al., 2006). However, after a freeze–thaw cycle down to –40 °C, the bark did not fully recover its initial diam-eter. This hysteresis suggests that some cells died during the freezing step and could not recover their initial state (Figs 1
and 2; Charrier et al., 2013a, b). Indeed, incomplete recovery of the diameter indicated that temperatures dropped too low or that there was insufficient hardening of samples, leading to damage of living cells (Améglio et al., 2001). Interestingly, in the case of temperature treatment down to –10 °C, the bark fully recovered its free water content after a freeze–thaw cycle (Fig. 4). Indeed, a temperature of –10 °C did not cause cell death; therefore, bark living cells could totally rehydrate themselves to the same state as before the freeze.
After a complete freeze–thaw cycle down to –10 °C, a free water content increase in the cambium–phloem zone as well
as in the pith was observed (Fig. 4, Table 1). This may be due to two mechanisms:
(i) Ice formation and/or propagation in the cambium– phloem zone led to partial lysis of cells. Thus, bound water was released and free water appeared on MRI images after a complete freeze–thaw cycle. Nevertheless, this mechanism seems unlikely as living cells should resist lysis down to –10 °C.
(ii) Ice nucleation took place in the cambium and pith regions, and water was then attracted by ice into these tis-sues during freezing. A complete return of water toward the bark should occur, as cells are still alive after a freeze– thaw cycle down –10 °C. With such temperature treat-ments, the remaining free water content in the cambium and pith areas should thus come from the wood and par-ticularly from embolism of vessels. We assume that this last mechanism was the main factor inducing the higher free water in the cambium and pith zones after the com-plete freeze–thaw cycle.
Embolism formation in vessels after a complete freeze– thaw cycle was clearly observed with X-ray microtomography
Fig. 6. Percentage of embolism at different steps of a freeze–thaw cycle (+5 °C/–40 °C/+8 °C). The number of air-filled vessels was measured by image analysis on X-ray microtomographic scans (n=5). For controls (n=3), the embolism ratio was determined on scans done at t=0, 18 and 36 h. Bars with a different letter differed significantly at P≤0.05.
Fig. 7. Cumulative UEs during a freeze–thaw cycle. Cumulative UEs were recorded on three samples during a freeze–thaw cycle from 5 down to –40 °C. For details, see Material and methods.
(Fig. 5) as well as with MRI (Supplementary Fig. S1 at JXB online). More than 60% of embolism formation was observed after a freeze–thaw cycle down to –40 °C with X-ray microto-mography scans (Figs 6 and 7). This consistent with previ-ous work: Charrier et al. (2014a) recently reported around 70% embolism after one freeze–thaw cycle down to –40 °C for J. regia, 92% was observed in Quercus robur (Sperry and Sullivan, 1992), 50–85% in Fagus sylvatica (Lemoine et al., 1999), and 40–95% in 10 angiosperm species (Charrier et al., 2014a). In contrast to other studies (Sperry and Sullivan, 1992; Davis et al., 1999; Pittermann and Sperry, 2003; Pittermann and Sperry, 2006), embolism sensitivity did not depend on the vessel diameter in this study, as the integrity of embolism (based on embolized vessel number or embo-lized area) did not show any significant difference (Fig. 7). Interestingly, embolism occurred after a freeze–thaw cycle down to –10 °C (Supplementary Fig. S1 at JXB online, observed by MRI). This is in accordance with Charrier et al. (2014a), who reported 40% embolism within J. regia stems after one freeze–thaw cycle down to –10 °C.
Many previous studies have reported embolism formation in vessels after a complete freeze–thaw cycle (Améglio et al., 1995; Mayr et al., 2002; Ball et al., 2006; Mayr and Charra-Vaskou, 2007; Charra-Vaskou et al., 2012a). However, devel-opment of embolism during thawing was never proved, except by Utsumi et al. (1999) on Fraxinus stems or Ball et al. (2006) on Eucalyptus leaves by cryoscanning electron micros-copy. In this study, embolism was monitored for the first time on identical samples during the whole freeze-thaw cycle. In accordance with the ‘thaw–expansion hypothesis,’ we clearly demonstrated that embolism occurred during the thawing phase. UEs were emitted only during freezing, indicating that UEs were not directly related to embolism formation.
Conclusion
The study of events and damages induced by frost is impor-tant to understand the physiological processes of trees under current environmental constraints. For the first time, spatial and temporal patterns were monitored during a freeze–thaw cycle on identical tree stems. The use of several non-invasive observation methods gave new insights in the dynamics of processes related to freezing and thawing (Table 1). During freezing, from the time of exotherm formation until –15 °C, water moved mainly from the bark toward the cambium, indi-cating that ice nucleation occurs in this region. This strong water-attractive point generates high spatial heterogeneity of Ψ gradients within the stem, inducing cavitation of ves-sels. UEs recorded during freezing are likely to be linked to cavitation events but not to vessel embolism. During thawing, from –15 to +5 °C, water moves back to dehydrated living cells of the bark resulting in stem swelling. Thanks to X-ray microtomography, embolism formation could be visual-ized during thawing. Embolism development, in contrast to cavitation events, does not induce any UEs. The dissociation of cavitation and embolism events during the freeze–thaw cycle is a great opportunity to analyze, from a physical and
physiological point of view, the liquid-to-gas transition, which drives the hydraulic integrity, crucial for the survival of plants.
Use of a microdendrometer allowed us to detect with high precision the exotherm and endotherm temperatures as well as the temperatures when ice propagation ends and thawing starts. Temperature-induced cell damage can also be detected by this non-destructive technique. Microdendrometer and UE techniques, already commonly used for drought stress, could be used as non-destructive methods to monitor the risk of frost damage in the field.
Supplementary data
Supplementary data are available at JXB online.
Supplementary Fig. S1. Cross-section MRI images showing emptying of vessels after a freeze–thaw cycle down to –10 °C.
Acknowledgements
This study was supported by ANR (ANR 11-ISV7-003-01) and AGREENSKILLS (Id Application 127), as well as the Austrian Science Fund (FWF I826 – B25). We thank Catherine Girard for the MRI scans and Hervé Cochard and Marilyn Ball for their useful help and comments on the first draft.
References
Améglio T, Bodet C, Lacointe A, Cochard H. 2002. Winter embolism, mechanisms of xylem hydraulic conductivity recovery and springtime growth patterns in walnut and peach trees. Tree Physiology 22, 1211–1220.
Améglio T, Cochard H, Ewers FW. 2001. Stem diameter variations and cold hardiness in walnut tree. Journal of Experimental Botany 52, 2135–2142.
Améglio T, Cruiziat P, Beraud S. 1995. Tension/pressure alternation in walnut xylem sap during winter—effect on hydraulic conductivity of twigs. Comptes Rendus de L’académie des Sciences Série III—Life Sciences 318, 351–357.
Améglio T, Ewers FW, Cochard H. 2003. Gelista™: A new tool for testing frost hardiness by stem diameter variations. Acta Horticulturae 618, 509–515.
Andrews CJ. 1996. How do plants survive ice? Annals of Botany 78, 529–536.
Ball MC, Canny MJ, Huang CX, Egerton JJ, Wolfe J. 2006. Freeze/thaw-induced embolism depends on nadir temperature: the heterogeneous hydration hypothesis. Plant, Cell and Environment 29, 729–745.
Ball MC, Canny MJ, Huang CX, Heady RD. 2004. Structural changes in acclimated and unacclimated leaves during freezing and thawing. Functional Plant Biology 31, 29–40.
Borghetti M, Grace J, Raschi AE. 1993. Water transport in plants under climatic stress . Cambridge, UK: Cambridge University Press.
Brodersen C, McElrone AJ, Choat B, Matthews MA, Shackel KA. 2010. The dynamics of embolism repair in xylem: in vivo visualizations using high-resolution computed tomography. Plant Physiology 154, 1088–1095.
Burke MJ, Gusta LV, Quamme HA, Weiser CJ, Li PH. 1976. Freezing and injuring in plants. Annual Review of Plant Physiology 27, 507–528.
Charra-Vaskou K, Badel E, Burlett R, Cochard H, Delzon S, Mayr S. 2012a. The hydraulic efficiency and safety of vascular and non-vascular components in Pinus pinaster leaves. Tree Physiology 32, 1161–1170.
Charra-Vaskou K, Charrier G, Wortemann R, Cochard H, Ameglio T, Mayr S. 2012b. Drought and frost resistance of trees: a comparison of four species at different sites and altitudes. Annals of Forest Science 69, 325–333.
Charrier G, Bonhomme M, Lacointe A, Améglio T. 2011. Are budburst dates, dormancy and cold acclimation in walnut trees (Juglans regia L.) under mainly genotypic or environmental control? International Journal of Biometeorology 55, 763–774.
Charrier G, Charra-Vaskou K, Kasuga J, Cochard H, Mayr S, Améglio T. 2014a. Freeze–thaw stress: Effects of temperature on hydraulic conductivity and ultrasonic activity in ten woody angiosperms. Plant Physiology 164, 992–998.
Charrier G, Charra-Vaskou K, Legros B, Amégio T, Mayr S. 2014b. Changes in ultrasound velocity and attenuation indicate freezing of xylem sap. Agricultural and Forest Meteorology 185, 20–25.
Charrier G, Cochard H, Améglio T. 2013a. Evaluation of the impact of frost resistances on potential altitudinal limit of trees. Tree Physiology 33, 891–902.
Charrier G, Ngao J, Saudreau M, Améglio T. 2015a. Effects of environmental factors and management practices on microclimate, winter physiology and frost resistance in trees. Frontiers in Plant Science 6, 259.
Charrier G, Poirier M, Bonhomme M, Lacointe A, Améglio T. 2013b. Frost hardiness in walnut trees (Juglans regia L.): how to link physiology and modeling? Tree Physiology 33, 1229–1241.
Charrier G, Pramsohler M, Charra-Vaskou K, Saudreau M, Améglio T, Neuner G, Mayr S. 2015b. Ultrasonic emissions during ice nucleation and propagation in plant xylem. New Phytologist 207, 570–578.
Chuine I, Beaubien EG. 2001. Phenology is a major determinant of tree species range. Ecology Letters 4, 500–510.
Cinotti B. 1989. La gélivure des chênes: front de gel source de contraintes internes, incidence des propriétés anatomiques et mécano-physiques . Thesis, INPL Nancy, France.
Cinotti B. 1991. Investigation of the intrinsic properties of wood for explaining the occurrence of frost-crack in Quercus petraea Liebl. and Quercus robur L. Annals of Forest Sciences 48, 453–468.
Clearwater MJ, Clark CJ. 2003. In vivo magnetic resonance imaging of xylem vessel contents in woody lianas. Plant, Cell and Environment 26, 1205–1214.
Cochard H, Delzon S, Badel E. 2014. X-ray microtomography (micro-CT): a reference technology for high-resolution quantification of xylem embolism in trees. Plant, Cell and Environment 38, 201–206. Cochard H, Lemoine D, Améglio T, Granier A. 2001. Mechanisms of xylem recovery from winter embolism in Fagus sylvatica. Tree Physiology 21, 27–33.
Cruiziat P, Cochard H, Améglio T. 2002. Hydraulic architecture of trees: main concepts and results. Annals of Forest Science 59, 723–752. Dalla-Salda G, Fernandez ME, Sergent AS, Rozenberg P, Badel E, Martinez-Meier A. 2014. Dynamics of cavitation in a Douglas-fir tree-ring: transition-wood, the lord of the ring? Journal of Plant Hydraulics 1, e-0005.
Davis SD, Sperry JS, Hacke UG. 1999. The relationship between xylem conduit diameter and cavitation caused by freezing. American Journal of Botany 86, 1367–1372.
Ewers FW. 1985. Xylem structure and water conduction in conifer trees, dicot trees, and lianas. IAWA bulletin 6, 309–317.
Faust M, Erez A, Rowland LJ, Wang SY, Norman HA. 1997. Bud dormancy in perennial fruit trees: physiological basis for dormancy induction, maintenance, and release. HortScience 32, 623–629.
Feild TS, Brodribb T. 2001. Stem water transport and freeze–thaw xylem embolism in conifers and angiosperms in a Tasmanian treeline heath. Oecologia 127, 314–320.
Gusta LV, Burke MJ, Kapoor AC. 1975. Determination of unfrozen water in winter cereals at subfreezing temperatures. Plant Physiology 56, 707–709. Guy CL. 1990. Cold acclimation and freezing stress tolerance: role of protein metabolism. Annual Review of Plant Physiology and Plant Molecular Biology 41, 187–223.
Hacke U, Sauter JJ. 1996. Xylem dysfunction during winter and recovery of hydraulic conductivity in diffuse-porous and ring-porous trees. Oecologia 105, 435–439.
Hacke UG, Sperry JS. 2001. Functional and ecological xylem anatomy. Perspectives in Plant Ecology, Evolution and Systematics 4, 97–115. Hacke UG, Sperry JS, Pockman WT, Davis SD, McCulloh KA. 2001. Trends in wood density and structure are linked to prevention of xylem implosion by negative pressure. Oecologia 126, 457–461.
Hacker J, Neuner G. 2008. Ice propagation in dehardened alpine plant species studied by infrared differential thermal analysis (IDTA). Artic, Antartic, and Alpine Research 40, 660–670.
Haynes WM. 2014. CRC Handbook of Chemistry and Physics , 95th edn.
Boca Raton: CRC Press.
Holbrook NM, Ahrens ET, Burns MJ, Zwieniecki MA. 2001. In vivo observation of cavitation and embolism repair using magnetic resonance imaging. Plant Physiology 126, 27–31.
Holbrook NM, Zwieniecki MA. 1999. Embolism repair and xylem tension: do we need a miracle? Plant physiology 120, 7–10.
Höllta T, Vesala T, Nikinmaa E, Perämäki M, Siivola E, Mencuccini M. 2005. Field measurements of ultrasonic acoustic emissions and stem diameter variations. New insight into the relationship between xylem tensions and embolism. Tree Physiology 25, 237–243.
Jackson GE, Grace J. 1996. Field measurements of xylem cavitation: are acoustic emissions useful? Journal of Experimental Botany 47, 1643–1650.
Kasuga J, Charrier G, Uemura M, Améglio T. 2015. Characteristics of ultrasonic acoustic emissions from walnut twigs during freeze–thaw-induced embolism formation. Journal of Experimental Botany 66, 1965–1975.
Kikuta S, Richter H. 2003. Ultrasound acoustic emissions from freezing xylem. Plant, Cell and Environment 26, 383–388.
Kubler H. 1983. Mechanism of frost crack formation in trees—a review and synthesis. Forest Science 29, 559–568.
Langan SJ, Ewers FW, Davis SD. 1997. Xylem dysfunction caused by water stress and freezing in two species of co-occurring chaparral shrubs. Plant, Cell and Environment 20, 425–437.
Lemoine D, Granier A, Cochard H. 1999. Mechanisms of freeze-induced embolism in Fagus sylvatica L. Trees 13, 206–210.
Litunen A, Paliakka T, Riikonen R, Linden L, Lindfors L, Nikinmaa E, Hölttä T. 2015. Irreversible diameter change of wood segments correlates with other methods for estimating frost tolerance of living cells in freeze– thaw experiment: a case study with seven urban tree species in Helsinki. Annals of Forest Sciences (in press). DOI 10.1007/s13595-015-0516-3. LoGullo MA, Salleo S. 1993. Different vulnerabilities of Quercus ilex L. to freeze- and summer drought-induced xylem embolism: an ecological interpretation. Plant, Cell and Environment 16, 511–519.
Lu S, Rieger M. 1993. Effect of temperature preconditioning on ovary freezing tolerance of fully opened peach flowers. Journal of Horticultural Science & Biotechnology 68, 343–347.
Mayr S, Charra-Vaskou K. 2007. Winter at the alpine timberline causes complex within-tree patterns of water potential and embolism in Picea abies. Physiologia Plantarum 131, 131–139.
Mayr S, Cochard H, Améglio T, Kikuta SB. 2007. Embolism formation during freezing in the wood of Picea abies. Plant Physiology 143, 60–67. Mayr S, Gruber A, Bauer H. 2003. Repeated freeze–thaw cycles induce embolism in drought stressed conifers (Norway spruce, stone pice). Planta 217, 436–441.
Mayr S, Rosner S. 2011. Cavitation in dehydrating xylem of Picea abies: energy properties of ultrasonic emissions reflect tracheid dimensions. Tree Physiology 31, 59–67.
Mayr S, Sperry JS. 2010. Freeze–thaw-induced embolism in Pinus
contorta: centrifuge experiments validate the ‘thaw–expansion hypothesis’ but conflict with ultrasonic emission data. New Phytologist 185,
1016–1024.
Mayr S, Wolfschwenger M, Bauer H. 2002. Winter-drought induced embolism in Norway spruce (Picea abies) at the Alpine timberline. Physiologia Plantarum 115, 74–80.
Mayr S, Zublasing V. 2010. Ultrasonic emissions from conifer xylem exposed to repeated freezing. Journal of Plant Physiology 167, 34–40. Mazur P. 1963. Kinetics of water loss from cells at subzero temperatures and the likelihood of intracellular freezing. Journal of General Physiology 47, 347–369.
Mazur P. 1969. Freezing injury in plants. Annual Review of Plant Physiology 20, 419–448.
Mazur P. 1984. Freezing of living cells: mechanisms and implications. American Physiological Society 84, 0363–6143.
Neuner G, Pramsohler M. 2006. Freezing and high temperature thresholds of photosystem 2 compared to ice nucleation, frost and heat damage in evergreen subalpine plants. Physiologia Plantarum 126, 196–204.
Ogaya R, Penuelas J. 2007. Seasonal ultrasonic acoustic emissions of Quercus ilex L. trees in a Mediterranean forest. Acta Physiologiae Plantarum 29, 407–410.
Palta JP, Levitt J, Stadelmann EJ, Burke MJ. 1977. Dehydration of onion cells: a comparison of freezing vs. desiccation and living vs. dead cells. Physiologia Plantarum 41, 273–279.
Pittermann J, Sperry JS. 2003. Tracheid diameter is the key trait determining the extent of freezing-induced embolism in conifers. Tree Physiology 23, 907–914.
Pittermann J, Sperry JS. 2006. Analysis of freeze–thaw embolism in conifers: the interaction between cavitation pressure and tracheid size. Plant Physiology 140, 374–382.
Poirier M, Lacointe A, Améglio T. 2010. A semi-physiological model of cold hardening and dehardening in walnut stem. Tree Physiology 30, 1555–1569. Ponomarenko A, Vincent O, Pietriga A, Cochard H, Badel E,
Marmottant P. 2014. Ultrasonic emissions reveal individual cavitation bubbles in water-stressed wood. Journal of the Royal Society Interface 11, 20140480. Pramsohler M, Hacker J, Neuner G. 2012. Freezing pattern and frost killing temperature of apple (Malus domestica) wood under controlled conditions and in nature. Tree Physiology 32, 819–828.
Rajashekar CB, Burke MJ. 1982. Liquid water during slow freezing based on cell water relations and limited experimental testing. In: Li PH, Sakai A. eds. Plant cold hardiness and freezing stress: mechanisms and crop implications, Volume 2, New York: Academic Press, pp. 211–220. Rajashekar CB, Li PH, Carter JV. 1983. Frost injury and heterogeneous ice nucleation in leaves of tuber-bearing Solanum species. Ice nucleation activity of external source of nucleants. Plant Physiology 71, 749–755. Raschi A, Scarascia Mugnozza G, Surace R, Valentini R, Vazzana C. 1989. The use of ultrasound technique to monitor freezing and thawing of water in plants. Agriculture, Ecosystems & Environment 27, 411–418. Robson DJ, McHardly WJ, Petty JA. 1988. Freezing in conifer xylem. 2. Pit aspiration and bubble formation. Journal of Experimental Botany 39, 1617–1621.
Rodrigo J. 2000. Spring frosts in deciduous fruit trees-morphological damage and flower hardiness. Scientia Horticulturae 85, 155–173. Ruelland E, Vaultier MN, Zachowski A, Hurry V. 2009. Cold signalling and cold acclimation in plants. Advances in Botanical Research 4, 35–150. Sakai A, Larcher W. 1987. Frost survival of plants. Responses and adaptation to freezing stress. Springer Verlag 62, 321 pp.
Salleo S, Lo Gullo MA. 1986. Xylem cavitation in nodes and internodes of whole Chorisia insignis H. B. et K. plants subjected to water stress: relations between xylem conduit size and cavitation. Annals of Botany 58, 431–441.
Salleo S, Nardini A, Pitt F, Lo Gullo MA. 2000. Xylem cavitation and hydraulic control of stomatal conductance in laurel (Laurus nobilis L.). Plant, Cell & Environment 23, 71–79.
Sevanto S, Holbrook NM, Ball MC. 2012. Freeze/thaw-induced embolism: probability of critical bubble formation depends on speed of ice formation. Frontiers in Plant Sciences 3, 107.
Sevanto S, Suni T, Pumpanen J, Grönholm T, Kolari P, Nikinmaa E, Hari P, Vesala T. 2006. Wintertime photosynthesis and water uptake in a boreal forest. Tree Physiology 26, 749–757.
Sparks JP, Black RA. 2000. Winter hydraulic conductivity and xylem cavitation in coniferous trees from upper and lower treeline. Arctic, Antartic, and Alpine Research 32, 101–106.
Sparks JP, Campbell GS, Black RA. 2001. Water content, hydraulic conductivity, and ice formation in winter stems of Pinus contorta: a TDR case study. Oecologia 127, 468–475.
Sperry JS, Holbrook NM, Zimmermann MH, Tyree MT. 1987. Spring filling of xylem vessels in wild grapevine. Plant Physiology 83, 414–417.
Sperry JS, Nichols KL, Sullivan JEM, Eastlack SE. 1994. Xylem embolism in ring-porous, diffuse-porous, and coniferous trees of northern Utah and interior Alaska. Ecology 75, 1736–1752.
Sperry JS, Robson DG. 2001. Xylem cavitation and freezing in conifers. In: Bigras FJ, Colombo SJ. eds. Conifer cold hardiness , Kluwer Academic Publishers: the Netherlands, pp 121–136.
Sperry JS, Sullivan JEM. 1992. Xylem embolism in response to freeze– thaw cycles and water stress in ring-porous, diffuse-porous, and conifer species. Plant Physiology 100, 603–613.
Steponkus PL. 1984. Role of the plasma membrane in freezing injury and cold acclimation. Annual Review of Plant Physiology 35, 543–584. Steponkus PL, Webb MS. 1992. Freeze-induced dehydration and membrane destabilization in plants. In: Someao GN, Osmond CB, Bolis CL, eds. Water and life , Berlin/Heidelberg: Springer-Verlag, pp. 338–362.
Steppe K, Cochard H, Lacointe A, Améglio T. 2012. Could rapid diameter changes be facilitated by a variable hydraulic conductance? Plant, Cell and Environment 35, 150–157.
Stuart SA, Choat B, Martin KC, Holbrook NM, Ball MC. 2007. The role of freezing in setting the latitudinal limits of mangrove forest. New Phytologist 173, 576–583.
Sucoff E. 1969. Freezing of conifer xylem and the cohesion-tension theory. Physiologia Plantarum 22, 424–431.
Torres-Ruiz JM, Cochard H, Mayr S, Beikircher B, Diaz-Espejo A, Rodriguez-Dominguez CM, Badel E, Fernandez JE. 2014. Vulnerability to cavitation in Olea europaea current-year shoots: more support to the open-vessel artefact with centrifuge and air-injection techniques. Physiologia Plantarum 152, 465–474.
Tyree MT, Davis SD, Cochard H. 1994. Biophysical perspectives of xylem evolution: is there a tradeoff of hydraulic efficiency for vulnerability to dysfunction? IAWA Journal 15, 335–360.
Tyree MT, Zimmermann MH. 2002. Xylem structure and the ascent of sap . Berlin: Springer-Verlag.
Uemura M, Tominaga Y, Nakagawara C, Shigematsu S, Minami A, Kawamura Y. 2006. Responses of the plasma membrane to low temperatures. Physiologia Plantarum 126, 81–89.
Utsumi Y, Sano Y, Fujikawa S, Funada R, Ohtan J. 1998. Visualization of cavitated vessels in winter and refilled vessels in spring in diffuse-porous trees by cryo-scanning electron microscopy. Plant Physiology 117, 1463–1471.
Utsumi Y, Sano Y, Funada R, Fujikawa S, Ohtani J. 1999. The progression of cavitation in earlywood vessels of Fraxinus mandshurica var japonica during freezing and thawing. Plant Physiology 121, 897–904. Van As H. 2007. Intact plant MRI for the study of cell water relations, membrane permeability, cell-to-cell and long-distance water transport. Journal of Experimental Botany 58, 743–756.
Vergeynst L, Dierick M, Bogaerts J, Cnudde V, Steppe K. 2014. Cavitation: a blessing in disguise? New method to establish vulnerability curves and assess hydraulic capacitance of woody tissues. Tree Physiology 35, 400–409.
Weiser RL, Wallner SJ. 1988. Freezing woody plant stems produces acoustic emissions. Journal of the American Society for Horticultural Science 113, 636–639.
Wheeler JK, Huggett BA, Tofte AN, Rockwell FE, Holbrook NM. 2013. Cutting xylem under tension or super-saturated with gas can generate PLC and the appearance of rapid recovery from embolism. Plant, Cell & Environment 36, 1938–1949.
Winget CH, Kozlowski TT. 1964. Winter shrinkage in stems of forest trees. Journal of Forestry 62, 335–337.
Wolfe J, Bryant G. 2001. Cellular cryobiology: thermodynamic and mechanical effects. International Journal of Refrigeration 24, 438–450.
Zweifel R, Häsler R. 2000. Frost-induced reversible shrinkage of bark of mature, subalpine conifers. Agricultural and Forest Meteorology 102, 213–222.
Zweifel R, Item H, Häsler R. 2000. Stem radius changes and their relation to stored water in stems of young Norway spruce trees. Trees 15, 50–57.