Geophysical Journal International
Geophys. J. Int. (2014)199, 968–980 doi: 10.1093/gji/ggu302
GJI Seismology
Long-period surface motion of the multipatch
M
w9.0 Tohoku-Oki
earthquake
Panos A. Psimoulis,
1,2Nicolas Houli´e,
2,3Clotaire Michel,
4Michael Meindl
2and Markus Rothacher
21Department of Civil Engineering, Nottingham Geospatial Institute, The University of Nottingham, Nottingham, NG7 2TU, United Kingdom.
E-mail:[email protected]
2Geodesy and Geodynamics Lab., Institute of Geodesy and Photogrammetry, ETH Zurich, Zurich 8093, Switzerland 3Seismology and Geodynamics, Institute of Geophysics, ETH Zurich, Zurich 8092, Switzerland
4Swiss Seismological Service, ETH Zurich, Zurich 8092, Switzerland
Accepted 2014 July 31. Received 2014 July 31; in original form 2014 February 12
S U M M A R Y
We show that it is possible to capture the oscillatory ground motion induced by the Tohoku-Oki event for periods ranging from 3 to 100 s using precise point positioning. We find that the ground motions of the sedimentary basins of Japan were large (respectively>0.15 m s–1 and>0.15 m s–2 for velocity and acceleration) even for periods larger than 3 s. We compare geodetic observables with a ground motion prediction equation designed for Japan seismicity and find that the spectral acceleration is well estimated for periods larger than 3 s and distances ranging from 100 to 500 km. At last, through the analysis of the displacement attenuation plots, we show that the 2011 Tohoku-Oki event is likely composed of multiple rupture patches as suggested before by time-reversal inversions of seismic data.
Key words: Satellite geodesy; Transient deformation; Earthquake ground motions; Surface
waves and free oscillations; Early warning.
1 I N T R O D U C T I O N
For solid Earth investigation, high-rate GPS is nowadays an es-sential tool in the study of transient deformation, seismic source at depth, or accurate determination of strain rate and surface ve-locity fields. In the field of engineering, high-rate GPS is used to determine the deformation or the motion of structures (bridges, high buildings, etc.) in time (C¸ elebi & Sanli2002; Psimoulis et al.2008). Koketsu & Miyake (2008) showed that long-period ground motion is also of interest for the increasing number of large civil engineer-ing structures such as bridges and tall buildengineer-ings since far-distance resonance and short-distance directivity could occur. In the current study we investigate whether GPS is reliable and accurate in the determination of oscillatory ground motions (acceleration, velocity and displacement) for frequencies lower than or equal to 0.33 Hz.
Peak ground accelerations and velocities (PGA, PGV) are rou-tinely computed using seismic data in near real-time (minutes or less) in the 0.5–25 Hz frequency range (typically) in order to as-sess the possible consequences of an earthquake shortly after its occurrence. The relationship between magnitude and peak ground motions of an event is distorted by the interaction between seismic waves and the structures (sedimentary basins, fault systems, etc.) sampled during their travel from the source (e.g. Roten et al.2011 or Denolle et al.2013). Ground motion prediction equations (GM-PEs) predict that the peak motions representative of longer periods,
such as the spectral acceleration (SA) at 3 s depend proportionally more on the event’s magnitudes than PGA or PGV (e.g. Zhao et al. 2006). Nevertheless, few GMPEs for peak motions representative of long-periods are available in the literature due to the limited amount of broadband data (Cauzzi & Faccioli2008). For this reason, peak ground displacements (PGDs) are generally not available and prox-ies like the displacement response spectrum (DRS; 10 s) are used (Cauzzi & Faccioli2008). We explore whether GPS can contribute to GMPEs but also if the seismic source can be better characterized using long-period surface oscillatory motions.
As seismic waveforms, GPS time-series provide insights into surface transients observed during seismic wave propagation or during a seismic rupture (Larson et al.2003; Bock et al. 2004, 2011; Ji et al. 2004; Miyazaki et al.2004; Blewitt et al.2006; Kobayashi et al.2006; Ohta et al.2006,2012; Emore et al.2007; Wang et al.2007; Yokota et al.2009; Delouis et al.2010; Feng
et al.2010; Avallone et al.2011; Houli´e et al.2011; Mitsui & Heki 2012; Wright et al.2012; Guo et al.2013; Meng et al.2013; Houli´e
et al.2014; Psimoulis et al.2015), tsunami generation for early warning (Blewitt et al.2006,2009; Sobolev et al.2007; Crowell
et al.2009; Behrens et al.2010; Ohta et al.2012; Li et al.2013a), changes in ionosphere status (Ducic et al.2003; Mai & Kian2009; Galvan et al.2012; Karia et al.2012), volcanic plumes (Houli´e et al. 2005,2006; Newman et al.2012), water vapour delays (Perler et al. 2011; Hurter et al.2012), or moment tensor (O’Toole et al.2012,
Surface motion of the Tohoku-Oki earthquake 969
Figure 1. The EW displacement time-series for the GPS site closest to the epicentre (GPS 0550;∼75 km away) and for a remote site (GPS 0998; ∼650 km); time origin corresponds to the earthquake occurrence. The time difference between the two responses reflects the delay of the arrival of the seismic signal at the station far from the epicentre.
2013). However, apart from few exceptions (i.e. see Ohta et al.2012; Wright et al.2012), the studies listed above did not make use of real-time or near real-time data processing strategies. Precise point positioning (PPP) allows to monitor the motion of standalone GPS sites (Blewitt2008; Ge et al.2008; Jokinen et al.2013). GPS, which is accurate up to a few millimetres for high-frequency oscillations in differential mode (Psimoulis & Stiros2008,2012), is accurate at the centimetre level in PPP mode (Moschas et al.2014), accuracy which is sufficient to determine the surface displacement (Fig.1) following large events (Mw> 7.0). The PPP GPS time-series have
not been used until today as a tool to describe the surface oscillatory motion. In this study, we propose to use PPP time-series processed for the GEONET continuous GPS (CGPS) sites to study the ground motions that followed the 2011 Tohoku-Oki event.
The Tohoku-Oki event (origin time T0at 05:46:23 UTC on 2011
March 11) and the subsequent tsunami stroke Japan with a heavy impact on structures. The rupture area is exceptionally compact for such magnitude (∼Mw9.0 and L∼ 500 km, to be compared with
the 1000 km of rupture of the 2004 Sumatra event with a simi-lar magnitude, Vigny et al.2005) with most of the slip contained above 30 km depth and a maximum slip on the fault of nearly 50 m (Koketsu et al.2011; Suzuki et al.2011; Yagi & Fukahata2011; Yue & Lay2011). Because of the poor coverage near the epicentre, the slip distribution near the surface is not well constrained. Other studies (Maercklin et al.2012; Roten et al.2012) confirmed that the long-period (10–20 s) maximum slip was up to 50 m but also sug-gested that the Tohoku-Oki event was indeed composed of multiple ruptures of smaller magnitudes (<Mw8.8).
2 D AT A 2.1 GPS data
The Mw9.0 earthquake off the Pacific coast of Tohoku-Oki on 2011
March 11 was fully recorded by the GEONET network (Sagiya 2004), operated by the Geospatial Information Authority of Japan (GSI). The GEONET network is composed of over 1200 contin-uously observing GPS receivers (with an average spacing of 20
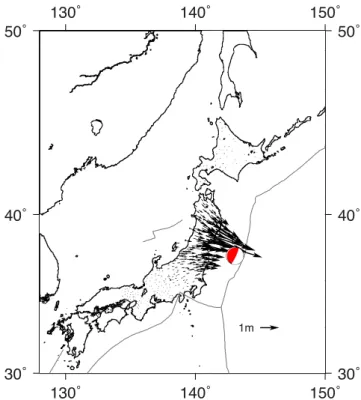
Figure 2. Precise point positioning (PPP) coseismic horizontal displace-ment field for the Tohoku-Oki event measured by the GEONET GPS network at t= T0+300 s.
km). We processed 1 Hz GPS records from 847 GEONET stations of 15-hr duration, fully covering the earthquake period. The data was analysed with the Bernese GPS Software (Dach et al.2007). The data were post-processed in a PPP mode using state-of-the-art models and a-priori information of highest quality from the Center for Orbit Determination in Europe (Bock et al.2009; Dach et al. 2009). As an example for the results obtained, Fig.2shows the dis-placement field at 300 s after the origin time (T0). The displacement
time-series in North, East, and vertical components were established separately for each station. The GPS displacement time-series show an a posteriori formal accuracy of about 1 cm in the horizontal and 2 cm in the vertical component, respectively (Psimoulis et al.2015).
2.2 Strong motion data
The largest strong-motion networks of Japan called K-NET (Kyoshin network) and KiK-net (Kiban-Kyoshin network) consist of 1034 and 660 stations, respectively (Aoi et al.2011). The main difference of the two networks is that the K-NET stations are located mainly on thick sedimentary sites, while the KiK-net stations are deployed on rock or thin sedimentary sites, as it is a subnet of the Hi-net (high-sensitivity seismograph network) primarily designed for highly sensitive seismic observations. Consequently, the K-NET and KiK-net triggering thresholds are different (2 and 0.2 cm s–2,
Aoi et al.2004). Furthermore, the K-NET stations are installed on the ground surface, while each KiK-net site hosts two instru-ments, one installed at the surface and the second at the bottom of a borehole of 100–200 m depth.
The Mw9.0 earthquake of Tohoku-Oki 2011 was well recorded by
the two strong-motion networks. Raw data of strong-motion records from 700 K-NET sites and 525 KiK-net sites were available. The records of three components, corresponding to the north, east and vertical directions, were sampled at 100 Hz and up to 300 s duration. The acceleration of each site was derived by correcting the raw
Figure 3. KiK-net (a), K-NET (b) and GEONET GPS (c) sites used in this study. The very closely located sites of GPS and strong-motion networks are indicated with red triangles. The red star indicates the epicentre of the Tohoku-Oki earthquake in 2011.
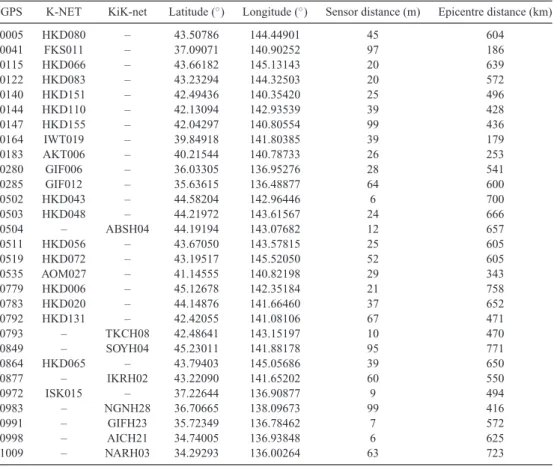
Table 1. The closely located GPS and strong-motion sites of K-NET and KiK-net with their location (latitude, longitude) and distance from the epicentre.
GPS K-NET KiK-net Latitude (◦) Longitude (◦) Sensor distance (m) Epicentre distance (km)
0005 HKD080 – 43.50786 144.44901 45 604 0041 FKS011 – 37.09071 140.90252 97 186 0115 HKD066 – 43.66182 145.13143 20 639 0122 HKD083 – 43.23294 144.32503 20 572 0140 HKD151 – 42.49436 140.35420 25 496 0144 HKD110 – 42.13094 142.93539 39 428 0147 HKD155 – 42.04297 140.80554 99 436 0164 IWT019 – 39.84918 141.80385 39 179 0183 AKT006 – 40.21544 140.78733 26 253 0280 GIF006 – 36.03305 136.95276 28 541 0285 GIF012 – 35.63615 136.48877 64 600 0502 HKD043 – 44.58204 142.96446 6 700 0503 HKD048 – 44.21972 143.61567 24 666 0504 – ABSH04 44.19194 143.07682 12 657 0511 HKD056 – 43.67050 143.57815 25 605 0519 HKD072 – 43.19517 145.52050 52 605 0535 AOM027 – 41.14555 140.82198 29 343 0779 HKD006 – 45.12678 142.35184 21 758 0783 HKD020 – 44.14876 141.66460 37 652 0792 HKD131 – 42.42055 141.08106 67 471 0793 – TKCH08 42.48641 143.15197 10 470 0849 – SOYH04 45.23011 141.88178 95 771 0864 HKD065 – 43.79403 145.05686 39 650 0877 – IKRH02 43.22090 141.65202 60 550 0972 ISK015 – 37.22644 136.90877 9 494 0983 – NGNH28 36.70665 138.09673 99 416 0991 – GIFH23 35.72349 136.78462 7 572 0998 – AICH21 34.74005 136.93848 6 625 1009 – NARH03 34.29293 136.00264 63 723
data for the gain, converting the corresponding record time from UTC to GPS time and then by applying the time correction for 15 leap seconds. In order to be consistent with the recorded motion of the GPS and K-NET sites, only KiK-net surface records were investigated in this study.
3 R E S U L T S
3.1 Consistency of GPS and strong-motion data
The evaluation of the consistency of GPS and strong-motion records at high frequencies must be completed for sites located very closely.
In previous studies, the GPS and strong-motion sites with an inter-distance of less than 1 km were assumed as collocated (Melgar et al. 2013). In our study, we used an even more conservative approach by using only the very closely located GPS and strong-motion sites, with an interdistance less than 100 m. In total, we identified 29 very closely located sites of the GPS and strong-motion networks (Fig.3), comprising 21 K-NET and 8 KiK-net sites (Table1).
For these sites we assume that the GPS and strong-motion records are not shifted by a significant time difference (<1 s), keeping in mind that the sampling rate (1 Hz) of the GPS network is low compared to the sampling rate of the strong-motion network (100 Hz).
Surface motion of the Tohoku-Oki earthquake 971
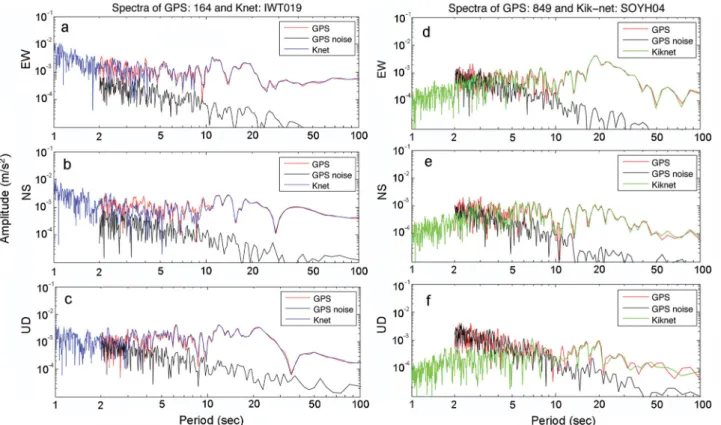
Figure 4. Spectra of derived acceleration time-series using K-NET, KiK-net and GPS data for two sites: (a–c) close (179 km) and (d–f) far (771 km) from the epicentre. The solid black line corresponds to the spectra of the GPS acceleration time-series before the occurrence of the earthquake indicating the noise level.
Figure 5. The initial acceleration time-series of the very closely located sites of K-NET IWT019 (blue solid line) and GPS 0164 (dashed red line) and the derived time-series after filtering for the 3–10 and 10–100 s period bands. The time corresponds to seconds since the earthquake occurrence.
The evaluation of the consistency of the GPS and the strong-motion sensors was examined by comparing the spectra of the two records and assessing them in their common frequency range (0–0.5 Hz). The usual technique of integration of strong-motion records for the computation of velocities and displacements was not followed due to the significant accumulated error (Stiros 2008), the large duration of the strong-motion records (up to 300 s) and the signifi-cant coseismic displacement (up to 2–3 m), which would make the estimation of the long-period displacement time-series unreliable (Boore2003).
Thus, instead of integrating the strong-motion records, the GPS displacement series were differentiated twice resulting in accel-eration time-series. The derived accelaccel-erations are affected also by errors due to the differentiation, which, however, do not accumulate. These differentiation errors affect mainly the short-period accelera-tion (2–3 s), due to the high short-period noise of GPS measurements relatively to the short time step of the differentiation. Furthermore, the error of the derived accelerations is expected to be higher for the vertical component due to the higher noise level of the corre-sponding PPP results.
In Fig.4, we present the spectra of the GPS and the K-NET ac-celeration time-series of the east–west (EW), north–south (NS) and up–down (UD) components for two representative closely located sites, one close (179 km; Figs4a–c) and one far (771 km; Figs4d–f) from the epicentre. In addition, the spectra of the GPS acceleration time-series, corresponding to the time interval before the seismic event, are shown in Fig.4as black lines. These spectra provide information on the basic noise of the acceleration time-series de-rived from GPS. For periods above 3–4 s, the GPS noise is lower than the seismic signal for the horizontal component. This supports the consistency of GPS and K-NET spectra (Figs4a–c) mainly for periods above 3 s, while KiK-net strong-motion spectra prove to be slightly less consistent (Figs4d–f) for the periods below 5 s. This is the case in general for sites far from the epicentre (>600 km) where the seismic signal is weak relative to the PPP noise and the S/N decreases, especially for short-periods (<5 s) and for the vertical component (period<10 s). However, such phenomena do not affect this study, as it is focusing on the use of the horizontal components and long-periodic oscillations (>3 s), which usually are not included in the ground motion parameters computation.
3.2 Computation of MGA, MGV and MGD
The maximum ground acceleration (MGA), velocity (MGV) and displacement (MGD) were computed from GPS and strong-motion records for short- (3–10 s) and long-period (10–100 s) domains. The strong-motion records were integrated once and twice into ve-locities and displacements and the GPS records were differentiated once and twice to obtain velocities and accelerations. The derived strong-motion and GPS time-series were filtered for a short- (3–10 s) and a long-period (10–100 s) band. Fig.5shows the accelera-tion time-series of the GPS and strong-moaccelera-tion instruments that are closely located for the two period bands. For each type of sensor, we compute the absolute maxima (corresponding to MGA, MGV and MGD) of acceleration, velocity, and displacement time-series of every site of each network. Figs6(a)–(c) show the MGA, MGV and MGD maps for the two period bands. As expected, by comparing the GPS and the strong-motion networks, GPS seems to be more sen-sitive to long-period ground displacements and the strong-motion sensors to short-period accelerations.
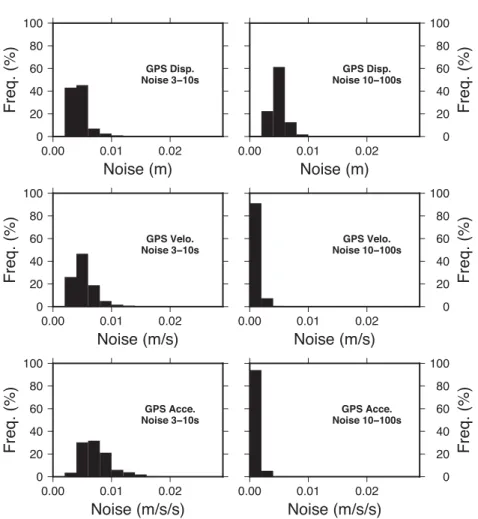
The noise of the GPS acceleration, velocity and displacement time-series was estimated by analysing the time interval before the seismic event, where all the sites are assumed not to be affected by motions. Following the methodology of MGA, MGV and MGD, the GPS noise displacement time-series were differentiated once and twice and subsequently filtered for the two period bands (3–10 and 10–100 s). The maximum value of each resulting time-series expresses the maximum noise level for each GPS site and for each quantity (acceleration, velocity and displacement). In Table2the mean average and the standard deviation of the estimated maxi-mum noise values for the horizontal component and for the two examined period bands are listed. All the estimated MGA, MGV and MGD values of the GPS sites are above their respective un-certainty maxima, with the latter computed as the mean maximum error+ 3σ zone (2.0 cm s–2, 1.5 cm s–1and 1.0 cm, Fig.7). The
level of the estimated maximum noise is smaller than that in other studies (e.g. Wright et al.2012), due to the limitation of the noise level by filtering the GPS time-series for specific period bands.
The qualitative examination of Fig.6shows that strong-motion and GPS provide a consistent estimation of MGA, MGV and MGD
Figure 6. (a) Maximum ground acceleration maps for Kinet (top), K-NET (middle), and GPS (bottom) for the two period bands (3–10 and 10– 100 s). (b) Maximum ground velocity maps for KiK-net (top), K-NET (middle) and GPS (bottom) for the two period bands (3–10 and 10–100 s). (c) Maximum ground displacement maps for KiK-net (top panel), K-NET (middle panel) and GPS (bottom panel) for the two period bands (3–10 and 10–100 s). Note the different scale of the 10–100 s band.
Surface motion of the Tohoku-Oki earthquake 973
Figure 6 – continued
for the two examined period domains. Some local differences for the short-period band might reflect weaknesses of GPS in estimat-ing acceleration of low periods (<4–5 s) or local effects, without disturbing though the overall compatibility of the MGA maps.
At long-periods, the maximum displacement map (Fig.6c, right-hand side) is smooth and reflects the distance to the largest slip patch on the fault: the maximum values occur close to the epicentre in the Sendai region with large values along the coast to the South.
Figure 6 – continued
However, in the 3–10 s band (Figs6b and c, left-hand side), the map is more complex and highlights large sedimentary basins. In addition to the Sendai basin, close to the epicentre, the largest values are found in the Kanto plain, known to exhibit resonance frequencies in this band (Yamanaka et al.1989). On the western coast, large values can also be found at the Sakata and Niigata basins, in relation with the large amplification in these frequency band as shown by Mamula et al. (1984).
Table 2. Mean average and standard deviation of the estimated maximum noise values of the dis-placements, velocities and accelerations derived from the PPP time-series for the two examined period bands.
Period 3–10 s Period 10–100 s
Mean average Standard deviation Mean average Standard deviation
Displacement (mm) 4.5 2.3 5.1 2.1
Velocity (mm s–1) 5.5 2.7 1.5 0.9
Acceleration (mm s–2) 7.6 4.0 1.0 0.7
Figure 7. Maximum level of noise derived from the GPS acceleration, velocity and displacement records.
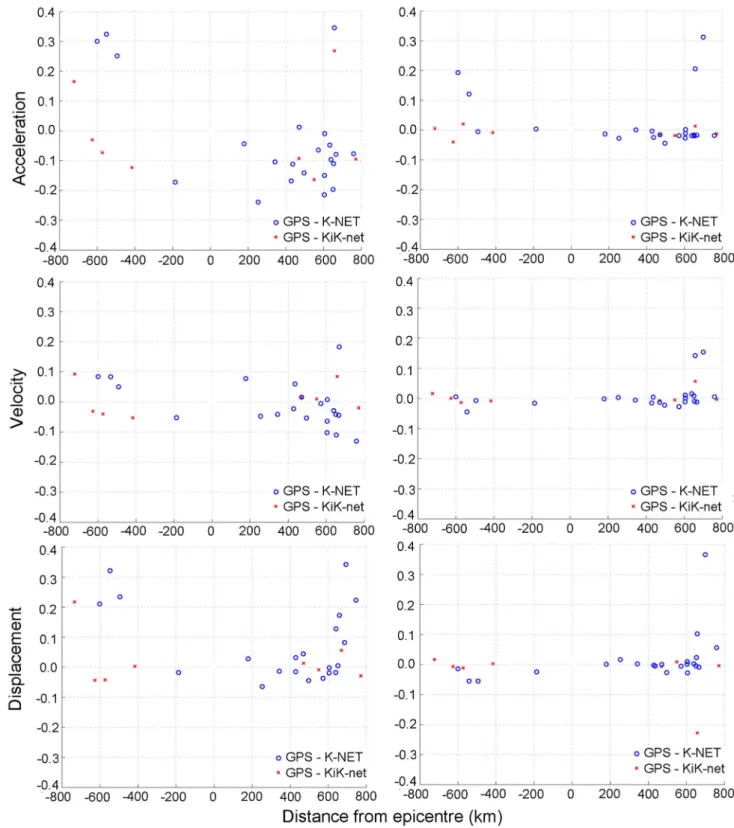
In Fig.8, we show the differences of the estimated GPS and strong-motion MGA, MGV and MGD for the very closely lo-cated sites, normalized to the maximum acceleration, velocity and displacement of the corresponding site. The derived normalized dif-ferences show the good agreement between the solutions of GPS and the strong-motion sensors (relative errors mostly below 10 per cent) with the exception the short-period (3–10 s) MGA and MGD differences. The latter are observed mainly for large distances from the epicentre and they are caused by the relatively small oscilla-tory amplitude of the corresponding accelerations and displace-ments (up to 0.15 m s–2and 0.10 m, respectively). This can be seen
more clearly from the absolute differences of the estimated MGA, MGV and MGD between the GPS and strong-motion sensors inFig. A1, which reveals the small values (<0.03 cm s–2,<0.03 cm s–1
and 0.05 cm, respectively) for the sites located mainly far from the epicentre. The relatively high differences in the displacement (>3 cm) of some sites far from the epicentre (KNET GIF006 -GPS 0280, K-NET ISK015 - -GPS 0972, K-NET HKD043 - -GPS 0502 and K-NET HKD046 - GPS 0504) may be attributed to local effects.
Since we find a general agreement of the GPS records with the seismic data in space and frequency, we compute the SA at 3 s for a 5 per cent damping (Fig.9). In general the long-period signals are not of concern for the safety of typical building or small objects at the surface. However, a large object such as a bridge, a skyscraper or a deep basin might resonate at long-periods, particularly in the 3–10 s range (Anderson et al.1986; Singh et al.1988; Ch´avez-Garc´ıa & Bard 1994; Lermo & Chavez-Garcia1994). Even more rigid
Surface motion of the Tohoku-Oki earthquake 975
Figure 8. Normalized differences of GPS and strong-motion MGA (top panel), MGV (middle panel) and MGD (bottom panel) at the very closely located sites. The positive and negative distances correspond to the position of the sites northward and southward from the epicentre.
structures might be affected by these long-periods due to site effects, soil-structure interaction and liquefaction (Margaris et al. 2010; Assimaki et al.2012). In order to have a baseline in this study, the attenuation of ground motion with distance (SA and acceleration) is compared to the GMPE proposed for Japan by Zhao et al. (2006).
Please note that we use the distance from the epicentre (as computed by USGS) whereas Zhao et al. (2006) assume the shortest distance between a rupture model and the station. We find that SA (3 s) estimates from GPS and strong-motion data are compatible with maximum values predicted by the GMPE (Fig.9).
Figure 9. Spectral acceleration (SA) at 3 s from GMPE (black line) of soft soil (a) and bedrock (b) conditions (Zhao et al.2006) compared to the SA computed from GPS (red dots) and to the SA computed from the strong-motion records (green dots). The error bars indicate the 1σ uncertainty zone of the GMPE.
Figure 10. GPS (red) and strong-motion (grey) MGA, MGV and MGD for the 3–10 s (left-hand panel) and 10–100 s (right-hand panel) period bands. The blue curve shows the average GPS MGA/MGV/MGD values.
Fig.10shows the strong-motion and GPS maximum accelera-tions, velocities and displacements of the two period bands (3–10 and 10–100 s) with respect to the distance to the epicentre. The comparison of MGA with GMPE predictions is less relevant as the long-period signals were not used to build the GMPE. For large dis-tances, several values of MGA exceed the estimated PGA predicted by the GMPE. We remind that this discrepancy is however related to small amplitude motions and more interestingly to the response of basins located at distance>200 km. Basins response is however not sufficient to explain the evolution of MGA, MGV and MGD with distance.
Like the accelerations, the maximum displacement estimates de-pend on the period range. We know that MGD for the short-periods are∼10 times smaller than for long-periods (at ∼1 m), and we might expect that PGD follows the same trend, so does the PGA. In the case of a single rupture patch, we expect a decay of the form 1/distance in the displacement/distance diagrams. In Fig.10(f), displaying long-period oscillatory displacements, the displacement versus distance curve does not constantly decrease, but also increases with a second peak at a distance of about 250 km from the epicentre. For better visibility, the averaged displacement for each distance is shown us-ing a blue line. Such a pattern for long-periods (10–100 s) suggests
Surface motion of the Tohoku-Oki earthquake 977
that the ground motion results from the rupture of two distinct fault segments. The averaged velocity and acceleration is also computed (blue line, Figs10d and e) but the feature of increment of the two variables is not so pronounced mainly due to the weak velocity and acceleration signal in long-periods.
Regarding the oscillatory acceleration and velocity, they appear to be constant for the short-period (3–10 s) and distance up to 250–300 km from the epicentre (Fig.10), and then decrease with distance linearly (in a log–log space). This pattern suggests that the strong short-period oscillatory component is generated in an extended rupture area, which seems to cover the location of the two different rupture patches, as it was revealed by the long-period displacement. The plateau cannot be seen clearly in the short-period oscillatory displacements due to the relatively small signal of the corresponding displacements.
Stewart et al. (2013) extensively compared GMPEs to the ob-served ground motion of the Tohoku-Oki event and could not de-tect the stability of MGA/MGV with increasing distance. Indeed, whereas high-frequency ground motion (intensity measures such as PGA or PGV) is generated by small-scale asperities all along the fault, low-frequency parameters of the ground motion such as displacement is caused by large-scale asperities that may be more localized on the fault as shown by source inversions. These phe-nomena impact the choice of an optimal distance measure: whereas distance to rupture is the most relevant for high frequencies as used by Stewart et al. (2013), distance to major asperities is better for low frequencies. The possibility of the presence of two sources is critical for correct ground motion estimation. Indeed, as the two sources would be shifted relatively to each other, expected ground motion would be larger at larger distances from the first epicentre.
4 C O N C L U S I O N S A N D O U T L O O K
The first conclusion of our work is that both GPS displacement histories and integrated accelerograms are in agreement for the frequency range they have in common (3–100 s). We find that long-period oscillatory ground motions are accurately determined when based on GPS data. The double integration of accelerograms does not impact the precise resolution of the derived displacement data for periods less than 100 s for a large earthquake such as the Tohoku-Oki event.
In future, the PPP GPS data will be processed in near real-time (Branzanti et al.2013) or even real-time (temporal point position-ing; Li et al.2013b), allowing the computation of maximum ground motion to supplement other seismic monitoring systems (Liu et al. 2014; Tu 2014). Considering that the ground acceleration is ex-pected to be more than five times higher at a period of 1 s than the signal at a period of 10 s, the reliability of the GPS for higher sam-pling rates (>1 Hz) will mostly depend on our capability to maintain the noise of the time-series at a level close to cm as suggested by Moschas et al. (2014).
Cauzzi & Faccioli (2008) demonstrated the importance of accu-rate GMPEs at long-periods and the limited amount of available seismic data at these periods. We propose that the future genera-tions of GMPEs should include more long-period data such as GPS displacement time-series, in order to better estimate effects of large magnitude (Mw> 7) events.
Furthermore, we highlight the response of major sedimentary basins of Japan to the shake that followed the Mw9.0 Tohoku-Oki
2011 earthquake, for periods ranging from 3 to 10 s. The increase in oscillatory displacement at∼250 km distance from the epicentre
can be interpreted as a second source of displacement along the fault generated by a second asperity as proposed by the source models of Koketsu et al. (2011), Suzuki et al. (2011) and Maercklin
et al. (2012). Long-period maximum oscillatory displacement can therefore be used as a constraint for source inversions, providing additional constraints on spatial pattern of rupture at depth.
A C K N O W L E D G E M E N T S
This study has been supported by Swiss National Fund (SNF) grants in the framework of the project ‘High-rate GNSS for Seismology’ (number 200021_130061). Dr Ben Edwards’ help is appreciated for the analysis of the strong motion sites.
R E F E R E N C E S
Anderson, J.G., Bodin, P., Brune, J.N., Prince, J., Singh, S.K., Quaas, R. & On˜ate, M., 1986. Strong ground motion from the Michoacan, Mexico, earthquake, Science, 233, 1043–1049.
Aoi, S., Kunugi, T. & Fujiwara, H., 2004. Strong-motion seismograph net-work operated by NIED: K-NET and KiK-net, J. Jpn. Assoc. Earthq. Eng., 4(3), 65–74.
Aoi, S., Kunugi, T., Nakamura, H. & Fujiwara, H., 2011. Deployment of new strong motion seismographs of K-NET and KiK-net, in Earthquake Data in Engineering Seismology, Geotech. Geol. Earthq. Eng., 14, 167– 186.
Assimaki, D., Ledezma, C., Montalva, G.A., Tassara, A., Mylonakis, G. & Boroschek, R., 2012. Site effects and damage patterns, Earthq. Spectra, 28(1), S55–S74.
Avallone, A. et al., 2011. Very high rate (10 Hz) GPS seismol-ogy for moderate-magnitude earthquakes: the case of the Mw 6.3 L’Aquila (central Italy) event, J. geophys. Res., 116(B2), B02305, doi:10.1029/2010JB007834.
Behrens, J., Androsov, A., Babeyko, A., Harig, S., Klaschka, F. & Mentrup, L., 2010. A new multi-sensor approach to simulation assisted tsunami early warning, Nat. Hazards Earth Syst. Sci., 10(6), 1085–1100. Blewitt, G., 2008. Fixed point theorems of GPS carrier phase
ambi-guity resolution and their application to massive network process-ing: Ambizap, J. geophys. Res. B: Solid Earth, 113(12), B12410, doi:10.1029/2008JB005736.
Blewitt, G., Kreemer, C., Hammond, W.C., Plag, H.-P., Stein, S. & Okal, E., 2006. Rapid determination of Earthquake magnitude using GPS for Tsunami Warning Systems. Geophys. Res. Lett., 33, L11309, doi:10.1029/2006GL026145.
Blewitt, G., Hammond, W.C., Kreemer, C., Plag, H.-P., Stein, S. & Okal, E., 2009. GPS for real-time earthquake source determination and tsunami warning systems, J. Geod., 83(3–4), 335–343.
Bock, H., Dach, R., J¨aggi, A. & Beutler, G., 2009. High-rate GPS clock corrections from CODE: support of 1 Hz applications, J. Geod., 83(11), 1083–1094.
Bock, Y., Prawirodirdjo, L. & Melbourne, T., 2004. Detection of arbitrary large dynamic ground motions with a dense high-rate GPS network, Geo-phys. Res. Lett., 31, L06604, doi:10.1029/2003GL019150.
Bock, Y., Melgar, D. & Crowell, B., 2011. Real-time strong-motion broad-band displacements from collocated GPS and accelerometers, Bull. seism. Soc. Am., 101, 2904–2925.
Boore, D.M., 2003. Analog-to-digital conversion as a source of drifts in displacements derived from digital recording of ground acceleration, Bull. seism. Soc. Am., 93(5), 2017–2024.
Branzanti, M., Colosimo, G., Crespi, M. & Mazzoni, A., 2013. GPS near-real-time coseismic displacements for the great Tohoku-Oki earthquake, IEEE Geosci. Remote Sens. Lett., 10(2), 372–376.
Cauzzi, C. & Faccioli, E., 2008. Broadband (0.05 to 20 s) prediction of displacement response spectra based on worldwide digital records, J. Seismol., 12(4), 453–475.
Ch´avez-Garc´ıa, F.J. & Bard, P.-Y., 1994. Site effects in Mexico City eight years after the September 1985 Michoacan earthquakes, Soil Dyn. Earthq. Eng., 13, 229–247.
C¸ elebi, M. & Sanli, A., 2002. GPS in pioneering dynamic monitoring of long-period structures, Earthq. Spectra, 18(1), 47–61.
Crowell, B.W., Bock, Y. & Squibb, M.B., 2009. Earthquake early-warning using total displacement waveforms from real-time GPS networks, Seis-mol. Res. Lett., 80(5), 772–782.
Dach, R., Hugentobler, U., Meindl, M. & Fridez, P., 2007. The Bernese GPS Software Version 5.0, 1st edn, Astronomical Institute, University of Bern. Dach, R. et al., 2009. GNSS processing at CODE: status report, J. Geod.,
83(3–4), 353–366.
Delouis, B., Nocquet, J.-M. & Vall´ee, M., 2010. Slip distribution of the February 27, 2010 Mw= 8.8 Maule Earthquake, central Chile, from static and high-rate GPS, InSAR, and broadband teleseismic data, Geophys. Res. Lett., 37, L17305, doi:10.1029/2010GL043899.
Denolle, M.A., Dunham, E.M., Prieto, G.A. & Beroza, G.C., 2013. Ground motion prediction of realistic earthquake sources using the ambient seis-mic field, J. geophys. Res.: Solid Earth, 118(5), 2102–2118.
Ducic, V., Artru, J. & Lognonn´e, P., 2003. Ionospheric remote sensing of the Denali Earthquake Raleigh surface waves, Geophys. Res. Lett., 30(18), 1951, doi:10.1029/2003GL017812.
Emore, G., Haase, J., Choi, K., Larson, K. & Yamagiwa, A., 2007. Recover-ing absolute seismic displacements through combined use of 1-Hz GPS and strong motion accelerometers, Bull. seism. Soc. Am., 97, 357–378. Feng, L., Newman, A.V., Farmer, G.T., Psimoulis, P. & Stiros, S., 2010.
Energetic rupture, coseismic and post-seismic response of the 2008 Mw6.4 Achaia-Elia Earthquake in northwestern Peloponnese, Greece: an indicator of an immature transform fault zone, Geophys. J. Int., 183(1), 103–110.
Galvan, D.A., Komjathy, A., Hickey, M.P., Stephens, P., Snively, J., Tony Song, Y., Butala, M.D. & Manucci, A.J., 2012. Ionospheric signatures of Tohoku-Oki tsunami of March 11, 2011: model comparisons near the epicenter, Radio Sci., 47(4), RS4003, doi:10.1029/2012RS005023. Ge, M., Gendt, G., Rothacher, M., Shi, C. & Liu, J., 2008. Resolution of
GPS carrier-phase ambiguities in Precise Point Positioning (PPP) with daily observations, J. Geod., 82(7), 389–399.
Guo, A., Wang, Y., Li, Z., Ni, S., Wu, W., Liu, G., Zheng, Y. & Simons, M., 2013. Observation of core phase ScS from the mw 9.0 Tohoku-oki earthquake with highrate GPS, Seismol. Res. Lett., 84(4), 594– 599.
Houli´e, N., Briole, P., Nercessian, A. & Murakami, M., 2005. Volcanic plume above Mount St. Helens detected with GPS, EOS, Trans. Am. geophys. Un., 86(30), 277–281.
Houli´e, N., Briole, P., Bonforte, A. & Puglisi, G., 2006. Large scale ground deformation of Etna observed by GPS between 1994 and 2001, Geophys. Res. Lett., 339(2), L02309, doi:10.1029/2005GL024414.
Houli´e, N., Occhipinti, G., Shapiro, N., Lognonn´e, P. & Murakami, M., 2011. New approach to detect seismic surface waves in 1 Hz-sampled GPS time series, Sci. Rep., 1(44), doi:10.1038/srep00044.
Houli´e, N., Dreger, D. & Kim, A., 2014. GPS source solution of the 2004 Parkfield earthquake, Sci. Rep., 4, 3646, doi:10.1038/srep03646. Hurter, F., Geiger, A., Perler, D. & Rothacher, M., 2012. GNSS
water vapor monitoring in the Swiss Alp, in Proceedings of the Int. Geosci. Rem. Sens. Symp. (IGARSS), 2012 IEEE International, doi:10.1109/IGARSS.2012.6351115.
Ji, C., Larson, K., Tan, Y., Hudnut, K. & Choi, K., 2004. Slip history of the 2003 San Simeon earthquake constrained by combining 1-Hz GPS, strong motion, and teleseismic data, Geophys. Res. Lett., 31, L17608, doi:10.1029/2004GL020448.
Jokinen, A., Feng, S., Schuster, W., Ochieng, W., Hide, C., Moore, T. & Hill, C., 2013. Integrity monitoring of fixed ambiguity Precise Point Positioning (PPP) solutions, Geosp. Inf. Sci., 16(3), 141–148.
Karia, S., Sarkar, S. & Pathak, K., 2012. Analysis of GPS-based TEC and electron density by the DEMETER satellite before the Sumatra earthquake on 30 September 2009, Int. J. Remote Sens., 33(16), 5119–5134. Kobayashi, R., Miyazaki, S. & Koketsu, K., 2006. Source processes of the
2005 West Off Fukuoka Prefecture earthquake and its largest aftershock
inferred from strong motion and 1-Hz GPS data, Earth Planets Space, 58, 57–62.
Koketsu, K. & Miyake, H., 2008. A seismological overview of long-period ground motion, J. Seismol., 12(2), 133–143.
Koketsu, K. et al., 2011. A unified source model for the 2011 Tohoku earthquake, Earth planet. Sci. Lett., 310, 480–487.
Larson, K., Bodin, P. & Gomberg, J., 2003. Using 1-Hz GPS data to measure deformations caused by the Denali fault earthquake, Science, 300, 1421– 1424.
Lermo, J. & Chavez-Garcia, F.J., 1994. Site effect evaluation at Mexico City: dominant period and relative amplification from strong motion and microtremor records, Soil Dyn. Earthq. Eng., 13, 413–423.
Li, X., Ge, M., Zhang, Y., Wang, R., Xu, P., Wickert, J. & Shuh, H., 2013a. New approach for earthquake/tsunami monitoring using dense GPS net-works, Sci. Rep., 3, doi:10.1038/srep02682.
Li, X., Ge, M., Guo, B., Wickert, J. & Schuh, H., 2013b. Temporal Point Po-sitioning approach for real-time GNSS seismology using a single receiver, Geoph. Res. Lett., 40(21), 5677–5682.
Liu, Z., Owen, S. & Moore, A., 2014. Rapid estimate modeling of perma-nent coseismic displacements for large earthquakes using high-rate global positioning system data, Seismol. Res. Lett., 85(2), 284–294.
Maercklin, N., Festa, G., Colombelli, S. & Zollo, A., 2012. Twin ruptures grew to built up the giant 2011 Tohoku, Japan, earthquake, Sci. Rep., 709(2), 1–7.
Margaris, B. et al., 2010. The 8 June 2008 Mw6.5 Achaia-Elia, Greece earthquake: source characteristics, ground motions, and ground failure, 26(2), 399–424.
Mai, C.-L. & Kian, J.-F., 2009. Reconstruction of ionospheric per-turbation induced by 2004 sumatra tsunami using computerized to-mography technique, IEEE Trans. Geosci. Remote Sens., 47(10), 4, 3303–3312.
Mamula, L., Kudo, K. & Shima, E., 1984. Distribution of ground-motion amplification factors as a function of period (3–15 sec), in Japan, Bull. Earthq. Res. Inst., 59, 467–500.
Melgar, D., Brendan, W.C., Bock, Y. & Haase, J.S., 2013. Rapid modelling of the 2011 Mw 9.0 Tohoku-oki earthquake with seismogeodesy, Geophys. Res. Lett., 40, 2963–2968.
Meng, G., Ren, J., Su, X., Yang, Y., Zhu, Z., Ge, L. & Li, X., 2013. Coseismic deformation of the 2010 Mw 6.9 Yushu earthquake derived from GPS data, Seismol. Res. Lett., 84(1), 57–64.
Mitsui, Y. & Heki, K., 2012. Observation of Earth’s free oscillation by dense GPS array: after the 2011 Tohoku megathrust earthquake, Sci. Rep., 2(931), doi:10.1038/srep00931.
Miyazaki, S. et al., 2004. Modeling the rupture process of the 2003 Septem-ber 25 Tokachi-Oki (Hokkaido) earthquake using 1-Hz GPS data, Geo-phys. Res. Lett., 31, L21603, doi:10.1029/2004GL021457.
Moschas, F., Avallone, A., Saltogianni, N. & Stiros, S., 2014. Strong-motion displacement waveforms using 10-Hz precise point positioning GPS: an assessment based on free oscillation experiments, Earthq. Eng. Struct. Dyn., doi:10.1002/eqe.2426.
Newman, A.V. et al., 2012. Recent geodetic unrest at Santorini Caldera, Greece, Geophys. Res. Lett., 39(6), L06309, doi:10.1029/2012GL051286. Ohta, Y., Meiano, I., Sagiya, T., Kimata, F. & Hirahara, K., 2006. Large surface wave of the 2004 Sumatra-Andaman earthquake captured by the very long baseline kinematic analysis of 1-Hz GPS data, Earth Planet Space, 58, 153–157.
Ohta, Y. et al., 2012. Quasi real-time fault model estimation for near-field tsunami forecasting based on RTK-GPS analysis: application to the 2011 Tohoku-Oki earthquake (Mw9.0), J. geophys. Res., 117, B02311,
doi:10.1029/2011JB008750.
O’Toole, T.B., Valentine, A.P. & Woodhouse, J.H., 2012. Centroid-moment tensor inversions using high-rate GPS waveforms, Geophys. J. Int., 187(3), 1516–1536.
O’Toole, T.B., Valentine, A.P. & Woodhouse, J.H., 2013. Earthquake source parameters from GPS-measured static displacements with potential for real-time application, Geophys. Res. Lett., 40(1), 60–65.
Perler, D., Geiger, A. & Hurter, F., 2011. GPS water vapour tomography: new parameterized approaches, J. Geod., 85(8), 539–550.
Surface motion of the Tohoku-Oki earthquake 979
Psimoulis, P. & Stiros, S., 2008. Experimental assessment of the accuracy of GPS and RTS for the determination of the parameters of oscillation of major structures, Comput.-Aided Civil Infrastruct. Eng., 23(5), 389– 403.
Psimoulis, P. & Stiros, S., 2012. A supervised learning computer-based algorithm to derive the algorithm of oscillations of structures using noisy GPS and Robotic Theodolites (RTS) records, J. Comput. Struct., 92–93, 337–348.
Psimoulis, P., Pytharouli, S., Karambali, D. & Stiros, S., 2008. Poten-tial of Global Positioning System (GPS) to measure frequencies of oscillations of engineering structures, J. Sound Vibrat., 318(3), 606– 623.
Psimoulis, P., Houli´e, N., Meindl, M. & Rothacher, M., 2015. Consistency of GPS and strong-motion records: case study of Mw9.0 Tohoku-Oki 2011 earthquake, Smart Struct. Syst., 26, accepted.
Roten, D., Olsen, K.B., Pechmann, J.C., Cruz-Atienza, V.M. & Magistrale, H., 2011. 3D simulations of M7 earthquakes on the Wasatch fault, Utah. Part I: long-period (0–1 Hz) groung motion, Bull. seism. Soc. Am., 101(5), 2045–2063.
Roten, D., Miyake, H. & Koketsu, K., 2012. A Rayleigh wave back-projection method applied to the 2011 Tohoku earthquake, Geophys. Res. Lett., 39, L02302, doi:10.1029/2011GL050183.
Sagiya, T., 2004. A decade of GEONET: 1994–2003—the continuous GPS observation in Japan and its impact on earthquake studies, Earth Planet Space, 56, xxix–xli.
Singh, S.K., Mena, E. & Castro, R., 1988. Some aspects of source charac-teristics of the 19 September 1985 Michoacan earthquake, and ground motion amplifications in and near Mexico City from strong motion data, Bull. seism. Soc. Am., 78, 451–477.
Sobolev, S.V. et al., 2007. Tsunami early warning using GPS-Shield arrays, J. geophys. Res., 112, B08415, doi:10.1029/2006JB004640.
Stewart, J.P., Midorikawa, S., Graves, R.W., Khodaverdi, K., Kishida, T., Miura, H. & Campbell, K.W., 2013. Implications of the M w 9.0 Tohoku-Oki Earthquake for Ground Motion Scaling with Source, Path, and Site Parameters, Earthq. Spectra, 29(S1), S1–S21.
Stiros, S., 2008. Errors in velocities and displacements deduced from ac-celerographs: an approach based on the theory of error propagation, Soil Dyn. Earthq. Eng., 28, 415–420.
Suzuki, W., Aoi, S., Sekiguchi, H. & Kunugi, T., 2011. Rupture pro-cess of the 2011 Tohoku-Oki megathrust earthquake (M9.0) in-verted from strong-motion data, Geophys. Res. Lett., 38, L00G16, doi:10.1029/2011GL049136.
Tu, R., 2014. Fast determination of displacement by PPP velocity estimation, Geophys. J. Int., 196(3), 1397–1401.
Vigny, C. et al., 2005. Insight into the 2004 Sumatra-Andaman earthquake from GPS measurements in southeast Asia, Nature, 436, 201–206. Wang, G., Boore, D. M., Tang, G. & Zhou, X., 2007. Comparisons of
ground motions from collocated and closely spaced one-sample-per-second Global Positioning System and accelerograph recordings of the 2003M6.5 San Simeon, California, earthquake in the Parkfield Region, Bull. seism. Soc. Am., 97(1B), 76–90.
Wright, T., Houli´e, N., Hildyard, M. & Iwabuchi, T., 2012. Real-time, reliable magnitude for large earthquakes from 1Hz GPS precise point position-ing: the 2011 Tohoku-Oki (Japan) earthquake, Geophys. Res. Lett., 39, L12302, doi:10.1029/2012GL051894.
Yagi, Y. & Fukahata, Y., 2011. Rupture process of the 2011 Tohoku-oki earthquake and absolute elastic strain release, Geophys. Res. Lett., 38(19), L19307, doi:10.1029/2011GL048701.
Yamanaka, H., Seo, K. & Samano, T., 1989. Effects of sedimentary layers on surface-wae propagation, Bull seism. Soc. Am., 79(3), 631–644. Yokota, Y., Koketsu, K., Hikima, K. & Miyazaki, S., 2009. Ability of 1-Hz
GPS data to infer the source process of a medium-sized earthquake: the case of the 2008 Iwate-Miyagi Nairiku, Japan, earthquake, Geophys. Res. Lett., 36, L12301, doi:10.1029/2009GL037799.
Yue, H. & Lay, T., 2011. Inversion of high-rate (1sps) GPS data for rupture process of the 11 March 2011 Tohoku earthquake (Mw9.1), Geophys. Res.
Let., 38, L00G09, doi:10.1029/2011GL048700.
Zhao, J.X. et al., 2006. Attenuation relations of strong ground motion in Japan using site classification based on predominant period, Bull seism. Soc. Am., 96, 898–913.
A P P E N D I X
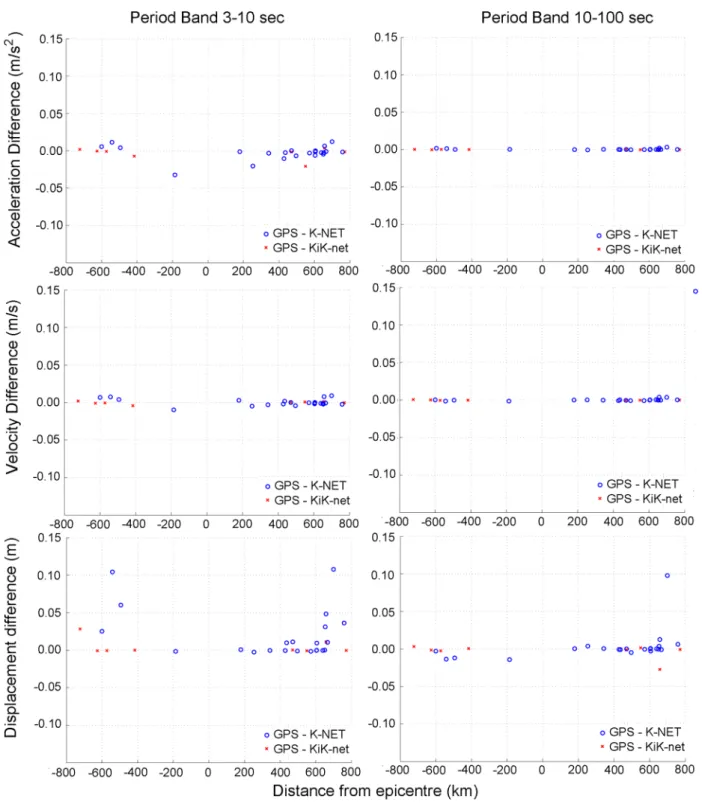
Figure A1. The differences of the GPS and strong-motion MGA (top panel), MGV (middle panel) and MGD (bottom panel) values for each very closely located sites versus the distance from the epicentre. The positive and negative distances correspond to the position of the sites northward and southward from the epicentre.