Publisher’s version / Version de l'éditeur:
Transportation Research Record, 1958, pp. 71-73, 2006-01-22
READ THESE TERMS AND CONDITIONS CAREFULLY BEFORE USING THIS WEBSITE. https://nrc-publications.canada.ca/eng/copyright
Vous avez des questions? Nous pouvons vous aider. Pour communiquer directement avec un auteur, consultez la
première page de la revue dans laquelle son article a été publié afin de trouver ses coordonnées. Si vous n’arrivez pas à les repérer, communiquez avec nous à [email protected].
Questions? Contact the NRC Publications Archive team at
[email protected]. If you wish to email the authors directly, please see the first page of the publication for their contact information.
NRC Publications Archive
Archives des publications du CNRC
This publication could be one of several versions: author’s original, accepted manuscript or the publisher’s version. / La version de cette publication peut être l’une des suivantes : la version prépublication de l’auteur, la version acceptée du manuscrit ou la version de l’éditeur.
Access and use of this website and the material on it are subject to the Terms and Conditions set forth at
Cooling rates in hot-poured bituminous sealants
Collins, P.; Masson, J-F.; Al-Qadi, I. L.
https://publications-cnrc.canada.ca/fra/droits
L’accès à ce site Web et l’utilisation de son contenu sont assujettis aux conditions présentées dans le site LISEZ CES CONDITIONS ATTENTIVEMENT AVANT D’UTILISER CE SITE WEB.
NRC Publications Record / Notice d'Archives des publications de CNRC:
https://nrc-publications.canada.ca/eng/view/object/?id=a793cf83-a153-4005-815f-f72ab4bcc8ce https://publications-cnrc.canada.ca/fra/voir/objet/?id=a793cf83-a153-4005-815f-f72ab4bcc8ce
http://irc.nrc-cnrc.gc.ca
Cooling rat e s in hot -poure d bit um inous
se a la nt s
N R C C - 4 8 3 8 1
C o l l i n s , P . ; M a s s o n , J F . ; A l
-Q a d i , I . L .
A version of this document is published in / Une version de ce document se trouve dans:
85th Annual Meeting of the Transportation Research Board, Washington, D.C., Jan.22-26, 2006, CD-ROM Paper #06-0757, 10 pages.
Cooling rates in hot-poured bituminous sealants
Peter Collins
Institute for Research in Construction
National Research Council of Canada, Ottawa, ON, K1A 0R6, Canada. Tel. (613) 993-9721, Fax (613) 952-8102
E-mail: [email protected]
J-F. Masson
Corresponding author
Institute for Research in Construction
National Research Council of Canada, Ottawa, ON, K1A 0R6, Canada. Tel. (613) 993-2144, Fax (613) 952-8102
E-mail: [email protected]
Imad L. Al-Qadi
Founder Professor of Engineering
Advanced Transporation Research and Engineering Laboratory, Director University of Illinois at Urbana-Champaign
205 N Mathews Ave., MC-250, Urbana, IL 61801 Email: [email protected]
Paper 06-0757, 2006 TRB meeting
ABSTRACT
The performance of bituminous sealants applied to cracks and joints is partly governed by installation. An important installation parameter that has yet to be investigated is the sealant rate of cooling after it is poured hot. Cooling rates affect the time during which traffic must be re-routed, sealant microstructure and rheology, and the adhesion at the sealant/hot-mix asphalt (HMA) interface. In an effort to provide data on sealant cooling rates, the temperature change in three sealants was measured in the field and in the laboratory. The results indicated that sealant bulk temperatures were >50°C lower than the sealant application temperature, typically 180°C, almost immediately after pouring and that sealants bulk
temperatures reached 40°C or less within 15 min. This suggests that traffic could be re-routed for less time than the standard 30 min. The instantaneous sealant temperature at the sealant-substrate interface was also measured to be below 100°C immediately after the pouring of the sealant. This emphasizes the need for sealants with good wetting propensity to maximize the potential for proper adhesion.
INTRODUCTION
Bituminous sealants are used to fill or seal pavement cracks and joints. Their performance is partly governed by installation, but despite state-of-the-art procedures (1, 2), there are still unresolved issues that relate to sealant installation. One of these issues is the cooling rate of the sealant immediately after it is poured, typically between 185 and 195°C. The cooling rate is important for three reasons:
1) Sealants are most often protected from traffic for about 30 min after installation. The benefit of sealant protection is to reduce or eliminate the early tracking of sealants when it is still in a hot and fluid state. There is no available data on the suitability of the 30 min protection period, however. If it is too short, sealant performance may be affected and could be tracked (irreversibly strained) by vehicles. If it is too long, it could be reduced for the benefit of motorists annoyed by the re-routing of traffic.
2) Bituminous hot-poured sealants are polymer-modified bitumens that can contain crumb rubber (3). The thermal history of such mixtures has a large effect on their rheological properties (4, 5). The true cooling rate of sealants must be known to allow for such rates to be used in the laboratory for studies of sealant rheology and performance.
3) The cooling rate may influence the adhesion of the sealant to HMA. When a sealant is hot and its viscosity is low, it may penetrate into microcracks and follow the contour of the irregular HMA surface to provide a sealant/HMA interface with few voids or defects, thus allowing for a better bond (6). If the viscosity increases rapidly due to a high cooling rate, however, such a bond may not fully develop. In other words, pouring of the sealant on a cold surface during installation in winter, late fall, or early spring, may affect adhesion. Before adhesion can be adequately related to sealant viscosity, however, the temperature at the interface after pouring must be determined.
The goal of this paper is to contribute to the three points aforementioned. For this purpose, the cooling rates of three bituminous hot-poured crack sealants were measured in the field and in the laboratory. EXPERIMENTAL
Three sealants N, P and Q, purported to meet the ASTM D6690 (type IV) specification (7), were investigated in the field and in the laboratory. In the field, the sealants were heated and stirred in 1500 L kettles as described before (8). To measure sealant bulk temperatures during cooling, two type-T
thermocouples (TC) were used. One TC was affixed to the bottom of the rout, or crack, with 5-min epoxy glue. The tip was kept bare of epoxy and angled up into the bulk. The other TC was placed about 1 mm into the surface of freshly poured sealant. Data was collected every 20 s for 45 min.
In a similar manner, sealant temperatures were measured after the sealant was poured in 20 mm x 20 mm x 450 mm aluminum troughs that simulated a short segment of a routed crack. To measure sealant
temperatures at the sealant/substrate interface, sealants were heated and remixed in the laboratory in accordance to ASTM D5167 (9). The sealants were poured in the troughs described above and in which thermocouples had been glued to the side of the mold, i.e. at the sealant/substrate interface. Temperature data was collected every 5 s for the first 5 min., and then every 30 s for 2 h.
RESULTS AND DISCUSSION
Cooling of sealant on hot-mix asphalt
Cooling curves for sealant N, poured at 185°C in a rout of 20 mm x 20 mm, are shown in Figure 1. With the pavement temperatures at 35°C, the sealant temperature dropped rapidly after being poured. The maximum sealant temperature measured in the rout was 135°C, 50°C lower than the pouring temperature. Once the sealant was in the rout, the upper surface, exposed to air at about 25°C, cooled more rapidly than the bulk.
The rate of cooling can affect sealant characteristics, with the time to 100°C possibly being of the greater importance. The latter temperature is the cooling onset of the glass transition temperature (Tg) of the polystyrene block in styrene-butadiene copolymers (10) found in sealants (3). Below Tg diffusion is very slow and internal structure becomes fixed (11). It is thus reasonable to assume that below 100°C sealant morphology, i.e., the SBS copolymer and filler(s) distribution in the sealant mass, would be fixed. In this respect, the sealant bulk temperature was 100°C in about 4 min (Figure 1). Within 45 min., the sealant had cooled further to about 40°C, never reaching the pavement temperature of 35°C, which suggests that fresh and dark sealant retains more solar heat than surrounding pavement.
The cooling rate of a sealant depends on its pouring temperature, the pavement temperature, and its cross-section after pouring, i.e., its mass. Figure 2 shows cooling curves for three different sealants and
conditions. Sealants N and Q were both poured in routs of 20 mm x 20 mm, whereas sealant P was poured in unrouted cracks. Sealant P was poured at 165°C, but the maximum sealant temperature registered in the crack was only 90°C. The sealant thus gelled very rapidly in the unrouted crack, much more so than in the routed cracks, where the sealant cross-section (or mass) is larger.
In the case of sealant Q, the maximum temperature registered in the rout was about 50°C lower than the sealant pouring temperature of 175°C, a temperature differential identical to that for sealant N. This may be a coincidence, but it may also be the typical instantaneous cooling of sealants in routed cracks. In contrast to sealants N and P, sealant Q was poured on a fairly cold pavement (9°C). For this reason, the cooling rate of sealant Q was much faster than with the other two sealants, its temperature being down to 100°C after only 1 min (Figure 2).
It is often required that sealants be protected from traffic for at least 30 min after their installation (1), the rationale being that tracking (deformation) of the sealant may occur if it is exposed to traffic too soon. Figures 1 and 2 show that the sealants had reached a constant temperature after 15 min.
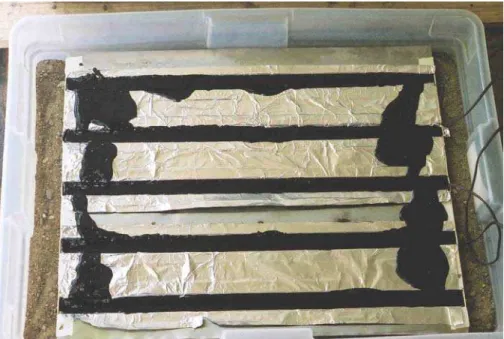
To collect sealants in the field for later analysis in the laboratory, an attempt was made to achieve cooling rates as close as possible to those in Figure 2. For this purpose, aluminum troughs of 20 mm x 20 mm x 450 mm in width, height and length were made (Figure 3). To provide a thermal mass, the troughs were pressed in a box of wet sand, and to allow for easy sealant demolding, the troughs were lined with aluminum foil, which was used to wrap, protect and transport the sealant after it had cooled.
In the troughs, cooling rates for sealants N, P and Q were very similar, with a typical profile shown in Figure 4. The sealant cooling rates were slower in the trough than in the HMA routs, which indicated that the greater mass of HMA over that of the sand box allowed for a more efficient dissipation of heat. Despite the slower cooling rates in the troughs, the time to 100°C was still short, about 7 min. This was considered close enough to the rates in Figure 2 that sealants collected in the field could be taken as true representative of applied sealants, with the consequence that the effect of installation on sealants may be monitored by such sampling. The effect of installation on sealant characteristics is the subject of another paper. Temperatures at the sealant-substrate interface
In an effort to estimate the temperature at the sealant-HMA interface when a sealant is poured in the field, interfacial temperatures were measured in the laboratory by pouring a hot sealant in a trough where thermocouples had been installed (Figure 5). Thermocouple (TC) #1 measured the sealant bulk
temperature; TC2 was meant to measure the temperature on the sealant side of the sealant-HMA interface; whereas TC3 was meant to measure the temperature on the HMA side. As would be expected based on thermocouple placements, the measured temperatures went as TC1>TC2>TC3. With a sealant pouring temperature of 175°C, a maximum bulk temperature of 125°C was measured at TC1, 50°C lower than the pouring temperature, just as in the field (Figure 2). At the interface, TC2 and TC3 measured maxima of 90°C and 75°C, respectively. Hence, the temperatures on either side of the interface were below 100°C. Given the effect of temperature on sealant morphology discussed above, the relatively low temperature at
the interface suggests that a micro-layer of sealant would gel immediately upon contact with the surface. The use of a hot-air lance to heat routs would not be expected to change the interfacial temperature to a significant extent given that the HMA temperature is back to 50°C about 10 s after the passage of the lance (12).
CONCLUSION
The cooling rate of bituminous hot-poured crack sealants is an important parameter of material installation, but it remained undetermined. In this study, the cooling rate of three sealants was measured in the field and in the laboratory. Sealant bulk temperatures were measured to be >50°C lower than the sealant application temperature almost immediately after pouring, depending on the sealant and pavement temperatures, and the sealant cross-section. After 15 min on the ground, the sealants had reached 40°C, a temperature low enough that early sealant deformation (tracking) is not a concern. The corollary of this finding is that the usual 30 min of sealant protection may be excessive and that roadways with treated cracks may be reopen to traffic after 15 min, for the greater benefit of motorists.
The sealant temperature at the interface of a sealant/HMA immediately after pouring the sealant was below 100°C, the estimated temperature for the gelling of sealant microstructure. This suggests that the time for a sealant to wet the HMA surface and to bond to the surface is extremely short. This emphasizes that sealant wetting propensity is of the greatest importance for a sealant to adhere strongly to the pavement.
REFERENCES
1. Masson J-F., S. Boudreau, C. Girard. Guidelines for sealing and filling cracks in asphalt concrete pavement : A best practice. National Guide to Sustainable Municipal Infrastructure, National Research Council Canada, 2003. http://www.infraguide.gc.ca/ bestmunicipal.html.
2. Smith K. L., A. R. Romine. Materials and procedure for sealing and filling cracks in asphalt-surfaced pavements: Manual of practice. Publication No. FHWA-RD-99-147, Federal Highway Administration, Washington D.C. 1999.
3. Masson, J-F., P. Collins, J. Margeson, G. Polomark. Analysis of Bituminous Crack Sealants by Physicochemical Methods. Transportation Research Record No. 1795, 2002, 33-39.
4. Brion, Y., B. Brûlé. Étude des mélanges bitumes-polymères: composition, structure, propriétés. Report PC-6, French Central Laboratory for Roads and Bridges (LCPC), July 1986, p. 67 (in French). 5. Soenen, H., J. De visscher, A. Vanelstraete, P. Redelius. The influence of thermal history on binder
rutting indicators, Int. J. Pav. Mat. Design, in press.
6. Masson, J-F. and M. A. Lacasse. A Review of Adhesion Mechanisms at the Crack Sealant/Asphalt Concrete Interface. Proceedings of the 3rd International Symposium on Durability of Building and Construction Sealants, Fort Lauderdale, Florida, February 2-3, 2000, pp. 259-274.
7. ASTM D6690, Standard Specification for Joint and Crack Sealants, Hot-Applied, for Concrete and Asphalt Pavements, American Society for Testing and Materials, West Conshohocken, PA.
8. Masson, J-F., P. Collins, M. Lowery. Temperature control of hot-poured sealants during the sealing of pavement cracks, Construction and Building Materials, 19 (2005) 423–429.
9. ASTM D5167 Practice for Melting of Hot-Applied Joint and Crack Sealant and Filler for Evaluation, American Society for Testing and Materials, West Conshohocken, PA.
10. Masson, J-F. S. Bundalo-Perc, A. Delgado. Glass Transitions and Mixed Phases in Block SBS, Journal of Polymer Science: Part B, Vol. 43, 276–279 (2005)
11. Flory, P.J. Principles of Polymer Chemistry, Cornell University Press, Ithaca, NY, 1953.
12. Masson, J-F. and M. A. Lacasse. Effect of hot-air lance on crack sealant adhesion, Journal of Transportation Engineering, Vol. 125, 1999, pp. 357-363.
0 20 40 60 80 100 120 140 160 0 5 10 15 20 25 30 35 40 45 Time, min T e mperature, °C Surface Bulk
Figure 1. Temperature decrease for sealant N measured in an HMA rout of 20 mm x 20 mm.
0
40
80
120
160
0
5
10
15
Time, min
Temperature, °C
.
N, 185 °C
P, 165 °C
Q, 175 °C
32 °C
AC surface temp
9 °C
35 °C
Sealant temp.
Figure 3: Field collection by pouring a sealant in troughs pressed into sand. 0 20 40 60 80 100 120 140 160 0 5 10 15 20 25 30 Time (minutes) Temperature (°C) . Trough, bulk HMA, bulk
Figure 4. Temperature decrease for the bulk of sealant N in an HMA rout and in a trough. Sealant temperature was 185°C.
Figure 5. Schematic of the set-up and location of thermocouples 1, 2, and 3 for the measurement of interfacial sealant temperatures in the aluminum mold.