Publisher’s version / Version de l'éditeur:
Vous avez des questions? Nous pouvons vous aider. Pour communiquer directement avec un auteur, consultez la première page de la revue dans laquelle son article a été publié afin de trouver ses coordonnées. Si vous n’arrivez pas à les repérer, communiquez avec nous à [email protected].
Questions? Contact the NRC Publications Archive team at
[email protected]. If you wish to email the authors directly, please see the first page of the publication for their contact information.
https://publications-cnrc.canada.ca/fra/droits
L’accès à ce site Web et l’utilisation de son contenu sont assujettis aux conditions présentées dans le site LISEZ CES CONDITIONS ATTENTIVEMENT AVANT D’UTILISER CE SITE WEB.
Client Report (National Research Council of Canada. Construction), 2016-02-22
READ THESE TERMS AND CONDITIONS CAREFULLY BEFORE USING THIS WEBSITE. https://nrc-publications.canada.ca/eng/copyright
NRC Publications Archive Record / Notice des Archives des publications du CNRC :
https://nrc-publications.canada.ca/eng/view/object/?id=caa3eab8-7a3d-491c-850e-73f1e9cc4da0 https://publications-cnrc.canada.ca/fra/voir/objet/?id=caa3eab8-7a3d-491c-850e-73f1e9cc4da0
NRC Publications Archive
Archives des publications du CNRC
For the publisher’s version, please access the DOI link below./ Pour consulter la version de l’éditeur, utilisez le lien DOI ci-dessous.
https://doi.org/10.4224/23002871
Access and use of this website and the material on it are subject to the Terms and Conditions set forth at
High performance roofing and walls technologies: task 5,
benchmarking the thermal performance of a curtain wall panel through
simulation
Construction
High Performance Roofing and
Walls Technologies
Task 5: Benchmarking the Thermal Performance
of a Curtain Wall Panel through Simulation
Client Report: A1-002844-05
Hamed H. Saber, Gnanamurugan Ganapathy and
Michael A. Lacasse
REPORT A1-002844.05 i
Table of Contents
Table of Contents ... i
List of Figures ... iii
List of Tables ... v
Summary ... vii
Acknowledgements ... ix
1. Background ... 1
2. Objective ... 1
3. Approach and Description ... 1
3.1 Approach ... 1
3.2 Description of test specimen ... 2
3.3 Description of model configuration of test specimen ... 5
4. Results derived from simulation ... 5
4.1 Comparison of U- and R-values derived from simulation and from test ... 6
4.2 Predicted U- and R-values derived from simulation ... 12
4.3 Predicted to total heat loss through curtain wall panel derived from simulation ... 12
4.4 Predicted R-value in relation to emissivity of glazing as derived from simulation ... 12
5. Summary ... 17
REPORT A1-002844.05 iii
List of Figures
Figure 1 – Elevation and sectional drawings of curtain wall test specimen ... 1 Figure 2 – Sectional drawing of curtain wall mullion (Section No. 002/02 of Fig 2); Photo showing end
portion of horizontal section; Sectional drawing of curtain wall mullion at opaque panel (Section No. 002/02 of Fig 1) ... 1 Figure 3 – Location of thermocouples (1-47) o e terior of urtai wall asse l ... 2 Figure 4 – Location of thermocouples (1-47) o i terior of urtai wall asse l ... 2 Figure 5 – Results of thermocouples measurements (1-47) for e terior of urtai wall asse l a d
showing average steady state temperatures are given locations ... 1 Figure 6 – Results of thermocouples measurements (1-47) for i terior of urtai wall asse l a d
showing average steady state temperatures are given locations ... 1 Figure 7 – Results of thermocouples measurements (1-47) for e terior of urtai wall assembly and
showing average steady state temperatures are given locations ... 2 Figure 8 – Results of thermocouples measurements (1-47) for i terior of urtai wall asse l a d
showing average steady state temperatures are given locations ... 2 Figure 9 – Predicted (by simulation) R-value (surface-to-surface) of curtain wall panel in relation to
fraction (by volume) of air present in the low-e (0.054) IGUs ... 13 Figure 10 – Predicted (by simulation) R-value (air-to-air) of curtain wall panel in relation to fraction (by
volume) of air present in the low-e (0.054) IGUs ... 13 Figure 11 - Predicated (by simulation) U-value (surface -to-surface) of curtain wall panel in relation to
fraction (by volume) of air present in the low-e (0.054) IGUs ... 14 Figure 12– Predicated (by simulation) U-value (air-to-air) of curtain wall panel in relation to fraction (by
volume) of air present in the low-e (0.054) IGUs ... 14 Figure 13 - Predicated (by simulation) total heat loss through curtain wall panel in relation to fraction (by volume) of air present in the low-e (0.054) IGUs; red marker shows test value ... 15 Figure 14 - Predicted (by simulation) R-value (surface-to-surface) of curtain wall panel in relation to
glazing emissivity on surface 2 of IGUs; 90% Ar filled IGU ... 15 Figure 15 - Predicted (by simulation) R-value (air-to-air) of curtain wall panel in relation to glazing
emissivity on surface 2 of IGUs; 90% Ar filled IGU ... 16 Figure 16 - - Predicted (by simulation) U-value (surface-to-surface) of curtain wall panel in relation to
glazing emissivity on surface 2 of IGUs; 90% Ar filled IGU ... 16 Figure 17 - - Predicted (by simulation) u-value (air-to-air) of curtain wall panel in relation to glazing
REPORT A1-002844.05 v
List of Tables
Table 1 – Test Results & Calculated U-value for curtain wall assembly for Ar (90%) filled IGU; model dimensions (M) used as basis for calculations ... 8 Table 2 – Test Results & Calculated U-value for curtain wall assembly with overfilling of Argon in IGU;
model dimensions (M) used as basis for calculations ... 9 Table 3 – Test Results and Calculated U-value for Curtain Wall Assembly Specimen size of 12 ft. x 12 ft.,
as reported in test for Ar (90%) filled IGU ... 10 Table 4 –Test Results and Calculated U-value for Curtain Wall Assembly of 12 ft. x 12 ft. Specimen size,
as reported in test with overfilling of Argon in IGU ... 11 Table A5 – Material Properties ... 19 Table A6 – Average temperature measurements for respective interior & exterior locations (1-47) of
curtain wall assembly ... 20 Table A7 – Assigned contributory area (mm2
& m2) for respective interior & exterior thermocouple locations (1-47) of curtain wall assembly ... 21 Table A8 –Surface temperatures and corresponding assigned areas for respective interior & exterior
REPORT A1-002844.05 vii
Summary
In 2012 the NRC-Construction initiated a project on the “High Performance Walls and Roofing Technologies Next Generation Technologies R&D – Building Envelopes”. Partnership and funding for the project was obtained from NRCan (Housing and Buildings /Sustainable Building and Communities CANMET / Group) under the Program of Energy Research and Development (PERD).
In commercial buildings, curtain wall systems often cover a significant part of the building envelope, and therefore their impact on the overall thermal performance of the building is important. In order to evaluate, compare and improve curtain wall designs, one requires insights to the different calculation and evaluation methods, and as well, knowledge of the state-of-the-art in thermal optimization of curtain walls.
The overall objective of this project was to improve the thermal efficiency of commercial building envelopes. This was achieved by using different approaches to improve the overall effective R-values of the curtain wall systems.
The project consisted of a number of Tasks in which curtain walls were evaluated, compared and suggestions made for improvement to the thermal performance of such systems, and include:
o Task 1: Literature review on Curtain Walls
o Task 2: Curtain Walls and National Energy Code for Buildings 2011 o Task 3: Thermal Optimization in Curtain Walls: Part I - Modelling o Task 4: Thermal Performance Testing of a Curtain Wall Panel
o Task 5: Benchmarking the Thermal Performance of a Curtain Wall Panel through Simulation o Task 6: Development of Guidelines for the Selection of Curtain Wall Components
This report focuses on Task 5: Benchmarking the Thermal Performance of a Curtain Wall Panel through Simulation. In this report the results from thermal simulation of a curtain wall test specimen using the simulation model hygIRC-C were compared and thus benchmarked against the results from experimental tests undertaken to determine the thermal transmittance of the specimen.
Full-scale testing, as reported in Task 4, determined the thermal transmittance of a thermally broken, double-glazed, commercially available, curtain wall assembly using a guarded hot box test facility and in accordance with standard industry methods for assessing thermal performance of curtain wall assemblies. The test results indicated that this double-glazed curtain wall assembly had an effective thermal
transmittance (U-value) of 1.7 W/(m2•K), thermal resistance of 0.42 (m2C)/W, and R-value 0.59 (m2 K)/W.
The results from simulation show that the effective thermal transmittance (U-value) of the curtain wall test specimen varied from 1.57 W/(m2•K) to 1.59 W/(m2•K), where for the lower value of thermal transmittance it was assumed that the IGU was overfilled with Argon gas (i.e. 100% Ar in IGU) whereas the higher value, the IGU was assumed partially filled (90%) with Argon gas. In either scenario, the difference in U-value obtained from simulation was always less than that obtained from testing, and ca. 6% less than that achieved in the test.
As a consequence of this work, the model configuration and simulation results derived for a thermally broken, double-glazed, Argon filled, low-e coated, curtain wall assembly is considered to have been adequately benchmarked to thermal transmittance measurements obtained from a standard guarded hot box test of nominally the same curtain wall assembly.
REPORT A1-002844.05 ix
Acknowledgements
NRC wishes to acknowledge the partnership and funding for the project as provided by NRCan (Housing and Buildings /Sustainable Building and Communities CANMET / Group) under the Program of Energy Research and Development (PERD). More specifically, NRC acknowledges the close collaboration with NRCan and the Sustainable Building and Communities group of CANMMET, and in particular, the support provided by Dr. Anil Parekh in completing the work delivered in this project.
REPORT A1-002844.05 xi
High Performance Roofing and Walls Technologies
–
Task 5: Benchmarking the Thermal Performance of a Curtain Wall
Panel through Simulation
Authored by:
Hamed H. Saber, Ph.D., Gnanamurugan Ganapathy, and Michael A. Lacasse, Ph.D., P.Eng.
A Report for the
Natural Resources Canada (NRCan)
Housing and Buildings
Sustainable Building and Communities CANMET / Group
ATT: Mr. Anil Parekh
National Research Council Canada Ottawa ON K1A 0R6 Canada
22 January, 2016
This report may not be reproduced in whole or in part without the written consent of both the client and the National Research Council of Canada
REPORT A1-002844.05 1
High Performance Roofing and Walls Technologies
Task 5: Benchmarking the Thermal Performance of a Curtain Wall Panel through Simulation
Report forming part of Task 5
Hamed H. Saber, Gnanamurugan Ganapathy and Michael A. Lacasse
1. Background
In this report, experimental work is described in which the thermal performance of a typical thermally broken North-American curtain wall (CW) assembly, as provided by a local manufacturer, was evaluated in accordance with prescribed industry test methods. The curtain wall assembly incorporated double-glazed Insulated Glass Units (IGUs) and used a typical spandrel panel section design. The intent of undertaking such work was to obtain the thermal response of the CW unit in sufficient detail to permit benchmarking the thermal performance to that subsequently obtained through simulation. The results from simulation would later inform on the expected gains in thermal performance of the assembly as might be derived from improvements in the U-value of, for example, the IGU (center of glazing), IGU spacer (edge of glazing), spandrel panel, CW frame or as might be achieved through variations in the ratio of the vision glass to opaque portion of the CW. This later work on simulation is described in a companion report for Task 5, entitled: “Thermal performance modelling of selected curtain wall assemblies”.
2. Objective
The objective of this task was to undertake the thermal performance assessment of a curtain wall assembly in accordance with established industry standards, and from which the thermal response of the assembly could be used to benchmark NRC’s simulation model, hygIRC-C1.
3. Approach and Description
3.1 Approach
The thermal performance of a locally obtained, commercially available, curtain wall assembly2 was determined on the basis of testing in accordance with NFRC 1003, specifically
1
hygIRC-C – Comsol Multiphysics package
2
BENCHMARKING THE THERMAL PERFORMANCE OF A CURTAIN WALL PANEL THROUGH SIMULATION
REPORT A1-002844.05 2
ASTM C1363- Standard Test Method for Thermal Performance of Building Materials and Envelope Assemblies by Means of a Hot Box Apparatus4 and ASTM C1199 - Standard Test Method for Measuring the Steady-State Thermal Transmittance of Fenestration Systems Using Hot Box Methods5. A description of the test facility, test method, and test specimen, including instrumentation and calibration, is provided in the subsequent sections.
3.2 Description of test specimen
3.2.1 – Detailed specimen configurationA detailed elevation drawing and horizontal sectional drawing is provided in Figure 1 and in Figure 26 is shown sectional drawings across the vision panel and the same for the opaque panel of the curtain wall test specimen; corresponding photos of the anodized aluminum curtain wall mullion are also provided. From these drawings the different curtain wall components can be identified and in which it is apparent that the opaque panels are insulated with mineral wool to the depth of the mullion and a polyimide compound was used as thermal break.
As can also be seen in these figures, the curtain wall assembly consisted of three equal size opaque panels, each conventionally insulated and superimposed over three vision panels of the same width. The overall test specimen area, �� , was 13.37 m2. The glazed area, � , was ca. 8.29 m2, the opaque panel area, �� , ca. 3.88 m2, and the frame area, � , ca. 1.37 m2. As such, the proportion of vision glass to the overall wall area (� ⁄ ) was ca. 62 %; the frame to wall area, (��� ⁄ ) ca. 10%, and; the vision to opaque �� panel ratio (� ⁄ ) was estimated to be ca. 2.14. The perimeter length of glazing was 20.97 m and that �� of the opaque panels, ca. 13.64 m.
The vision panel was comprised of a double-glazed insulated glass unit (IGU), a metal spacer, the IGU cavity being filled with argon gas, and surface 2 of the IGU had a low-e coating (Guardian AG5; SunGuard high performance low-e coated glass; emissivity = 0.057).
3.2.2 - Instrumentation
Two sets of 47 thermocouples were installed, respectively on the interior and exterior faces of the test specimen as shown in Figure 3 and Figure 4; the location of the sensors on the exterior of the test specimens are shown in Figure 3 and on the interior of the specimen in Figure 4. The thermocouples were capable of measuring temperature to ± 0.1 °C.; each of the thermocouple measurement results for either side of the test specimen is provided in the Appendix in Table A6 to Table A8.
3 NFRC 100-2014,2014, Procedure for Determining Fenestration Product U-Factors, National Fenestration Rating
Council, Inc., Greenbelt, MD, 2013
4
ASTM C1363 - 11 Standard Test Method for Thermal Performance of Building Materials and Envelope Assemblies by Means of a Hot Box Apparatus; ASTM International, ASTM International, West Conshohocken, PA, USA; 44 p.; DOI: 10.1520/C0033-03, www.astm.org.
5
ASTM Standard C1199-14, 2014, Standard Test Method for Measuring the Steady-State Thermal Transmittance of
Fenestration Systems Using Hot Box Methods, ASTM International, West Conshohocken, PA, 2011, DOI:
10.1520/C0033-03, www.astm.org. 6
MULLION - ANODIZED ALUMINUM MULLION - ANODIZED ALUMINUM
MEMBRANE GASKET
STRUCTURAL SILICONE SEALANT GASKET
GASKET PRESSURE PLATE CAP
Figure 1 – Elevation and sectional drawings of curtain wall test specimen
Figure 2 – Sectional drawing of curtain wall mullion (Section No. 002/02 of Fig 2); Photo showing end portion of horizontal section; Sectional drawing
of curtain wall mullion at opaque panel (Section No. 002/02 of Fig 1)
STEEL BACK PAN INSULAITON – ROXUL CURTAIN ROCK
STRUCTURAL SILICONE SEALANT GASKET
Figure 3 – Location of thermocouples (1-47) on “exterior” of curtain wall assembly
Figure 4 – Location of thermocouples (1-47) on “interior” of curtain wall assembly
REPORT A1-002844.05 5
3.3 Description of model configuration of test specimen
Model representations of the configuration of the curtain wall system are provided in Figure 3 and Figure 4 and adjacent to the elevations drawings of the exterior and interior surfaces of the test specimen; the model for the exterior surface of the panel is shown in Figure 3, and the interior surface in Figure 4. For both of these representations, only half of the overall specimen size was modelled as the specimen was symmetric about its vertical centerline.
The assumed values for thermal conductivity of the different curtain wall components is provided in Table A5, located in the Appendix.
4. Results derived from simulation
The results derived from simulation of the curtain wall assembly as tested in the guarded hot box test facility are given in Figure 5 to Figure 8 and in Table 1 to
Table 4.
4.1 Comparison of U- and R-values derived from simulation and from test
The results for the exterior of the curtain wall assembly are given in Figure 5 and Figure 6; in Figure 5 are shown the results from simulation for the exterior surface of the curtain wall and in which the surface temperature of the exterior surface can be traced through the variation in temperature with changes in colour, as provided in the adjoining scale. Insets to this figure provide details of the surface temperature at the juncture between curtain wall components. The values for surface temperature at thermocouple locations as obtained from the test results are given in Figure 6.
The corresponding information is provided for the interior of the curtain wall assembly in Figure 7 and Figure 8; in Figure 7 are the results of thermocouples (TC) measurements (1-47) for the “interior” of the curtain wall assembly and in Figure 8 the matching results from simulation showing the variation in temperature with changes in colour. As before, the information provided in the insets to this figure offer details of the surface temperature at the juncture between curtain wall components.
REPORT A1-002844.05 7
Table 4. In Table 1 and Table 2 are given U-values and R-values derived from both test and simulation results for a curtain wall assembly for which the IGU was assumed to be either partially filled (90%) or overfilled (100%) with Argon gas and where the model dimensions (M) were used as the basis for calculations of the thermal transmittance of the curtain wall assembly. Values for thermal performance are also provided in instances were assumptions were made as to the insulation product used at the periphery of the test specimen; in one instance this component was assumed to be a extruded polystyrene (XPS) product and for the other, an expanded polystyrene (EPS) product. Results for each of these products are provided in the same table, the results for XPS in the upper portion of the respective Tables and for EPS in the lower portion of the Table.
Where the test specimen dimensions formed the basis for calculations and where the test specimen was 12-ft. by 12-ft. ( ), the results for these U-values and R-values derived from both test and simulation results are provided in Table 3 and
Table 4; in Table 3 values for which the IGU was assumed to be either partially filled (90%) with Argon gas and in
REPORT A1-002844.05 9
Figure 5 – Results of thermocouples measurements (1-47) for “exterior” of curtain wall assembly and showing average steady
state temperatures are given locations
Figure 6 – Results of thermocouples measurements (1-47) for “interior” of curtain wall assembly and showing average steady
Figure 7 – Results of thermocouples measurements (1-47) for “exterior” of curtain wall assembly and showing average steady
state temperatures are given locations
Figure 8 – Results of thermocouples measurements (1-47) for “interior” of curtain wall assembly and showing average steady
BENCHMARKING THE THERMAL PERFORMANCE OF A CURTAIN WALL PANEL THROUGH SIMULATION
REPORT A1-002844.05 8
Table 1 – Test Results & Calculated U-value for curtain wall assemblyfor Ar (90%) filled IGU; model dimensions (M) used as basis for calculations
90% Ar and 10% Air, Frame Insulations: XPS
Parameter Test (T) Model (M) Difference M - T Deviation (%) Areas
Projected Area of the Sample (AP), m2 13.38 13.31 -0.07 -0.52%
Total Indoor Surface Area (AI), m2 15.81 16.21 0.40 2.56%
Total Outdoor Surface Area (AO), m2 14.09 14.30 0.21 1.52%
Test and Boundary Conditions
Temperature of warm side air (TI), °C 21.09 21.09 N/A N/A
Temperature of cold side air ( TII), °C -17.99 -17.99 N/A N/A
Interior Test Film (hI ), W/(m2·K) 8.37 8.37 N/A N/A
Exterior Test Film (hII), W/(m2·K) 19.25 19.25 N/A N/A
Measurements and Predictions
Average Area Weighted Room Side Surface Temp. (T1),°C 13.16 14.74 1.58 11.98% Average Weather Side Area Weighted Surface Temp. (T2), °C -14.54 -14.86 -0.32 2.20% Surface-to-surface Temperature Difference (DT), °C 27.70 29.60 1.90 6.85%
Net Specimen Heat Loss (Qs), W 888.56 861.99 -26.57 -2.99%
Derived Performance Parameters
Conductance of the Sample: Cs = Qs/AP*(T1-T2), W/(m2·K) 2.40 2.19 -0.21 -8.73% U-value of the sample: Us = 1/[(1/Cs)+(1/hI)+(1/hII)], W/(m2·K) 1.70 1.59 -0.11 -6.35% Thermal resistance = 1 / Cs, (m2Ÿ·K) / W 0.42 0.46 0.04 9.57%
R-value = 1/ Us, (m2·K) / W 0.59 0.63 0.04 6.78%
90% Ar and 10% Air, Frame Insulations: EPS
Measurements and Predictions
Average Area Weighted Room Side Surface Temp. (T1),°C 13.16 14.73 1.57 11.91% Average Weather Side Area Weighted Surface Temp. (T2), °C -14.54 -14.85 -0.31 2.16% Surface-to-surface Temperature Difference (DT), °C 27.70 29.58 1.88 6.79%
Net Specimen Heat Loss (Qs), W 888.56 863.35 -25.21 -2.84% Derived Performance Parameters
Conductance of the Sample: Cs = Qs/AP*(T1-T2), W/(m2·K) 2.40 2.19 -0.20 -8.54% U-value of the sample: Us = 1/[(1/Cs)+(1/hI)+(1/hII)], W/(m2·K) 1.70 1.59 -0.11 -6.21% Thermal resistance = 1 / Cs, (m2Ÿ·K) / W 0.42 0.46 0.04 9.34%
REPORT A1-002844.05 9
Table 2 – Test Results & Calculated U-value for curtain wall assembly
with overfilling of Argon in IGU; model dimensions (M) used as basis for calculations
100% Ar and 0% Air, Frame Insulations: XPS
Parameter Test (T) Model (M) Difference M - T Deviation (%) Areas
Projected Area of the Sample (AP), m2 13.38 13.31 -0.07 -0.52%
Total Indoor Surface Area (AI), m2 15.81 16.21 0.40 2.56%
Total Outdoor Surface Area (AO), m2 14.09 14.30 0.21 1.52%
Test and Boundary Conditions
Temperature of warm side air (TI), °C 21.09 21.09 N/A N/A
Temperature of cold side air ( TII), °C -17.99 -17.99 N/A N/A
Interior Test Film (hI ), W/(m2·K) 8.37 8.37 N/A N/A
Exterior Test Film (hII), W/(m2·K) 19.25 19.25 N/A N/A
Measurements and Predictions
Average Area Weighted Room Side Surface Temp. (T1),°C 13.16 14.82 1.66 12.58% Average Weather Side Area Weighted Surface Temp. (T2), °C -14.54 -14.90 -0.36 2.46% Surface-to-surface Temperature Difference (DT), °C 27.70 29.71 2.01 7.27%
Net Specimen Heat Loss (Qs), W 888.56 851.34 -37.22 -4.19%
Derived Performance Parameters
Conductance of the Sample: Cs = Qs/AP*(T1-T2), W/(m2·K) 2.40 2.15 -0.24 -10.22% U-value of the sample: Us = 1/[(1/Cs)+(1/hI)+(1/hII)], W/(m2·K) 1.70 1.57 -0.13 -7.46% Thermal resistance = 1 / Cs, (m2Ÿ·K) / W 0.42 0.46 0.05 11.38%
R-value = 1/ Us, (m2·K) / W 0.59 0.64 0.05 8.06%
100% Ar and 0% Air, Frame Insulations: EPS
Measurements and Predictions
Average Area Weighted Room Side Surface Temp. (T1),°C 13.16 14.81 1.65 12.50% Average Weather Side Area Weighted Surface Temp. (T2), °C -14.54 -14.89 -0.35 2.43% Surface-to-surface Temperature Difference (DT), °C 27.70 29.70 2.00 7.22%
Net Specimen Heat Loss (Qs), W 888.56 852.70 -35.86 -4.04%
Derived Performance Parameters
Conductance of the Sample: Cs = Qs/AP*(T1-T2), W/(m2·K) 2.40 2.16 -0.24 -10.03% U-value of the sample: Us = 1/[(1/Cs)+(1/hI)+(1/hII)], W/(m2·K) 1.70 1.57 -0.12 -7.32% Thermal resistance = 1 / Cs, (m2Ÿ·K) / W 0.42 0.46 0.05 11.15%
BENCHMARKING THE THERMAL PERFORMANCE OF A CURTAIN WALL PANEL THROUGH SIMULATION
REPORT A1-002844.05 10
Table 3 – Test Results and Calculated U-value for Curtain Wall Assembly Specimen size of 12 ft. x 12 ft., as reported in test for Ar (90%) filled IGU
90% Ar and 10% Air, Frame Insulations: XPS
Parameter Test (T) Model (M) Difference M - T Deviation (%) Areas
Projected Area of the Sample (AP), m2 13.38 13.38 0.00 -0.01%
Total Indoor Surface Area (AI), m2 16.29 16.29 0.49 3.08%
Total Outdoor Surface Area (AO), m2 14.38 14.38 0.28 2.02%
Test and Boundary Conditions
Temperature of warm side air (TI), °C 21.09 21.09 N/A N/A
Temperature of cold side air ( TII), °C -17.99 -17.99 N/A N/A
Interior Test Film (hI ), W/(m2·K) 8.37 8.37 N/A N/A
Exterior Test Film (hII), W/(m2·K) 19.25 19.25 N/A N/A
Measurements and Predictions
Average Area Weighted Room Side Surface Temp. (T1),°C 13.16 14.73 1.57 11.97% Average Weather Side Area Weighted Surface Temp. (T2), °C -14.54 -14.86 -0.32 2.19% Surface-to-surface Temperature Difference (DT), °C 27.70 29.59 1.89 6.83%
Net Specimen Heat Loss (Qs), W 888.56 866.69 -21.87 -2.46%
Derived Performance Parameters
Conductance of the Sample: Cs = Qs/AP*(T1-T2), W/(m2·K) 2.40 2.19 -0.21 -8.69%
U-value of the sample: Us = 1/[(1/Cs)+(1/hI)+(1/hII)], W/(m2·K) 1.70 1.59 -0.11 -6.32% Thermal resistance = 1 / Cs, (m2Ÿ·K) / W 0.42 0.46 0.04 9.51%
R-value = 1/ Us, (m2·K) / W 0.59 0.63 0.04 6.74%
90% Ar and 10% Air, Frame Insulations: EPS
Measurements and Predictions
Average Area Weighted Room Side Surface Temp. (T1),°C 13.16 14.72 1.56 11.89% Average Weather Side Area Weighted Surface Temp. (T2), °C -14.54 -14.85 -0.31 2.15% Surface-to-surface Temperature Difference (DT), °C 27.70 29.58 1.88 6.78%
Net Specimen Heat Loss (Qs), W 888.56 868.05 -20.51 -2.31% Derived Performance Parameters
Conductance of the Sample: Cs = Qs/AP*(T1-T2), W/(m2·K) 2.40 2.19 -0.20 -8.50% U-value of the sample: Us = 1/[(1/Cs)+(1/hI)+(1/hII)], W/(m2·K) 1.70 1.59 -0.10 -6.17% Thermal resistance = 1 / Cs, (m2Ÿ·K) / W 0.42 0.46 0.04 9.29%
REPORT A1-002844.05 11
Table 4 –Test Results and Calculated U-value for Curtain Wall Assembly of 12 ft. x 12 ft. Specimen size, as reported in test with overfilling of Argon in IGU
100% Ar and 0% Air, Frame Insulations: XPS
Parameter Test (T) Model (M) Difference M - T Deviation (%) Areas
Projected Area of the Sample (AP), m2 13.38 13.38 0.00 -0.01%
Total Indoor Surface Area (AI), m2 16.29 16.29 0.49 3.08%
Total Outdoor Surface Area (AO), m2 14.38 14.38 0.28 2.02%
Test and Boundary Conditions
Temperature of warm side air (TI), °C 21.09 21.09 N/A N/A
Temperature of cold side air ( TII), °C -17.99 -17.99 N/A N/A
Interior Test Film (hI ), W/(m2·K) 8.37 8.37 N/A N/A
Exterior Test Film (hII), W/(m2·K) 19.25 19.25 N/A N/A
Measurements and Predictions
Average Area Weighted Room Side Surface Temp. (T1),°C 13.16 14.81 1.65 12.56% Average Weather Side Area Weighted Surface Temp. (T2), °C -14.54 -14.90 -0.36 2.45% Surface-to-surface Temperature Difference (DT), °C 27.70 29.71 2.01 7.26%
Net Specimen Heat Loss (Qs), W 888.56 855.96 -32.60 -3.67%
Derived Performance Parameters
Conductance of the Sample: Cs = Qs/AP*(T1-T2), W/(m2·K) 2.40 2.15 -0.24 -10.17% U-value of the sample: Us = 1/[(1/Cs)+(1/hI)+(1/hII)], W/(m2·K) 1.70 1.57 -0.13 -7.43% Thermal resistance = 1 / Cs, (m2Ÿ·K) / W 0.42 0.46 0.05 11.33%
R-value = 1/ Us, (m2·K) / W 0.59 0.64 0.05 8.03%
100% Ar and 0% Air, Frame Insulations: EPS
Measurements and Predictions
Average Area Weighted Room Side Surface Temp. (T1),°C 13.16 14.80 1.64 12.49% Average Weather Side Area Weighted Surface Temp. (T2), °C -14.54 -14.89 -0.35 2.42% Surface-to-surface Temperature Difference (DT), °C 27.70 29.70 2.00 7.20%
Net Specimen Heat Loss (Qs), W 888.56 857.32 -31.24 -3.52%
Derived Performance Parameters
Conductance of the Sample: Cs = Qs/AP*(T1-T2), W/(m2·K) 2.40 2.16 -0.24 -9.99% U-value of the sample: Us = 1/[(1/Cs)+(1/hI)+(1/hII)], W/(m2·K) 1.70 1.58 -0.12 -7.29% Thermal resistance = 1 / Cs, (m2Ÿ·K) / W 0.42 0.46 0.05 11.09%
BENCHMARKING THE THERMAL PERFORMANCE OF A CURTAIN WALL PANEL THROUGH SIMULATION
REPORT A1-002844.05 12
4.2 Predicted U- and R-values derived from simulation
The predicted R- and U-values of a curtain wall panel, as derived from simulation and in relation to the volume fraction of Argon gas in the IGUs of the curtain wall panel are provided in Figure 9 to Figure 12; the R-values are provided in Figure 9 and Figure 10 whereas the U-values are given in Figure 11 and Figure 12. In Figure 9 are the surface-to-surface R-values in Figure 10, the air-to-air R-values as a function of the Argon gas concentration in the IGUs of the curtain wall panel. As might be expected, both the surface-to-surface and air-to-air R-values decrease in relation to the increase in the fraction of air to the IGUs of the curtain wall panel; the overall decrease over the entire range of Argon gas concentrations is greater for the surface-to-surface as compared to the air-to-air value; respectively 17.8 and 11.8 % reduction in R-value when the Argon gas fraction in the IGUs diminishes from 1 to 0.
In Figure 11 and Figure 12 are the corresponding surface-to-surface and air-to-air U-values as a function of the Argon gas concentration in the IGUs of the curtain wall panel. Given that the U-value represents the reciprocal of the R-value, both the surface-to-surface and air-to-air R-values increase in relation to the increase in the fraction of air to the IGUs of the curtain wall panel; the relative increase in U-value when the Argon gas fraction in the IGUs diminishes from 1 to 0 is the same proportion as that found for the decrease in R-value; respectively 17.8 and 11.8 % increase for the surface-to-surface as compared to the air-to-air U-value.
Rates of permeation of Argon gas from the IGU no doubt vary amongst manufacturers but on the basis of independent durability testing7 rates as low as 1% per year have been reported for certain products8. Hence one might expect a crease in Argon gas concentration of 25% over a 25 year period. As such, one could estimate what the performance of the IGUs would be after 25 years in terms or ether the R- or U-value on the basis of the information provided in Figure 9 to Figure 12.
4.3 Predicted to total heat loss through curtain wall panel derived from simulation
The predicated total heat loss through the curtain wall panel derived from simulation and in relation to fraction (by volume) of air present in the low-e (0.054) IGUs is given in Figure 13. The predicted overall heat loss when the Argon gas fraction in the IGUs diminishes from 1 to 0 is 11%. The red marker in Figure 13 shows the value obtained in the test if it was assumed that the IGUs were 90% filled with Argon gas. Similar estimates as those for thermal resistance could be made for heat loss as a function of time using the information provided in Figure 13 and assuming a 1% loss in Argon concentration per year.
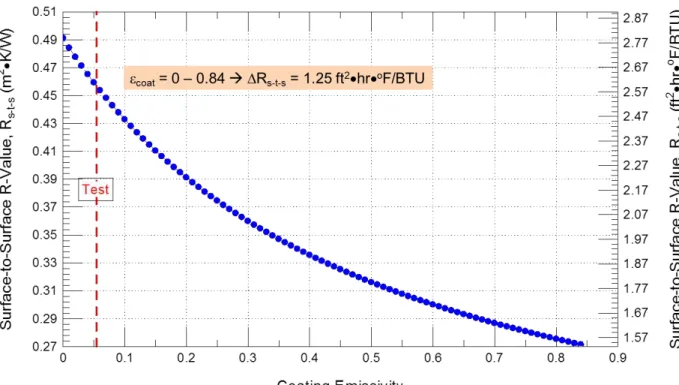
4.4 Predicted R-value in relation to emissivity of glazing as derived from simulation
The predicted R-value and U-values (surface-to-surface; air-to-air) of a curtain wall panel, derived from simulation, and in relation to the glazing emissivity on surface 2 of the IGUs are given Figure 14 to Figure 17. The R-values are given in Figure 14 (surface-to-surface) and Figure 15 (air-to-air), whereas the U-values are given in Figure 16 (surface-to-surface) and Figure 17 (air-to-air). The predictions are based on having IGUs in the curtain wall panel that are 90% Argon gas filled. The emissivity may increase over time as a result of a degradation of the IGU. As the IGU deteriorates, over time the Argon gas
concentration diminishes as air and moisture replace the inert gas. Any moisture present in the air may at times condense on the glass surfaces thereby increasing the emissivity of the coated surface. The net effect on the R-value or U-value can be estimated from the information provided in Figure 14.
7
European EN 1279-3 Long Term Test Method and Requirements for Gas Leakage Rate and For Gas Concentration
REPORT A1-002844.05 13
Figure 9 – Predicted (by simulation) R-value (surface-to-surface) of curtain wall panel in relation to fraction (by volume) of air present in the low-e (0.054) IGUs
Figure 10 – Predicted (by simulation) R-value (air-to-air) of curtain wall panel in relation to fraction (by volume) of air present in the low-e (0.054) IGUs
0.56 0.57 0.58 0.59 0.60 0.61 0.62 0.63 0.64 0 0.1 0.2 0.3 0.4 0.5 0.6 0.7 0.8 0.9 1.0 0 0.1 0.2 0.3 0.4 0.5 0.6 0.7 0.8 0.9 1.0 3.20 3.25 3.30 3.35 3.40 3.45 3.50 3.55 3.60 Coating Emissivity = 0.054 Air Fraction A ir -t o -A ir R -V al ue , Ra -t -a ( m 2 K /W ) A ir -t o-A ir R -V a lue, R a -t -a ( ft 2 hr o F /B T U ) Ar Fraction
BENCHMARKING THE THERMAL PERFORMANCE OF A CURTAIN WALL PANEL THROUGH SIMULATION
REPORT A1-002844.05 14
Figure 11 - Predicated (by simulation) U-value (surface -to-surface) of curtain wall panel in relation to fraction (by volume) of air present in the low-e (0.054) IGUs
Figure 12– Predicated (by simulation) U-value (air-to-air) of curtain wall panel in relation to fraction (by volume) of air present in the low-e (0.054) IGUs
1.57 1.59 1.61 1.63 1.65 1.67 1.69 1.71 1.73 1.75 1.77 0 0.1 0.2 0.3 0.4 0.5 0.6 0.7 0.8 0.9 1.0 0 0.1 0.2 0.3 0.4 0.5 0.6 0.7 0.8 0.9 1.0 0.28 0.29 0.30 0.31 Coating Emissivity = 0.054 Air Fraction A ir -to-A ir U -V a lue, Ua -t -a ( W /( m 2 K )) A ir -t o -A ir U -V al ue , Ua -t -a ( B T U /( ft 2 hr o F )) Ar Fraction
REPORT A1-002844.05 15
Figure 13 - Predicated (by simulation) total heat loss through curtain wall panel in relation to fraction (by volume) of air present in the low-e (0.054) IGUs; red marker shows test value
Figure 14 - Predicted (by simulation) R-value (surface-to-surface) of curtain wall panel in relation to glazing emissivity on surface 2 of IGUs; 90% Ar filled IGU
850 875 900 925 950 975 0 0.1 0.2 0.3 0.4 0.5 0.6 0.7 0.8 0.9 1.0 0 0.1 0.2 0.3 0.4 0.5 0.6 0.7 0.8 0.9 1.0 Test Prediction (within 3%) Coating Emissivity = 0.054 Air Fraction T otal H ea t Los s T h rou gh C W , Q ( W ) Ar Fraction
BENCHMARKING THE THERMAL PERFORMANCE OF A CURTAIN WALL PANEL THROUGH SIMULATION
REPORT A1-002844.05 16
Figure 15 - Predicted (by simulation) R-value (air-to-air) of curtain wall panel in relation to glazing emissivity on surface 2 of IGUs; 90% Ar filled IGU
Figure 16 - - Predicted (by simulation) U-value (surface-to-surface) of curtain wall panel in relation to glazing emissivity on surface 2 of IGUs; 90% Ar filled IGU
REPORT A1-002844.05 17
Figure 17 - - Predicted (by simulation) u-value (air-to-air) of curtain wall panel in relation to glazing emissivity on surface 2 of IGUs; 90% Ar filled IGU
5. Summary
The results from thermal simulation of a curtain wall test specimen using the simulation model hygIRC-C were compared and thus benchmarked against the results from experimental tests undertaken to determine the thermal transmittance of the specimen.
Full-scale testing determined the thermal transmittance of a thermally broken, double-glazed,
commercially available, curtain wall system using a guarded hot box test facility and in accordance with standard industry methods for assessing thermal performance of curtain wall assemblies.
The curtain wall assembly consisted of three equal size opaque panels, each conventionally insulated and superimposed over three vision panels of the width; the double glazed vison panels were argon filled and low-e coated (surface 2). The proportion of vision glass to the overall wall area was ca. 62 % and that of the frame to the wall area, ca. 10%. The vision to opaque panel ratio was estimated to be 2.14.
The test results indicate that this double-glazed, thermally-broken curtain wall system had an effective thermal transmittance (U-value) of 1.7 W/(m2•K), thermal resistance of 0.42 (m2C)/W, and
R-value 0.59 (m2 K)/W.
The results from simulation show that the effective thermal transmittance (U-value) of the curtain wall test specimen varied from 1.57 W/(m2•K) in instances where it was assumed that the IGU was overfilled with
BENCHMARKING THE THERMAL PERFORMANCE OF A CURTAIN WALL PANEL THROUGH SIMULATION
REPORT A1-002844.05 18
Argon gas (i.e. 100% Ar in IGU) to 1.59 W/(m2•K) when it was assumed that the IGU was partially filled (90%) with Argon gas. In either scenario, the difference in U-value obtained from simulation was always less than that obtained from testing, and ca. 6% less than that achieved in the test.
Assumptions regarding whether EPS was used as compared to XPS for insulation at the periphery of the test specimens did not result in any significant changes in the test results. Likewise, no significant changes were evident in U-values when the assumed size of the specimen in the model configuration was the same as that tested.
As a consequence of this work, the model configuration and simulation results derived for a thermally broken, double-glazed, Argon filled, low-e coated, curtain wall system has been adequately benchmarked to thermal transmittance measurements obtained from a standard guarded hot box test.
REPORT A1-002844.05 19
APPENDIX
Table A5 – Material Properties Material
NO. English Material name
Thermal conductivity (W/m.K)
1 Mullion Anodized Aluminum 237
2 Rigid Insulation block XPS or EPS XPS: 0.029 / EPS: 0.037
3 Dry gasket Silicone (confirmed) 0.35
4 Dry gasket Silicone 0.35
5 Cap Clear anodized aluminum? 237
6 Pressure plate Aluminum 237
7 Mullion Anodized Aluminum 237
8 Mullion Anodized Aluminum 237
9 Back pan Insulation Roxul (Curtain Rock) 0.0343
10 Back pan Steel 50
11 Dry gasket Silicone 0.35
12 Aluminum 237
13 Dry gasket Silicone 0.35
14 Dry gasket Anodized Aluminum 237
15 Mullion Anodized Aluminum 237
16 Mullion Anodized Aluminum 237
17 Dry gasket Silicone 0.35
18 Mullion Anodized Aluminum 237
19 Fill gas Argon (90% Ar and 10% Air) f(T)
20 Silicon sealant Silicon 0.35
21 Thermal brick Polyamide (confirmed) 0.3
22 Metallic spacer Stainless steel (manufacturer
data) 15
23 Desiccant bead Silica gel loose fill? 0.03
24 IG secondary seal Silicon (confirmed) 0.35
25 Setting Block Silicon (confirmed) 0.35
26 Descant Container 15
BENCHMARKING THE THERMAL PERFORMANCE OF A CURTAIN WALL PANEL THROUGH SIMULATION
REPORT A1-002844.05 20
Table A6 – Average temperature measurements for respective interior & exterior locations (1-47) of curtain wall assembly
Channel # Channel # 1 10.2 °C 50.37 °F 1 -14.3 °C 6.30 °F 2 11.2 °C 52.14 °F 2 -14.7 °C 5.54 °F 3 10.9 °C 51.64 °F 3 -14.1 °C 6.67 °F 4 6.4 °C 43.50 °F 4 -15.3 °C 4.48 °F 5 6.5 °C 43.67 °F 5 -15.6 °C 4.00 °F 6 5.9 °C 42.60 °F 6 -14.1 °C 6.65 °F 7 11.5 °C 52.67 °F 7 -13.6 °C 7.51 °F 8 10.2 °C 50.30 °F 8 -13.9 °C 7.04 °F 9 11.1 °C 51.96 °F 9 -13.8 °C 7.08 °F 10 10.2 °C 50.43 °F 10 -14.1 °C 6.55 °F 11 13.7 °C 56.62 °F 11 -14.1 °C 6.67 °F 12 10.8 °C 51.48 °F 12 -13.5 °C 7.61 °F 13 10.3 °C 50.59 °F 13 -14.5 °C 5.90 °F 14 9.9 °C 49.88 °F 14 -12.7 °C 9.10 °F 15 13.5 °C 56.38 °F 15 -14.0 °C 6.86 °F 16 10.2 °C 50.29 °F 16 -14.1 °C 6.62 °F 17 10.7 °C 51.21 °F 17 -13.6 °C 7.48 °F 18 9.7 °C 49.40 °F 18 -13.9 °C 7.02 °F 19 11.6 °C 52.91 °F 19 -13.2 °C 8.17 °F 20 12.3 °C 54.15 °F 20 -8.7 °C 16.36 °F 21 12.5 °C 54.45 °F 21 -9.9 °C 14.26 °F 22 12.6 °C 54.66 °F 22 -10.2 °C 13.69 °F 23 13.3 °C 55.94 °F 23 -13.8 °C 7.12 °F 24 13.1 °C 55.63 °F 24 -13.6 °C 7.52 °F 25 13.9 °C 57.01 °F 25 -14.4 °C 6.06 °F 26 18.0 °C 64.38 °F 26 -14.2 °C 6.53 °F 27 17.2 °C 63.04 °F 27 -14.6 °C 5.77 °F 28 17.4 °C 63.36 °F 28 -15.4 °C 4.26 °F 29 13.2 °C 55.70 °F 29 -15.8 °C 3.54 °F 30 16.7 °C 62.12 °F 30 -15.6 °C 4.00 °F 31 20.6 °C 69.02 °F 31 -16.6 °C 2.04 °F 32 16.2 °C 61.21 °F 32 -13.6 °C 7.45 °F 33 12.3 °C 54.10 °F 33 -13.8 °C 7.09 °F 34 15.6 °C 60.11 °F 34 -15.8 °C 3.56 °F 35 19.8 °C 67.60 °F 35 -16.5 °C 2.30 °F 36 12.4 °C 54.28 °F 36 -17.7 °C 0.12 °F 37 12.4 °C 54.28 °F 37 -14.4 °C 6.07 °F 38 16.0 °C 60.73 °F 38 -14.8 °C 5.35 °F 39 20.0 °C 67.96 °F 39 -16.7 °C 1.92 °F 40 11.0 °C 51.87 °F 40 -14.7 °C 5.52 °F 41 6.0 °C 42.73 °F 41 -14.4 °C 6.04 °F 42 18.1 °C 64.67 °F 42 -13.5 °C 7.78 °F 43 18.4 °C 65.18 °F 43 -13.0 °C 8.56 °F 44 17.3 °C 63.23 °F 44 -17.4 °C 0.75 °F 45 14.0 °C 57.24 °F 45 -13.8 °C 7.25 °F 46 15.7 °C 60.29 °F 46 -13.5 °C 7.73 °F 47 13.7 °C 56.69 °F 47 -14.9 °C 5.26 °F
Average Temperature Interior Average Temperature Exterior
REPORT A1-002844.05 21
Table A7 – Assigned contributory area (mm2 & m2) for respective interior & exterior thermocouple locations (1-47) of curtain wall assembly
Channel # Area mm² Area m² Channel # Area mm² Area m²
1 205098 0.21 1 106242 0.11 2 205098 0.21 2 106242 0.11 3 205098 0.21 3 106242 0.11 4 67977 0.07 4 68231 0.07 5 67977 0.07 5 68231 0.07 6 67977 0.07 6 68231 0.07 7 451878 0.45 7 189546 0.19 8 143605 0.14 8 144177 0.14 9 2213386 2.21 9 2231277 2.23 10 143605 0.14 10 144177 0.14 11 717240 0.72 11 185289 0.19 12 143605 0.14 12 144177 0.14 13 2213386 2.21 13 2231277 2.23 14 143605 0.14 14 144177 0.14 15 717240 0.72 15 185289 0.19 16 143605 0.14 16 144177 0.14 17 2213386 2.21 17 2231277 2.23 18 143605 0.14 18 144177 0.14 19 451878 0.45 19 189546 0.19 20 67977 0.07 20 68231 0.07 21 67977 0.07 21 68231 0.07 22 67977 0.07 22 68231 0.07 23 226167 0.23 23 154908 0.15 24 226167 0.23 24 154908 0.15 25 226167 0.23 25 154908 0.15 26 68040 0.07 26 68231 0.07 27 68040 0.07 27 68231 0.07 28 68040 0.07 28 68231 0.07 29 74496 0.07 29 107635 0.11 30 65818 0.07 30 65564 0.07 31 980784 0.98 31 979659 0.98 32 65818 0.07 32 65564 0.07 33 74496 0.07 33 157035 0.16 34 65818 0.07 34 65564 0.07 35 980784 0.98 35 979659 0.98 36 65818 0.07 36 65564 0.07 37 74496 0.07 37 157035 0.16 38 65818 0.07 38 65564 0.07 39 980784 0.98 39 979659 0.98 40 65818 0.07 40 65564 0.07 41 74496 0.07 41 107635 0.11 42 68040 0.07 42 68231 0.07 43 68040 0.07 43 68231 0.07 44 68040 0.07 44 68231 0.07 45 73557 0.07 45 106242 0.11 46 73557 0.07 46 106242 0.11 47 73557 0.07 47 106242 0.11 Sum 15805835 15.81 14091205 14.09 Interior Exterior
BENCHMARKING THE THERMAL PERFORMANCE OF A CURTAIN WALL PANEL THROUGH SIMULATION
REPORT A1-002844.05 22
Table A8 –Surface temperatures and corresponding assigned areas for respective interior & exterior thermocouple locations (1-47) of curtain wall assembly
Thermocouple Channel #
Room Side Weather Side Room Side Weather Side
1 10.21 -14.28 0.21 0.11 2 11.19 -14.70 0.21 0.11 3 10.91 -14.07 0.21 0.11 4 6.39 -15.29 0.07 0.07 5 6.48 -15.56 0.07 0.07 6 5.89 -14.08 0.07 0.07 7 11.49 -13.60 0.45 0.19 8 10.17 -13.86 0.14 0.14 9 11.09 -13.85 2.21 2.23 10 10.24 -14.14 0.14 0.14 11 13.68 -14.07 0.72 0.19 12 10.82 -13.55 0.14 0.14 13 10.33 -14.50 2.21 2.23 14 9.93 -12.72 0.14 0.14 15 13.55 -13.96 0.72 0.19 16 10.16 -14.10 0.14 0.14 17 10.67 -13.62 2.21 2.23 18 9.66 -13.88 0.14 0.14 19 11.61 -13.24 0.45 0.19 20 12.31 -8.69 0.07 0.07 21 12.47 -9.85 0.07 0.07 22 12.59 -10.17 0.07 0.07 23 13.30 -13.82 0.23 0.15 24 13.13 -13.60 0.23 0.15 25 13.89 -14.41 0.23 0.15 26 17.99 -14.15 0.07 0.07 27 17.24 -14.57 0.07 0.07 28 17.42 -15.41 0.07 0.07 29 13.17 -15.81 0.07 0.11 30 16.73 -15.55 0.07 0.07 31 20.57 -16.64 0.98 0.98 32 16.23 -13.64 0.07 0.07 33 12.28 -13.84 0.07 0.16 34 15.62 -15.80 0.07 0.07 35 19.78 -16.50 0.98 0.98 36 12.38 -17.71 0.07 0.07 37 12.38 -14.41 0.07 0.16 38 15.96 -14.81 0.07 0.07 39 19.98 -16.71 0.98 0.98 40 11.04 -14.71 0.07 0.07 41 5.96 -14.42 0.07 0.11 42 18.15 -13.46 0.07 0.07 43 18.43 -13.02 0.07 0.07 44 17.35 -17.36 0.07 0.07 45 14.02 -13.75 0.07 0.11 46 15.72 -13.49 0.07 0.11 47 13.72 -14.86 0.07 0.11 Total Area: 15.81 14.09 Average Room Side Area Weighted Surface Temperature (°C) : 13.16 Average Weather Side Area Weighted Surface Temperature (°C) : -14.54
Surface Temperatures (°C)
Individual Average Assigned Areas per Thermocouple Location (m²) SURFACE TEMPERATURE MEASUREMENTS AND AREA INFORMATION