Publisher’s version / Version de l'éditeur:
Vous avez des questions? Nous pouvons vous aider. Pour communiquer directement avec un auteur, consultez la
première page de la revue dans laquelle son article a été publié afin de trouver ses coordonnées. Si vous n’arrivez pas à les repérer, communiquez avec nous à [email protected].
Questions? Contact the NRC Publications Archive team at
[email protected]. If you wish to email the authors directly, please see the first page of the publication for their contact information.
https://publications-cnrc.canada.ca/fra/droits
L’accès à ce site Web et l’utilisation de son contenu sont assujettis aux conditions présentées dans le site LISEZ CES CONDITIONS ATTENTIVEMENT AVANT D’UTILISER CE SITE WEB.
Journal of the Atmospheric Sciences, 73, 10, pp. 3885-3910, 2016-10-01
READ THESE TERMS AND CONDITIONS CAREFULLY BEFORE USING THIS WEBSITE.
https://nrc-publications.canada.ca/eng/copyright
NRC Publications Archive Record / Notice des Archives des publications du CNRC :
https://nrc-publications.canada.ca/eng/view/object/?id=07400c47-a546-41d3-8b50-bf27571e9ecb
https://publications-cnrc.canada.ca/fra/voir/objet/?id=07400c47-a546-41d3-8b50-bf27571e9ecb
NRC Publications Archive
Archives des publications du CNRC
This publication could be one of several versions: author’s original, accepted manuscript or the publisher’s version. / La version de cette publication peut être l’une des suivantes : la version prépublication de l’auteur, la version acceptée du manuscrit ou la version de l’éditeur.
For the publisher’s version, please access the DOI link below./ Pour consulter la version de l’éditeur, utilisez le lien DOI ci-dessous.
https://doi.org/10.1175/JAS-D-15-0365.1
Access and use of this website and the material on it are subject to the Terms and Conditions set forth at
Quasi-spherical ice in convective clouds
Järvinen, Emma; Schnaiter, Martin; Mioche, Guillaume; Jourdan, Olivier;
Shcherbakov, Valery N.; Costa, Anja; Afchine, Armin; Krämer, Martina;
Heidelberg, Fabian; Jurkat, Tina; Voigt, Christiane; Schlager, Hans;
Nichman, Leonid; Gallagher, Martin; Hirst, Edwin; Schmitt, Carl; Bansemer,
Aaron; Heymsfield, Andy; Lawson, Paul; Tricoli, Ugo; Pfeilsticker, Klaus;
Vochezer, Paul; Möhler, Ottmar; Leisner, Thomas
Quasi-Spherical Ice in Convective Clouds
EMMAJÄRVINEN,aMARTINSCHNAITER,aGUILLAUMEMIOCHE,bOLIVIERJOURDAN,b VALERYN. SHCHERBAKOV,bANJACOSTA,cARMINAFCHINE,cMARTINAKRÄMER,c
FABIANHEIDELBERG,dTINAJURKAT,dCHRISTIANEVOIGT,dHANSSCHLAGER,dLEONIDNICHMAN,e MARTINGALLAGHER,eEDWINHIRST,fCARLSCHMITT,gAARONBANSEMER,gANDYHEYMSFIELD,g
PAULLAWSON,hUGOTRICOLI,iKLAUSPFEILSTICKER,iPAULVOCHEZER,aOTTMARMÖHLER,a
ANDTHOMASLEISNERa
aInstitute of Meteorology and Climate Research, Karlsruhe Institute of Technology, Karlsruhe, Germany bLaboratoire de Métérologie et Physique, Clermont-Ferrand, France
c
Stratosphere Section (IEK-7), Institut f€ur Energie und Klimaforschung, Forschungszentrum J€ulich, J€ulich, Germany
d
Deutsches Zentrum f€ur Luft- und Raumfahrt (DLR), Oberpfaffenhofen, Germany
eSchool of Earth, Atmospheric and Environmental Sciences, University of Manchester, Manchester, United Kingdom fCentre for Atmospheric and Instrumentation Research, University of Hertfordshire, Hatfield, United Kingdom
gNational Center for Atmospheric Research, Boulder, Colorado hSPEC Inc., Boulder, Colorado
iUniversity of Heidelberg, Heidelberg, Germany
(Manuscript received 2 December 2015, in final form 14 April 2016) ABSTRACT
Homogeneous freezing of supercooled droplets occurs in convective systems in low and midlatitudes. This droplet-freezing process leads to the formation of a large amount of small ice particles, so-called frozen droplets, that are transported to the upper parts of anvil outflows, where they can influence the cloud radiative properties. However, the detailed microphysics and, thus, the scattering properties of these small ice particles are highly uncertain. Here, the link between the microphysical and optical properties of frozen droplets is investigated in cloud chamber experiments, where the frozen droplets were formed, grown, and sublimated under controlled conditions. It was found that frozen droplets developed a high degree of small-scale com-plexity after their initial formation and subsequent growth. During sublimation, the small-scale comcom-plexity disappeared, releasing a smooth and near-spherical ice particle. Angular light scattering and depolarization measurements confirmed that these sublimating frozen droplets scattered light similar to spherical particles: that is, they had angular light-scattering properties similar to water droplets. The knowledge gained from this laboratory study was applied to two case studies of aircraft measurements in midlatitude and tropical con-vective systems. The in situ aircraft measurements confirmed that the microphysics of frozen droplets is dependent on the humidity conditions they are exposed to (growth or sublimation). The existence of optically spherical frozen droplets can be important for the radiative properties of detraining convective outflows.
1. Introduction
Convective systems are an important source of ice particles in the upper troposphere (e.g.,Jensen et al. 1996; Gayet et al. 2012a;Frey et al. 2011) and the lowermost
stratosphere (de Reus et al. 2009). Ice particles found in the anvil outflows are usually formed in the lower and warmer part of the convective cell, and therefore their microphysical and optical properties differ from in situ formed ice particles (e.g.,McFarquhar and Heymsfield 1996;Lawson et al. 2003;Connolly et al. 2005;Lawson et al. 2010;Frey et al. 2011). In midlatitude convective systems, supercooled liquid water droplets have been ob-served to survive down to a temperature around 2378C (Rosenfeld and Woodley 2000), where homogeneous freezing of the supercooled droplets occurs. In vigorous convective systems, homogeneous freezing happens in a narrow time interval, producing a large amount of small
Supplemental information related to this paper is available at the Journals Online website:http://dx.doi.org/10.1175/JAS-D-15-0365.s1.
Corresponding author address: Emma Järvinen, Institute of Meteorology and Climate Research, Karlsruhe Institute of Tech-nology, P.O. Box 3640, 76021 Karlsruhe, Germany.
E-mail: [email protected] DOI: 10.1175/JAS-D-15-0365.1
ice crystals (Heymsfield and Sabin 1989; Phillips et al. 2007;Lawson et al. 2010). The ice particle concentrations at the top of convective systems can reach several tens per cubic centimeter, with the effective diameter of the ice particles staying below 50 mm (Heymsfield et al. 2009; Lawson et al. 2010;Gayet et al. 2012a;Stith et al. 2014). The high number of small ice particles at the top of convective outflows indicates that small (,50 mm) ice crystals might be important for the shortwave radiative properties of these cloud types. Yet the exact micro-physics and, therefore, the radiative forcing of small ice particles are not well understood. Several tropical (e.g., Stith et al. 2002;Lawson et al. 2003;Stith et al. 2004; Connolly et al. 2005;Heymsfield et al. 2005;May et al. 2008;Lawson et al. 2010;Frey et al. 2011) and a few midlatitude aircraft campaigns (e.g.,Lawson et al. 2003; Gayet et al. 2012a; Stith et al. 2014) have been con-ducted to investigate the microphysical properties of ice crystals in anvil outflows.Gayet et al. (2012a)reported aggregated frozen droplets in a convective storm over Europe. Similarly, Stith et al. (2014)found that aggre-gated frozen droplets and single frozen droplets with median sizes of 20–25 mm are regular features in many midlatitude convective systems over the midwestern United States. In tropical convective systems, vapor-grown plates and aggregates of plates are typically de-tected (e.g.,Connolly et al. 2005;Um and McFarquhar 2009;Frey et al. 2011). However, in fast updrafts ho-mogeneous freezing can be observed (Heymsfield et al. 2005,2009;Lawson et al. 2010).
Frozen droplets are quasi-spherical or quasi-spheroidal small particles that can be identified from measure-ments with cloud particle imagers (CPIs), which were used in the studies ofLawson et al. (2003),Gayet et al. (2012a), andStith et al. (2014). The spatial resolutions of CPIs typically range from about 2 to 5 mm, depending on the probe model and aircraft speed: that is, too coarse to resolve the fine structure of small ice particles. What is detected as apparently a spherical ice particle may actually be a complex polycrystal, a droxtal, or a se-verely roughened ice particle (Z. Ulanowski et al. 2004, unpublished manuscript). However, particularly the fine structure or the particle complexity has an important role in determining the single-scattering properties of ice particles, in particular the forward-to-backward scat-tering ratio or asymmetry factor g, both of which are known to be decisive in radiative energy budget calcula-tions (e.g.,Li et al. 2004;Ulanowski et al. 2006;Yang et al. 2008;Baran 2012). This, consequently, influences the ra-diative forcing of the convective clouds.Yi et al. (2013) calculated a significant negative global average difference in shortwave radiative properties of 21.46 W m2between smooth and roughened ice crystals. Hence, accurate
information on the detailed structure of frozen drop-lets is crucial to understand the radiative forcing of convective outflows, where homogeneous droplet freezing is observed.
Recently, a new instrument type has been developed to quantify the complexity of atmospheric ice crystals based on the analysis of their 2D diffraction patterns (Ulanowski et al. 2010; Schnaiter et al. 2016). In this context, crystal complexity comprises all types of dis-tortions in a single crystal (e.g., surface roughness, hol-lowness, and air bubbles) that result in a similar spatial distribution of forward-scattered light. This structural complexity of a single ice crystal is referred to as small-scale complexity (Schnaiter et al. 2016). For example, a smooth ice sphere has a diffraction pattern similar to a water droplet, where concentric intensity maxima (rings) are observed in forward scattering. Small-scale complexity destroys this scattering pattern and induces randomization in the measured intensity distribution, and the degree of this randomization can be linked with the degree of the particle small-scale complexity (Schnaiter et al. 2016). Moreover, the 2D diffraction patterns can be used to discriminate aspherical ice particles from spheri-cal particles (Vochezer et al. 2016). Normally, the latter method is deployed to determine ice fractions in mixed-phase clouds, but in this study we used it to detect opti-cally spherical ice particles in simulated and in real ice clouds of convective origin.
In this paper, two definitions are used to describe the microphysical nature of the frozen droplets: ‘‘quasi spherical’’ and ‘‘optically spherical.’’ Quasi spherical is used as a general term for all frozen droplets that have retained their apparent spherical shape in the freezing process and are identified as spherical particles in the CPI images. Similarly,Nousiainen and McFarquhar (2004) defined a quasi-spherical ice particle as a particle whose projected area resembles a circle. The term quasi spherical is frequently used to describe small ice particles (e.g., Gayet et al. 1996;Korolev and Isaac 2003;McFarquhar et al. 2007), yet the actual shape of these particles can be nonspherical if surface roughness or other smaller-scale structural complexity is present. For calculating the scattering properties, the term quasi spherical can be misleading, as it can be related to calculating the ice particle radiative properties using the Lorenz–Mie theory (Yang et al. 2003). To better illustrate the optical effect of these ice particles, we introduce the term optically spherical to describe frozen droplets that do not show crystal complexity and behave optically like a sphere according to our measurement methods.
The droplet freezing process was simulated in the cloud simulation chamber Aerosol Interactions and Dynamics in the Atmosphere (AIDA;Möhler et al. 2003), where 3886 J O U R N A L O F T H E A T M O S P H E R I C S C I E N C E S VOLUME73
frozen droplets were grown and sublimated under controlled conditions. During the growth and sublima-tion cycles, the size, shape, complexity and angular light-scattering properties of the frozen droplets were investigated to understand the link between environ-mental, microphysical, and optical properties. The paper is organized as follows. The new instrument type and the analysis methods for determining particle small-scale complexity and sphericity are briefly discussed insection 2a. The cloud chamber and the experiment method are described insection 2b, and the results from the chamber experiments are discussed insection 3. The knowledge gained from the laboratory study was applied to two case studies of aircraft measurements in mid- and low-latitude convective systems. The results from these two case studies are presented and discussed insections 4and 5, and the atmospheric relevance of quasi-spherical ice particles is the topic ofsection 6.
2. Methods
a. Detecting optically spherical particles
A set of instruments measuring different optical para-meters was used to determine the sphericity of laboratory-produced ice particles. The airborne Small Ice Detector, mark 3, [SID-3; see details in Ulanowski et al. (2012), Ulanowski et al. (2014), andVochezer et al. (2016)] and its laboratory version, the Particle Phase Discriminator, mark 2, Karlsruhe edition [PPD-2K; see details inKaye et al. (2008)andVochezer et al. (2016)] record high-resolution scattering patterns of particles that have passed a 532-nm laser beam that can be used to study the particle mor-phology in size ranges of 3–50 (SID-3) and 7–70 mm (PPD-2K). In addition, the crystal small-scale complexity can be derived from these measurements (Schnaiter et al. 2016). A detailed description of the technical details and the data analysis methods of these two instruments can be found inVochezer et al. (2016) andSchnaiter et al. (2016). Here we only briefly describe how the scattering pat-terns are used to quantify particle sphericity and aspherical fraction.
The SID-3 and PPD-2K record forward-scattered light from a single cloud particle in an annulus region between 78 and 268 using an intensified charged coupled device camera (ICCD). This pattern can be averaged over the polar angle to get a median forward-scattering azimuthal intensity profile for a single particle. In the case of a spherical scatterer, a scattering pattern with concentric rings can be described with the Lorenz–Mie theory. Taking the average over the polar angles of a spherical particle, therefore, leads to a flat azimuthal intensity profile, whereas in the case of an aspherical
scatterer, the azimuthal intensity profile is nonuniform. Hence, the variance of the intensity along the azimuthal angle yaz can be used to quantify the degree of particle sphericity. The fraction of aspherical particles is de-termined using a calibrated threshold value of ythr
az of 1 3 1025, with particles having a yaz, ythr
az classified as spherical. The typical yaz value for water droplets is between 1 3 1026 and 1 3 1025, depending on the droplet size, and the typical yazfor a columnar ice par-ticle in chamber experiments is around 1 3 1021. Irreg-ular ice particles have yaz values between those of droplets and hexagonal ice particles.
In addition to SID-3 and PPD-2K, two airborne cloud particle spectrometers, the Novel Ice Experiment–Cloud and Aerosol Particle Spectrometer (NIXE-CAPS) and the Cloud Aerosol Spectrometer–Depolarization Option (CAS-DPOL) were deployed in the chamber experi-ments. NIXE-CAPS (Meyer 2012; Luebke et al. 2015) is a combination of a cloud imaging probe and a cloud aerosol spectrometer. The design of the NIXE-CAPS instrument is similar to the cloud, aerosol, and precipitation spec-trometer (CAPS;Baumgardner et al. 2001); however, one modification is that the NIXE-CAPS has a detector for the cross-polarized component of the backward-scattered light (see Meyer 2012;Baumgardner et al. 2014). This instrument supports the measurement of single-particle polarization signals that can be used to determine if a cloud particle is aspherical, as aspherical particles do significantly alter the polarization state of the incident light. Each particle’s polarization signal is compared to a size-dependent ‘‘asphericity threshold’’ that was developed based on measurements of spherical liquid water droplets (Meyer 2012). The smallest particles that can be detected with the NIXE-CAPS instrument have diameters of about 0.6 mm; however, in this study the aspherical fractions was determined only for par-ticles larger than 8 mm to be comparable to the PPD-2K measurements.
Similar to the NIXE-CAPS, the aspherical fraction from the CAS-DPOL (Voigt et al. 2016) is determined by the ratio of perpendicularly polarized light to the forward-scattering light intensity. Again, a size-dependent thresh-old was determined from the measurements of spherical liquid particles, and all particles with a polarization ratio larger than the 1s range of threshold values were cate-gorized as aspherical. The method gives a size-dependent aspherical fraction similar to the PPD-2K as well as the bulk aspherical fraction. The bulk aspherical fraction was derived from the number of aspherical particles to the number of total particles measured between 8 and 50 mm within a 10-s time interval.
Besides particle probes, two polar nephelometers were used to measure the angular light scattering of the frozen
droplets. The airborne polar nephelometer (PN; Gayet et al. 1997;Crépel et al. 1997) measures the polar scat-tering function of a particle ensemble in the angular range between 3.58 and 1698. In this paper, the asymmetry pa-rameter g is assessed based on the angular scattering measurements documented between 158 and 1558. We followed the methodology proposed by Gerber et al. (2000), assuming that the fraction of energy scattered into angles smaller than 158 is constant and equal to 0.56, re-gardless of the cloud composition. The absolute error on the asymmetry parameter is expected to range approxi-mately between 0.04 (Gerber et al. 2000;Garrett et al. 2001;Gayet et al. 2002) and 0.05 (for clouds dominated by large ice crystals).
The airborne Particle Habit Imaging and Polar Scat-tering probe on the German High-Altitude and Long-Range Research Aircraft (PHIPS-HALO;Abdelmonem et al. 2016) was used together with PN to measure the angular light-scattering function of single particles in an angular range of 188 to 1708. The basic measurement concept of PHIPS-HALO is the simultaneous imaging of single ice crystals and the measurement of their angular scattering function. The imaging part of the instrument consists of two identical camera–telescope assemblies and a pulsed incoherent illumination laser. The use of incoherent laser light enables the pro-duction of diffraction- and chromatic-aberration-free bright-field microscopic images with an optical reso-lution of about 2.5 mm. The polar nephelometer part of PHIPS-HALO measures the light scattered from par-ticles as they pass through the horizontally aligned scat-tering laser beam with a wavelength of 532 nm. The light scattered from a particle is collected with 20 parabolic mirrors at equidistant angular separations of 88 (from 188 to 1708). Their diameter is 10 mm so that the angular range that each mirror covers is 63.58. The light gath-ered by the mirrors is focused into optical fibers and transported to a multianode photomultiplier array for analysis.
The ensemble cloud-scattering properties were probed with an in situ scattering and depolarization instrument Streulichtintensitätsmessungen zum Optischen Nachweis von Eispartikeln (SIMONE)1(Schnaiter et al. 2012; Järvinen et al. 2016). SIMONE measures the intensity of the scattered light from the center of the chamber at near-forward- (28) and at near-backward-scattering angles (1788). The backward scattered light is decomposed into its polarization components to determine the linear
depolarization ratio dl. This dl can be considered as a direct and accurate measure of the particle sphericity; spherical particles do not change the linear polarization state of the incident light in the scattering process, whereas aspherical particles induce a nonzero de-polarization ratio, with the magnitude depending on the shape, size, and refractive index of the particle.
b. Simulating convective cloud systems in AIDA The expansion cooling of an air parcel in a convective system was simulated in the cloud chamber AIDA (Möhler et al. 2003) located at the Karlsruhe Institute of Technology. The AIDA chamber consists of a large 84-m3aluminum vessel that is enclosed inside thermal housing. The chamber can be cooled down to 183 K, which makes the AIDA chamber suitable for simulating ice microphysics in pure ice clouds (Schnaiter et al. 2012, 2016), in persistent mixed-phase clouds (Vochezer et al. 2016), and in convective systems (this study). To form liquid and ice clouds, supersaturated conditions inside the chamber are reached by expansion cooling; the cham-ber is evacuated from atmospheric pressure down to 600–800 hPa, depending on the pumping speed and the required amount of cooling. The typical cooling rates that can be achieved at the beginning of the expansion range from 21 K min21to a maximum of 22.5 K min21, which roughly corresponds to updraft speeds from 2 to 7 m s21, values typical for midlatitude convection over the United States (Giangrande et al. 2013).
To study the ice particle microphysics in convective systems, a specific experimental procedure was de-veloped containing three phases: 1) pure liquid cloud with supercooled droplets, 2) freezing of the droplets and their initial growth at supersaturated conditions, and, finally, 3) the sublimation of the frozen droplets at subsaturated conditions. The experiments were started with a clean chamber precooled to 243 K. Near-ice sat-urated conditions inside the chamber were achieved by coating the chamber walls with an ice layer [see a more detailed description of the chamber preparation in Wagner et al. (2009)].
In the first phase of the experiment, a cloud of supercooled droplets was generated using sulfuric acid (SA) solution droplets or dust particles originating from Argentina as seed aerosol. The SA solution droplets were generated using a generator specifically designed for AIDA (Möhler et al. 2003). The soil dust aerosol was added to the chamber by using a rotating brush gener-ator (RBG 1000, Palas) to disperse the particles and a cyclone impactor to remove particles larger than about 3 mm in diameter (e.g., Möhler et al. 2008). The con-centration inside the chamber was constantly monitored with a condensation particle counter (CPC3010, TSI). 1The German project title Streulichtintensitätsmessungen zum
Optischen Nachweis von Eispartikeln can be translated as Scat-tering Intensity Measurements for the Optical Detection of Ice Particles.
Different seed aerosol concentrations of about 10, 100, and 1000 cm23were used to produce liquid particles of different diameters. Here, we present data from three experiments: two simulating homogeneous freezing in SA solution droplets with different initial concentra-tions (experiments 15 and 17) and one simulating het-erogeneous nucleation on soil dust (experiment 24). The numbering of the experiment corresponds to the se-quence of the expansion in the AIDA campaign Rough Ice 3 (RICE03). The formation of the droplets was initiated by an expansion of the chamber gas, which led to a cooling of the chamber volume and an increase of the relative humidity (RH). The RH inside the cham-ber was measured with a combination of a fast chilled-mirror frost-point hygrometer (MBW, model 373) that measures the total (gas and condensed phase) water va-por concentration in the chamber, and with a tunable diode laser (TDL) spectrometer (Fahey et al. 2014) that measures the water vapor concentration. After water saturated conditions were reached, a cloud of super-cooled droplets formed. In the experiments, almost all the seed aerosol particles were activated to form cloud droplets so that the initial droplet concentration was determined by the seed aerosol concentration.
The cooling of the chamber volume was continued until a mixed-phase cloud consisting of frozen and super-cooled droplets was formed. In the mixed-phase cloud, the freshly formed frozen droplets grew through the Bergeron–Findeisen process, and, since the expan-sion cooling was continued, also because of deposition growth in an ice supersaturated environment. The duration of the mixed-phase cloud was dependent on the pumping speed and the initial aerosol concentra-tion. Three different pumping speeds were used: 60%, 80%, and 90% of the maximum speeds, corresponding to cooling rates of 21.5, 22, and 22.5 K min21, re-spectively. After full glaciation of the cloud, the fro-zen droplets continued the growth in supersaturated conditions (phase 2 of the experiment). During this phase, the microphysical and optical properties of the frozen droplets were observed with the in situ instruments: SID-3, PPD-2K, NIXE-CAPS, CAS-DPOL, PHIPS-HALO, and PN. The ensemble scat-tering and depolarization ratio was measured with SIMONE.
The frozen droplets were grown to maximum sizes between 40 and 50 mm. Then the expansion period was stopped, and a small compression was introduced to create subsaturated conditions. The sublimation of the frozen droplets denoted the third phase of the experi-ment. The same set of instruments was used to monitor the microphysical and optical properties of the sub-limating frozen droplets.
3. Results from cloud chamber experiments
In situ measurements have provided evidence that, in midlatitude convective systems, supercooled liquid wa-ter can exist to temperatures around 237 K, where ho-mogeneous freezing quickly converts the droplets into ice particles (Rosenfeld and Woodley 2000). AIDA cloud simulation experiments on the homogeneous freezing of supercooled droplets in convective systems are described insection 3a. In these experiments, the ice particles were formed through liquid phase (droplet freezing) and, therefore, in the following sections these laboratory-produced ice particles are called ‘‘frozen droplets,’’ independent of their actual shape. The mi-crophysical properties of liquid-origin ice particles may differ greatly from those of ice particles formed and grown through the vapor phase. Therefore, an exper-iment with soil dust as seed aerosol was performed for comparison (described in section 3b), where the ice formed through the deposition nucleation mode and grew by vapor diffusion. The differences in the ice microphysical and optical properties between frozen droplets with liquid origin and deposition nucleation– formed ice crystals at the same temperature regime are the subject of this section.
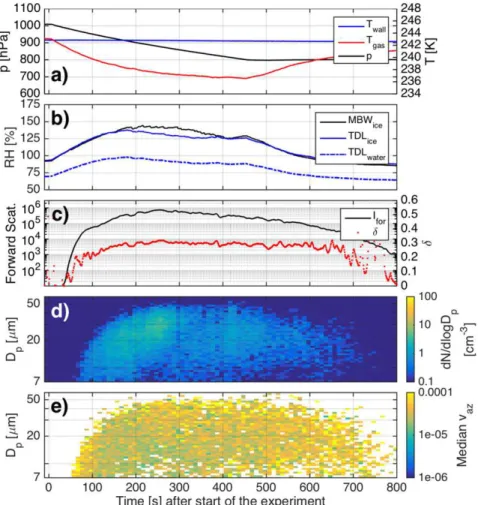
a. Ice particle formation through the liquid phase Figure 1 shows a droplet freezing experiment con-ducted with an initial number concentration of 12-cm23 SA solution droplets. The expansion was started at ex-periment time 0 s, as indicated by the start of the pressure decrease inFig. 1a. The cooling rate at the beginning of the expansion was 22.5 K min21, but in the course of the expansion the heat flux from the chamber walls reduced the cooling rate. At experiment time 83 s, water satura-tion was reached (dashed blue line inFig. 1b), and a cloud of supercooled liquid droplets was formed, indicated by the rapid increase in the forward-scattering in-tensity (Fig. 1c). Moreover, a zero depolarization ra-tio was measured indicating the presence of spherical particles in this period. The cloud particles were detected by the PPD-2K instrument after experiment time 100 s, when they have grown to diameters above 7 mm (Figs. 1d,e). In this first phase of the experiment, the 2D diffraction patterns of supercooled droplets recorded by the PPD-2K showed a concentric ring pattern [(i) inFig. 2] with yazbelow the threshold value of 1 3 1025(Fig. 1e).
The cooling was continued until the homogeneous freezing threshold around 237 K was reached at the experiment time 132 s. This led to a rapid glaciation of the cloud through homogeneous freezing of the su-percooled droplets. Just before freezing, the liquid droplets had reached a median diameter of 14 mm
(Fig. 3). The glaciation of the cloud led to an increase of the ice water content (IWC), as indicated by the dif-ference between the total water (MBW; black line in Fig. 1b) and the interstitial water (TDL; solid blue line inFig. 1b). At the same time, the depolarization ratio (Fig. 1c) started to depart from zero and reached a maximum of ;0.3 at 200 s after the droplets were fully depleted. The optical size of the frozen droplets did not significantly differ from the droplet size of the initial liquid, and therefore the glaciation is not visible in the PPD-2K size distribution (Fig. 1d). Yet the variance analysis clearly showed an increase in yaz during the mixed-phase conditions, and a sharp transition to yaz above the threshold value of 1 3 1025 was observed after full glaciation.
The PPD-2K scattering patterns of ice particles during the growth in mixed-phase conditions and, later, through vapor deposition, were dominated by speckles [(ii) inFig. 2], indicating a significant degree of small-scale complexity. We determined the small-scale complexity of the particles from the SID-3 scattering patterns using the method described in Schnaiter et al. (2016). This method relies on the gray-level co-occurrence matrix (GLCM) method described in Lu et al. (2006). The speckle-pattern features can be extracted from the GLCM by calculating features, like the energy feature. It was found in Lu et al. (2006) and Schnaiter et al. (2016)that the exponential fit coefficient to the energy feature, the so-called k value ke, best described the physical complexity, and therefore we use ke as the
FIG. 1. A droplet freezing experiment (experiment 17) initiated with 12 cm3of sulfuric acid
aerosol and a pumping speed of 90% that led to an initial cooling rate of 22.5 K min21. (a) The
pressure of the chamber (black line) as well as the chamber and wall temperatures (red and blue lines, respectively). (b) The total water measured with MBW (black line) and the interstitial water with respect to ice (blue solid line) and water (blue dashed line) measured with TDL. (c) The forward-scattering intensity (black line) and the depolarization ratio (red dots) were measured for cloud particles in the middle of the chamber. (d) The PPD-2K size distribution. (e) The size-segregated median variance of the 2D scattering patterns. The expansion of the chamber volume was started at experiment time 0 s.
complexity parameter in the remainder of this study. Values of kecan be between 4 and 6 so that increasing physical complexity results in a larger ke value. In the case of columnar particles, Schnaiter et al. (2016) determined a threshold value of 4.6 to discriminate between complex (ke$ 4:6) and pristine columns (ke, 4:6).
In our case, we measured a ke value of 6.5 for frozen droplets formed from liquid phase (Fig. 4). This value was significantly larger than what was measured for vapor-grown ice crystal at cirrus temperatures (Schnaiter et al. 2016).Schnaiter et al. (2016)showed that the small-scale complexity is driven by the available water vapor mixing ratio zacw
y : that is, the number of water molecules that are free to condense to the ice phase. In the chamber experiments with vapor-grown ice crystals at cirrus temperatures, the zacw
y varied between 0 and 20 ppmv (Schnaiter et al. 2016), whereas in this experiment we derived a zacwy value of 80 ppmv. This enhancement is likely promoted by the Bergeron–Findeisen process, the warmer temperature, and the initial growth at near-water saturation. It is possible that the small-scale complexity of liquid-origin ice particles could be se-verely enhanced compared to in situ grown ice crys-tals. Large-scale complexity (e.g., riming) is frequently found in mixed-phase cloud (e.g.,Ono 1969), but as a
result of instrument limitations, small-scale complexity could not be studied. Therefore, field measurements in mixed-phase regions with SID-type instruments would be needed to validate our laboratory findings.
The growth of the frozen droplets was stopped after a median diameter of 22 mm was reached (Fig. 3). In the third phase of the experiment, the frozen droplets were forced to sublimate under ice-subsaturated conditions. The sublimation was seen in the PPD-2K diffraction patterns, as ringlike patterns started to emerge, and these patterns became more concentric toward the end of the sublimation. The emerging of the rings can be linked with the decrease in the crystal complexity (Fig. 4). This is also seen in yaz(Fig. 1e); yazslowly decreased to values below the threshold value, and at the end of the sublimation period, yazof the sublimating frozen droplets was almost equivalent to that of liquid droplets [cf. yaz of the liquid droplet (i) and sublimating frozen droplet (v) inFig. 2]. However, these optically spherical particles cannot be liquid droplets, as the temperature during sublimation period of the fully glaciated cloud stayed well below 2308C. Furthermore, the depolarization ratio decreased from 0.3 measured for complex fro-zen droplets to 0.1 measured for sublimating frofro-zen droplets, providing further evidence of the changing particle shape. At the end of the sublimation, the
FIG. 2. Simulation of the deformation of sphere’s surface with a Gaussian random sphere model. (middle) The surface of a sphere was altered with a relative deformation between 0 and 0.3. (bottom) The resulting 2D scattering patterns. (top) Particles i–v were measured with the PPD-2K during experiment 17 (Fig. 1). The yazvalues describe the degree of asphericity in the real ice particles according to the
frozen droplets were observed to have diffraction pat-terns similar to spherical particles [(v) inFig. 2]; that is, the particles were optically spherical, and the particle size distribution established was close to that of the supercooled droplets at the beginning (Fig. 3).
The difference between optically spherical and quasi-spherical ice particles is well depicted inFig. 5. It shows the PHIPS-HALO images of frozen droplets during the experiment in a chronological order. At the beginning, the ice particles seem almost perfectly spherical, al-though, based on the PPD-2K variance analysis and the SID-3 complexity analysis, we know that these particles were highly distorted. The distortion lies in the micro-structures of these particles and therefore cannot be seen from the PHIPS-HALO images with restricted resolu-tion. Only after a certain growth does the nonspherical nature of these particles emerge. During sublimation, the ice particles rather quickly lose the clear aspherical fea-tures and become again quasi spherical. Now, both the variance analysis and the complexity analysis agree that the quasi-spherical particles also are optically spherical. Therefore, although the first and last PHIPS-HALO images in Fig. 5 look almost identical, their light-scattering properties are very different, which highlights the need for sophisticated measurement techniques for the investigations of the microphysical nature of small ice particles.
The experiment procedure was repeated with differ-ent concdiffer-entrations of SA solution droplets as seed aerosol. The seed aerosol number controls the size dis-tribution of the supercooled droplets so that, the higher the seed aerosol concentration is, the more droplets are formed, and their size remains smaller (see blue curves inFig. 3). With an initial concentration of 989 cm23, the median diameter of the supercooled droplets stayed below 7 mm before freezing. Since the droplets were smaller, the ice particles also remained smaller, with median diameter of 18 mm (Fig. 3). During sublimation, the size distribution of the smooth frozen droplet cores was again similar to the initial droplet size distribution. Therefore, it can be concluded that the liquid droplets kept their spherical form in the freezing process, but the spherical shape was quickly distorted under the rapid depositional growth under near-water-saturated condi-tions. Under sublimation, it is possible to regain the spherical core, and the size of this core is comparable to the original droplet size.
1) FORMATION OF A FROST LAYER DURING THE GROWTH OF FROZEN DROPLETS
A variation of structural or morphological deformities in a single ice crystal can cause speckles to appear in the PPD-2K diffraction patterns. However, in the case of laboratory-produced frozen droplets, the speckles in the
FIG. 3. Averaged size distributions of supercooled droplets before freezing, rough frozen droplets when their size is at maximum, and smooth sublimating frozen droplets. (a) Experiment 17 was started with an aerosol concentration of 12 cm3and (b) experiment 15
with 989 cm3. The size of the sublimated and optically spherical frozen droplets is governed by
the size of the supercooled droplets before freezing.
diffraction patterns were most likely caused by the de-velopment of surface roughness over a spherical core in the initial growth. As the amount of condensable water vapor was high during the initial growth, the deposition of the water molecules probably took place all over on the surface, instead of prismatic edges leading a frost layer to develop. Since the growth took place all over the surface, the frozen droplets were observed to be quasi spherical in the PHIPS-HALO images (Fig. 5). Only in the later growth phase do the ice particles seem to deviate more clearly from a spherical shape. Similar growth behavior was observed in the study ofKorolev et al. (2004), where large (.100 mm) droplets were observed to grow quasi spherical in a diffusion cham-ber. The observations could also explain field obser-vations, where frozen droplets had maintained their quasi-spherical form in their formation, growth, and transportation to anvil regions (e.g.,Stith et al. 2014).
The scale of the surface roughness that can be ob-served with the SID-3 method is from 100 nm to about 1 mm (Lu et al. 2006;Schnaiter et al. 2016). Figure 6 shows an illustration of how a physical frost layer with the roughness scale could look in the case of a com-plex frozen droplet. In subsaturated conditions, the sharp edges of the frost layer are sublimated first, since they have a higher saturation vapor pressure. Eventu-ally, the frost layer can be completely obliterated so that a smooth spherical core remains, as seen in the PHIPS-HALO (Fig. 5) and PPD-2K images (Fig. 2).
We investigated the effect of surface roughness on the light-scattering properties in the angular range of the PPD-2K instrument by using a Gaussian random sphere geometry [see details in Schnaiter et al. (2016)]. Simi-larly,Nousiainen and McFarquhar (2004)used the same model to study quasi-spherical ice particles. The model particles and the corresponding diffraction patterns at
FIG. 4. Aspherical fractions during experiment 17 (Fig. 1) from PPD-2K (blue line) using an automated routine or applying a manual cross-check (red line) from NIXE-CAPS (green line) and from CAS-DPOL (magenta line). Also shown are the asymmetry parameter g (black solid line) determined from PN measurements and the complexity parameter ke(black dashed line)
FIG. 5. A collection of PHIPS-HALO ice particle images from growth phase (highlighted with red box) and from sublimation phase (highlighted with blue box) of experiment 17. The images are shown in chronological order.
the angular range of the PPD-2K instrument are shown inFig. 2. The modulation of the model sphere’s surface results in similar diffraction patterns that were mea-sured for the complex frozen droplets. Furthermore, by decreasing the degree of the distortion, the underlying ringlike diffraction patterns of a sphere emerge, simi-lar to what was seen in the measurements. However, it should be kept in mind that surface modulation in the Gaussian random sphere model does not necessarily accurately describe the physical frost layer.
2) COMPARISON OF ASPHERICAL FRACTIONS
The values of yaz measured with PPD-2K can be con-verted into an aspherical fraction by applying yaz.Figure 4 shows the aspherical fraction as a function of experiment elapse time determined from the PPD-2K using the vari-ance analysis and, as a comparison, from NIXE-CAPS and from CAS-DPOL using single-particle polarization in-formation in the size range of 8–50 mm. Both of the methods show zero aspherical fraction during the liquid phase and a steep increase in the aspherical fraction during the glaciation process. After the full glaciation, the aspherical fraction determined from PPD-2K and CAS-DPOL varies between 0.95 and 1, whereas the aspherical fractions from the NIXE-CAPS are somewhat lower, between 0.9 and 0.95. The differences between the aspherical fractions of CAS-DPOL and NIXE-CAPS may stem from minor differences of the detectors and the differing methods to classify the particles asphericity as described insection 2. In the sublimation phase of the experiment, the methods show a similar decrease in the aspherical fractions, indicating an increasing presence of smooth sublimating frozen droplets.
The presented methods use the angular light-scattering properties to define aspherical particles. Another method for determining the aspherical fraction is to determine the particle asphericity from the CPI images. McFarquhar et al. (2013)used the area ratio a (i.e., the projected area of a particle divided by a circumscribed circle with di-ameter Dmax) as a measure for the particle sphericity and defined particles having a , 0:8 as aspherical. However, the problem with imaging methods is that small particles can appear spherical in the images, which leads to an underestimation of the aspherical fraction. Here, we de-fined the aspherical fraction from the PHIPS-HALO images based on the same method. We calculated the area ratio and applied a somewhat higher threshold of 0.9 to distinguish between spherical and aspherical particles. The aspherical fraction is illustrated by the orange curve in Fig. 4. As expected, the same trend is seen in the aspherical fraction; however, the maximum aspherical fraction after full glaciation is lower compared to the aspherical fractions derived from PPD-2K, NIXE-CAPS, and CAS-DPOL and varies between 0.5 and 0.7.
Aspherical fraction is commonly used to distinguish between ice particles and water droplets in mixed-phase clouds, with the assumption that ice particles have a shape that differs from a sphere. In the case of vapor-grown cirrus clouds, this is usually the case; however, in convective systems the presence of smooth frozen droplets can potentially lead to a misinterpretation of the ice fraction, as the quasi-spherical ice particles can be misclassified as droplets. At the end of the sublimation period in the laboratory experiment, the automated al-gorithm of PPD-2K and the polarization-based measure-ments would have misclassified 80% of the ice particles
FIG. 6. Proposed microphysical model for the frozen droplets. Supercooled liquid droplets freeze and develop a frost layer on the surface of the particles in the initial growth. In the sublimation, the fine structure of the frost layer is sublimated first, and after a certain time a smooth optically spherical core can be detected.
as droplets; however, these methods performed well in the growth phase, when only complex frozen droplets were present. The analysis of the PHIPS-HALO images led to the largest uncertainty in the ice fraction, as the derived aspherical fractions were always below those derived from PPD-2K, NIXE-CAPS, or CAS-DPOL. The most sensitive method for distinguishing ice particles was the analysis of the PPD-2K diffraction patterns, as these patterns still contain information from the ice phase, even if the ice particles seem to be almost perfect spheres. Particle v in Fig. 2 is a diffraction pattern of a slightly deformed ice sphere that shows a somewhat elongated ring pattern and therefore can be identified as an ice particle. A visual inspection of the scattering patterns was performed (red line in Fig. 4). As a result of this procedure, a 100% aspherical fraction was measured during the growth of the ice particles, and, even at the end of the sublimation period, only 5% of the ice particles were misclassified as droplets.
3) THE LINK BETWEEN THE MICROPHYSICAL AND OPTICAL PROPERTIES OF FROZEN DROPLETS
The single-scattering properties of ice particles are dependent on their shape, size, and surface properties.
Aspherical and complex ice particles can increase the amount of light scattering into the backward hemi-sphere as compared to liquid droplets (e.g., Gayet et al. 1997;Ulanowski et al. 2006;Febvre et al. 2009; Cole et al. 2014) and therefore change the radiative properties of clouds. We investigated the angular light-scattering properties of the simulated convective clouds with two polar nephelometers (PN and PHIPS-HALO). The measured angular scattering functions were parameterized with the asymmetry parameter g (black solid line inFig. 4), which gives the degree of asymmetry of the scattering function with respect to the scattering angle of 908. The measured g values were strongly linked to the small-scale complexity of the frozen droplets. A maximum value for a asymmetry parameter of 0.85 was measured in the supercooled droplet cloud and a minimum value of 0.74 after the complete glaciation of the cloud, when the highest small-scale complexity was measured. Our observations are consistent with previous studies, where low asymmetry parameters have been detected in the case of roughened cirrus ice par-ticles (Cole et al. 2014;Schnaiter et al. 2016). In the sublimation period, g was observed to increase as the small-scale complexity of the frozen droplets decreased.
FIG. 7. Averaged angular scattering phase functions for water droplets (light blue squares), frozen droplets during their growth (red squares), frozen droplets at the end of the sublimation period (dark blue squares), roughened columns at 2508C (orange squares;Schnaiter et al. 2016), and anvil outflow ice particles measured during ACRIDICON-CHUVA flight AC11 (magenta squares). The latter scattering phase function is averaged from all ice particles measured during anvil sampling between 1630 and 1642 UTC 16 Sep 2014. All the measure-ments in this figure were conducted with the PHIPS-HALO instrument.
Almost the same value for g was reached at the end of the experiment as was measured for the initial liquid droplet cloud, hence confirming the previous observations that the sublimating frozen droplets can behave optically equivalent to spheres.
Figure 7 highlights the dramatic effect that small-scale complexity has on the averaged angular scattering properties of frozen droplets. The averaged angular scattering function of roughened frozen droplets measured in laboratory simulations (red squares in Fig. 7) is smooth, featureless at scattering angles less than 1008, and has an enhanced scattering intensity in the backward hemisphere. Interestingly, the averaged scattering response of the complex frozen droplets does not significantly differ from that of complex
columns measured in simulated cirrus clouds (orange squares; Schnaiter et al. 2016). In these two labora-tory simulations, it is difficult to identify the un-derlying shape of the ice particles from the averaged scattering phase function, but instead the crystal complexity seems to dominate the average scattering properties.
If the frost layer is sublimated from the surface of the frozen droplets, they scatter light similar to water droplets (dark blue squares inFig. 7) and show droplet-like features: that is, a minimum between 1008 and 1208 and a rainbow-like feature (in this case ice bow) around 1408. Similarly,Gayet et al. (2012a)observed an ice-bow-like feature around the same angle for near-spherical ice particles at the top of a convective storm.
FIG. 8. Simulation of a convective system, where the ice particles nucleate through vapor phase (experiment 24). The experiment was started with 16 cm3 of Argentinean soil dust
particles and a pumping speed of 60% that led to an initial cooling rate of 21.5 K min21. (a) The
pressure of the chamber (black line) as well as the chamber and wall temperatures (red and blue lines, respectively). (b) The total water measured with MBW (black line) and the interstitial water with respect to ice (blue solid line) and water (blue dashed line) measured with TDL. (c) The forward-scattering intensity (black line) and the depolarization ratio were measured for cloud particles in the middle of the chamber. (d) The PPD-2K size distribution. (e) The size-segregated median variance of the 2D scattering patterns.
Baran et al. (2012)was able to explain this feature by assuming independent quasi-spherical ice particles. Surprisingly, the ice-bow-like feature is also observed in the case of the complex frozen droplets, but with a peak around 1308. This shift in the ice bow can be modeled by increasing the distortion of the quasi-spherical model particles (Baran et al. 2012). Baran et al. (2012)also argued that the underlying spherical shape of the ice particles can survive the addition of surface roughness or distortion. However, an ice bow was also observed in the study ofSchnaiter et al. (2016) (orange squares inFig. 7), which could indicate a more universal feature in ice clouds that is not only related to spherical ice particles.
b. Ice particle formation through vapor phase In this section, the optical and microphysical prop-erties of ice particles formed by the deposition nucle-ation mode are discussed. The experiment procedure
was identical to what is presented insection 3a, with the exception that Argentinean soil dust was used as heterogeneous ice nuclei. The first ice particles were formed at experiment time 32 s, when a temperature of 242 K and Siceof 1.03 were reached (Fig. 8b), indicating the high nucleation activity of this specific dust sample. The formation of the cloud is seen in the increase in the forward-scattering signal, and the depolarization ratio above zero confirms the presence of ice particles (Fig. 8c). Water saturation was not reached during this experiment, and therefore all the ice particles were nucleated and grown through the vapor phase. The nucleation spectrum of the soil dust was rather wide, which led to a broad ice size distribution measured by PPD-2K inFig. 8d; small (below 10 mm) and larger (up to 50 mm) ice particles coexisted throughout the experiment. At experiment time 455 s, the expansion was stopped, and the ice particles were allowed to sublimate.
FIG. 9. Aspherical fractions during experiment 24 (Fig. 6) PPD-2K (blue line), NIXE-CAPS (green line), and CAS-DPOL (magenta line). Also shown are the asymmetry parameter g (black solid line) determined from PN measurements and the complexity parameter ke(black
dashed line) determined from SID-3 measurements.
A significantly different trend in the ice microphys-ical and optmicrophys-ical properties was observed as compared to the ice cloud formed by droplet freezing (Figs. 8and 9). The PPD-2K variance analysis gave no evidence of spherical ice particles (Fig. 8e), and, consequently, a constant aspherical fraction close to 1 was measured (Fig. 9). The aspherical fraction measured by NIXE-CAPS and CAS-DPOL was clearly lower, around 0.7– 0.8. This difference is much larger than the difference between PPD-2K and the polarization-based measure-ments of the previous experiment (Fig. 3). The aspher-ical fraction determined from the PHIPS-HALO images was now higher and comparable to the polarization-based measurements after the ice particles had reached their maximum size. Possible explanations for the dif-ferences in the aspherical fractions are different ice microphysical properties and a broader particle size distribution in case of heterogeneously nucleated ice particles.
Moreover, the ke value stayed constant, having a mean value of 6.1. This value was slightly lower than what was measured for the growing frozen droplets in section 3a. The difference in the small-scale complexity can be explained with the ice-growing conditions (Schnaiter et al. 2016), since the vapor-grown ice parti-cles grew at lower ice saturation than the ice formed through the liquid phase. The first ice particles, grown at
the lowest supersaturation, were observed to have pristine columnar shape (Fig. 10), but as Sicewas con-stantly increasing, the majority of the ice crystals grew complex. Furthermore, the variation in g was signifi-cantly lower than in the previous experiment; a rela-tively high g of 0.8 was measured at the beginning, when pristine columns were present, but that later quickly decreased to values between 0.76 and 0.75. Thereafter, only little variation was observed before the end of the sublimation period, when g increased to 0.78. However, g over 0.8 was never observed in this experiment, in-dicating that the angular scattering function clearly re-sembled what is expected for aspherical ice particles. Also the depolarization ratio was observed to remain constant around 0.3 throughout the experiment. The constant depolarization ratio together with the analysis of the scattering patterns and the g value showed that the ice particles that were heterogeneously nucleated and grown through the vapor phase remained non-spherical and had optical properties that were rather constant (largest variation was observed in g) throughout the growth and sublimation.
4. Case study of a midlatitude convective system during MACPEX
Measurements in a midlatitude convective system were performed over Texas on 21 April 2011 during
FIG. 10. Calculated column fractions based on PPD-2K measurements for (top) experiment 17 and (bottom) experiment 24. During experiment 17, the ice particles are classified as ir-regular, and no signs of hexagonal shapes are found. During experiment 24, the first ice crystals formed in deposition nucleation at low Siceand grew to columnar shape. At the later stage of
the Midlatitude Airborne Cirrus Properties Experi-ment (MACPEX) campaign using the NASA WB-57 aircraft. On that day, two convective systems had developed over western Texas and northern Mexico, and the anvil outflow from these two systems extended ;100 km east toward central Texas.Figure 11shows the flight path of the WB-57 over a satellite image. The measurements in anvil outflows were conducted be-tween 2300 and 2359 UTC (flight path marked in or-ange). The WB-57 flew first under the northern anvil at an altitude of 9 km, sampling the lower part of the out-flow. At 2322 UTC, the aircraft ascended through the anvil outflow, exiting at an altitude of 13.5 km. The temperature at the lower parts of the anvil was 239 K, and a temperature of 212 K was reached at the upper part of the anvil.
The anvil profile during the ascent shows an in-crease in the sub-40-mm ice particle concentrations from 3.5 to 10 cm23(Fig. 12a). Particularly small ice crystals in the sub-20-mm size range are found at the top of the convective system (Fig. 12b). Although the ice particle concentrations are significantly larger than normally measured in cirrus clouds (Lawson et al. 2006; Krämer et al. 2009), they compare well to what was previously measured in the anvil of a midlatitude storm (Gayet et al. 2012a;Stith et al. 2014). An inspection of the CPI images (Fig. 13) revealed the presence of small
ice particles with a distinct signature of frozen droplets. Approximately 84% of all the CPI observed particles were classified as single frozen droplets and 2.2% as aggregates of frozen droplets. The high fraction of frozen droplets indicate that the majority of the ice particles were formed through liquid phase in the mixed-phase region of the convective cell, from where they were transported to the anvil region in the up-draft, forming the dominant particle type. The high fraction of frozen droplets is in agreement with pre-vious studies of midlatitude convective systems (Gayet et al. 2012a;Stith et al. 2014).
The water vapor measurements during the anvil sam-pling from the NASA diode laser hygrometer (DLH; Diskin et al. 2002) show that most of the time the frozen droplets were found in ice-subsaturated conditions (black points inFig. 12a). Especially strong subsaturated conditions were measured around 2330 UTC, when Sice reached 0.6. The subsaturated conditions together with the high concentration of small ice particles give evi-dence that these ice particles had formed almost simul-taneously in a vigorous updraft and thus quickly depleted the available water vapor. This depletion of the H2O vapor obviously prevented further ice particle growth, and as a consequence they remained small. The same phenomenon was also observed in the AIDA cloud chamber simulation (section 3a): after the cloud was
FIG. 11. The flight path of the NASA WB-57 aircraft superimposed on a satellite image. The anvil sampling was conducted between 2300 and 2359 UTC, marked with an orange color. The two convective systems are seen in the bottom-left corner of the satellite image.
glaciated, Sicestarted to quickly decrease, although the chamber cooling was continued.
The results from the chamber experiments indicate that the majority of the frozen droplets measured by the CPI during the MACPEX flight should have been sub-limating, and we would expect to see spherical ice par-ticles appear. An inspection of the SID-3 diffraction patterns indeed shows signatures of spherical particles. Two types of ring patterns were observed. First, SID-3 images with clear ring patterns were seen (Fig. 14a), similar to the observation in the laboratory in the case of sublimating frozen droplets (section 3a). Second, patterns with underlying concentric rings with some-what bended lines crossing the patterns were observed (Fig. 15). With the help of 2D Fourier transform sim-ulations, we were able to identify that these patterns were the result of aggregation.Figure 15shows simu-lations for a double aggregate, a triple aggregate, and
an aggregate of 10 spheres. The size of the spheres was kept constant, and the light diffraction was simulated at the angular range of the SID-3 instrument. Despite the increase in the complexity due to aggregation, the un-derlying concentric-ring pattern does not seem to dis-appear, but an additional structure is added inside the rings. The double aggregates show a unique pattern that can be easily identified from the SID-3 measure-ments, but as the number of spheres in the aggregates increases, the patterns become more difficult to iden-tify, and they are not distinguishable from complex ice crystals. We were successful in identifying double ag-gregates and a few triple agag-gregates form the MAC-PEX dataset (bottom row inFig. 15).
The presence of sublimating frozen droplets was also confirmed with the automated variance analysis that showed low yaz values for ice particles around 20 mm (Fig. 12c). The size of the smooth frozen droplets seen
FIG. 12. SID-3 and water vapor measurements during anvil sampling on 21 Apr 2011. (a) The total concentration for particles between 5 and 45 mm and Sice. (b) The particle size
distribution. (c) The size-segregated variance analysis results. (d) The size-segregated column fraction.
by SID-3 is comparable to the size of the frozen droplets seen in CPI images, and the measured frozen droplet sizes also agree with previous observations (Baran et al. 2012;Stith et al. 2014). The smallest, sub-20-mm,
anvil-outflow ice particles were observed to be aspher-ical (high yazinFig. 12c), with indications of columnar shape (Fig. 12d). The origin of these small aspherical particles is not clear. Although columnar, these small
FIG. 13. A collection of ice particles imaged with 3V-CPI in the convective outflow during MACPEX. Mainly single frozen droplets were detected with few aggregates of frozen droplets.
particles show a high degree of complexity. It is possible that these particles have formed in situ through the va-por phase in the later phase of the convection and therefore do not appear spherical in subsaturated con-ditions, as seen in the simulated cloud insection 3b. 5. Case study of a tropical convective system during
ACRIDICON-CHUVA
Measurements in a tropical convective system were carried out during the Aerosol, Cloud, Precipitation, and Radiation Interactions and Dynamics of Convec-tive Cloud Systems–Cloud Processes of the Main Precipitation Systems in Brazil: A Contribution to Cloud Resolving Modeling and to Global Precipitation Measurement campaign [ACRIDICON-CHUVA; see details for the ACRIDICON part of the campaign in Wendisch et al. (2016)], where airborne observations were done with the HALO aircraft. On 16 September
2014, convective systems were targeted over the Am-azonian rain forest. Developing convective systems were observed northwest of Manaus, and the HALO aircraft reached the area of outflows about 1.5 h after their formation. The HALO aircraft traversed two separate outflows from north to south at an altitude of 12.7 km. The total particle number concentration is shown inFig. 16aand the particle size distribution during the anvil sampling inFig. 16b. The maximum particle number concentration was 2.3 cm23, but, on average, particle concentrations were found to be below 1 cm23. The size distribution shows that the majority of the sub-50-mm particles are found below 20 mm.
Visual inspection of the PHIPS-HALO images reveals a significant amount of small ice particles (Fig. 17). Overall, 23% of the imaged ice particles were classified as frozen droplets and 19% as other small (,50 mm) irregular ice particles. With smaller
FIG. 14. Examples of single-particle diffraction patterns measured in convective outflow during (a) the MACPEX flight on 21 Apr 2011 and (b) ACRIDICON-CHUVA flight AC11 on 16 Sep 2014. While during MACPEX the frozen droplets were found to be sublimating, the majority of the ice particles measured during ACRIDICON-CHUVA were found in supersaturated conditions.
fractions were observed plates (9%), bullet rosettes (14%), columns (3%), and aggregated ice particles (15%). The RH conditions were measured with the Sophisticated Hygrometer for Atmospheric Research (SHARC) in situ tunable diode laser hygrometer. Slightly supersaturated or near-ice-saturated condi-tions were observed throughout the sampling (Fig. 16a), so it can be expected that the ice particles were not sublimating. Therefore, it is no surprise that the SID-3 diffraction patterns (Fig. 14b) or the variance analysis (Fig. 16c) do not show indications of sub-limating frozen droplets, but the ice particles were found to be rough and irregular. The smallest ice particles were found to have indications of a
hexagonal shape, similar to the convective outflow during MACPEX.
The angular scattering function was measured si-multaneously with PHIPS-HALO. We averaged the angular scattering functions of individual ice particles to form an averaged angular scattering function for the cloud. This average scattering function is almost identical to the scattering phase function measured in the laboratory for rough frozen droplets (Fig. 7): that is, it is smooth and features up to a scattering angle of 1008 and an enhanced scattering to the backward hemisphere. An ice-bow-like feature is seen around 1308, similar to rough frozen droplets or roughened columns. Some differences are seen in the scattering
FIG. 15. Simulation of diffraction patterns from frozen droplet aggregates using 2D Fourier transform on idealized ice spheres. (top) Simulations were made for aggregates of 2, 3, and 10 spheres, where the sizes of the individual spheres were kept constant. (middle) The simulation results. (bottom) Diffraction patterns of real aggregated frozen droplets found in a convective outflow over Texas during the MACPEX campaign.
behavior between 508 and 1008 and at scattering angles greater than 1468, but this can be explained by the presence of other particle habits.
6. Atmospheric implications
The difference in the angular scattering function of roughened and smooth frozen droplets (Fig. 7) illustrates the uncertainty in the scattering properties of small quasi-spherical ice particles. The impact of frozen drops on climate is governed by their frequency and the environ-mental conditions they are found in. This study, together with previous studies in midlatitude convective systems (Lawson et al. 2003;Gayet et al. 2012a;Stith et al. 2014), indicates that frozen droplets are abundant in midlatitude convective outflows and, therefore, that they are impor-tant for their radiative properties. In tropical outflows, other particle types seem to be more frequent (Lawson et al. 2003; Connolly et al. 2005; Frey et al. 2011),
although we were able to detect frozen droplets in con-vective outflow of a cumulonimbus cloud over Brazil.
Independent of the location, we can expect that frozen droplets have a high degree of complexity if found in supersaturated environmental conditions and, there-fore, have a flat angular scattering function and a low asymmetry parameter. In this study, such a scattering phase function was measured in a tropical outflow (Fig. 7), and in a study ofGayet et al. (2012a), the au-thors reported a relatively low asymmetry parameter of 0.776 for ice particles at the top of a convective storm. In both cases, mostly ice supersaturated conditions were observed.
However, ice particles are frequently found in sub-saturated regions (e.g., Krämer et al. 2009). In labo-ratory experiments, we showed that in sublimation the frozen droplets can become smooth and optically spherical. Gayet et al. (2012a) reported an increase in the asymmetry parameter in the later phase of the
FIG. 16. SID-3 and water vapor measurements during anvil sampling on 16 Sep 2014. (a) The total concentration for particles between 7 and 50 mm and Sice. (b) The particle size distribution.
measurements in the convective outflow that was linked with sublimation of the ice particles. During MACPEX, optically spherical ice particles were observed from SID-3 measurements, and the presence of these parti-cles could have led to a similar increase in the cloud-averaged asymmetry parameter compared to what was reported inGayet et al. (2012a)if simultaneous polar nephelometer measurements would have been avail-able. Until now, polar nephelometer measurements in outflows have only been reported in a few cases; there-fore, it is impossible to predict the role of quasi-spherical
frozen droplets in the radiative properties of convective clouds. A clear need for simultaneous scattering and detailed microphysical measurements is evident, espe-cially in midlatitude convective outflows, where sub-limating frozen droplets can be expected.
Besides in anvil outflows, frozen droplets can also be found in contrails. Contrails are formed when liquid water droplets form by condensation of water vapor mainly on soot and volatile particles in an exhaust plume (Schumann 2005;Kärcher and Yu 2009). In the colder and humid upper troposphere, the droplets freeze and
FIG. 17. A collection of ice particles imaged with PHIPS-HALO in a tropical outflow anvil. In this particular case, a significant fraction of small ice particles was detected. Other observed habits were plates, aggregates of plates, and bullet rosettes.
form a visible contrail, which spreads out and becomes persistent at ice supersaturated conditions. Although contrail cirrus is outside the scope of this paper, our laboratory results can also help to understand observa-tions made in young contrails in studies ofFebvre et al. (2009)andGayet et al. (2012b).Febvre et al. (2009)found that young (about 2.5 min of age) contrails have a high asymmetry parameter (0.827) compared to aged (about 20 min of age) contrails (0.787). Similar behavior was found from experiments during the Contrail and Cirrus Experiment (CONCERT) campaign (Voigt et al. 2010) in the aging contrail from an A380 aircraft byGayet et al. (2012b). A decrease in the asymmetry parameter from 0.88 to 0.8 was observed already within the first 5 min of contrail evolution. These observations were associated and interpreted with an increasing fraction of aspher-ical particles, as no other information on particle complexity was available at that time: ‘‘Unfortunately, the transition from quasi-spherical shapes to irregular ice particles in the atmosphere is poorly understood’’ (Febvre et al. 2009, p. 10). The laboratory results shown in this paper might help to explain the transformation from spherical ice to aspherical (or roughened) ice. Since supersaturated conditions are necessary for for-mation of an aged contrail, our results would indicate that the ice particles found in aged contrails are rough-ened or complex compared to the newly formed con-trail ice particles that have not yet developed crystal complexity. Specifically, the change in the scattering intensity in the backward hemisphere observed by Febvre et al. (2009)andGayet et al. (2012b)is compa-rable to what was simulated in laboratory. Therefore, as with convective outflows, the radiative properties of contrails might be governed by the degree of complexity of small ice crystals.
7. Conclusions
Small quasi-spherical ice particles are proposed to have an important role in determining the radiative properties of midlatitude convective outflows. How-ever, their microphysical and scattering properties are only vaguely known. In this paper, the microphysical and optical properties of these ice particles were stud-ied in cloud chamber simulations. We employed a new method to study the ice particle complexity along with their asphericity based on analysis of 2D diffraction patterns measured with the SID-3 and PPD-2K in-struments. With simultaneous polar nephelometer measurements, we were able to find a link between the microphysical and radiative properties of the simulated ice particles. The following four major conclusions can be drawn from the chamber experiments:
1) It is possible to discriminate between optically spher-ical and quasi-spherspher-ical ice particles based on their 2D diffraction patterns.
2) The microphysics of these particles can vary strongly: a high degree of complexity is developed during the formation and initial growth of the frozen droplets in mixed-phase cloud. This complexity can be removed in sublimation, and the resulting ice particles re-semble smooth spheres.
3) The complex or roughened frozen droplets have a low asymmetry parameter and show a flat scattering phase function that does not significantly differ from that measured for other ice clouds composed of roughened ice particles.
4) The sublimating frozen droplets have a high asym-metry parameter, and they can act optically similarly to water droplets.
In fact, a maximum difference in the angular light-scattering properties is observed, mainly as a result of the change in the frozen droplet surface properties. Therefore, the scattering properties of these particles are highly uncertain and need to be addressed in future field measurements.
We applied the methods developed in the labora-tory in two aircraft campaigns in midlatitude and tropical convective outflows. In the midlatitude sys-tem, single frozen droplets were found to be the dominant ice particle type. Subsaturated conditions were recorded, and this led to sublimation of the fro-zen droplets. Consistent with the laboratory simula-tions, the measured SID-3 diffraction patterns showed indications of sublimating and smooth ice spheres, which could indicate that the cloud radiative proper-ties might be affected by optically spherical ice. However, polar nephelometer measurements were not available to validate this. We were also able to locate frozen droplets in a tropical convective system. The ice particles were found in supersaturated con-ditions or near ice saturation, and, therefore, no in-dications of smooth ice spheres were found. The average angular scattering function measured during the anvil sampling was similar to what was measured in laboratory for complex frozen droplets. In conclu-sion, the results from the two case studies in natural convective systems were consistent with the labora-tory measurements of simulated convective systems.
Acknowledgments. We gratefully acknowledge the DLH instrument group for providing the RH measure-ments during the MACPEX campaign and Martin Zöger and his team from German Aerospace Center for providing the RH data during the ACRIDICON-CHUVA campaign.