Publisher’s version / Version de l'éditeur:
Canadian Geotechnical Journal, 10, pp. 227-245, 1973-05
READ THESE TERMS AND CONDITIONS CAREFULLY BEFORE USING THIS WEBSITE. https://nrc-publications.canada.ca/eng/copyright
Vous avez des questions? Nous pouvons vous aider. Pour communiquer directement avec un auteur, consultez la première page de la revue dans laquelle son article a été publié afin de trouver ses coordonnées. Si vous n’arrivez pas à les repérer, communiquez avec nous à [email protected].
Questions? Contact the NRC Publications Archive team at
[email protected]. If you wish to email the authors directly, please see the first page of the publication for their contact information.
NRC Publications Archive
Archives des publications du CNRC
This publication could be one of several versions: author’s original, accepted manuscript or the publisher’s version. / La version de cette publication peut être l’une des suivantes : la version prépublication de l’auteur, la version acceptée du manuscrit ou la version de l’éditeur.
Access and use of this website and the material on it are subject to the Terms and Conditions set forth at
Instrumentation around a warm oil pipeline buried in permafrost
Slusarchuk, W. A.; Watson, G. H.; Speer, T. L.
https://publications-cnrc.canada.ca/fra/droits
L’accès à ce site Web et l’utilisation de son contenu sont assujettis aux conditions présentées dans le site
LISEZ CES CONDITIONS ATTENTIVEMENT AVANT D’UTILISER CE SITE WEB.
NRC Publications Record / Notice d'Archives des publications de CNRC:
https://nrc-publications.canada.ca/eng/view/object/?id=738e512f-3b1d-4b55-a783-10e2d1277c69 https://publications-cnrc.canada.ca/fra/voir/objet/?id=738e512f-3b1d-4b55-a783-10e2d1277c69Instrumentation Around
a
Warm
Oil
Pipeline Buried in
Permafrost1
W. A. SLUSARCHUK
Division o f Blrilding Research, Nutional Research Corrncil of Canada, Ottawa, Canada
G. H. WATSON
Mackenzie Valley Pipe Litre Research Limited, Calgary, Alberta AND
T. L. SPEER
Mackenzie Valley Pipe Line Research Limited, Calgary, Alberta
Received September 25, 1972 Accepted January 16, 1973
A section of an uninsulated pipeline, 90 ft (27.4 m) long and 2 ft (0.61 m) in diameter, was buried in ice-rich permafrost at the Mackenzie Valley Pipe Line Research Limited Inuvik Test Facility. Oil at 160 " F (71 "C) was circulated through the pipe from July 1971 to January 1972 causing a thaw bulb to develop around it.
Instrumentation was placed around the pipe to measure temperature, settlement, and pore-water pressure. Temperatures near the ground surface and at depth were measured using thermistors as the sensing element. Settlement was monitored by spiral foot gauges and by taking elevations at the ground surface and on rods welded to the pipe. Pore pressures were measured by gas-operated and Casagrande-type piezometers. Selection, fabrication, and installation of this instrumentation are discussed.
On a enterre un tuyau de pipe-line non isole de 90 pieds (27.4 m) de longueur et de deux pieds (0.61 m) de diamttre dans du pergklisol riche en glace au centre d'essais d'Inuvik de la Mackenzie Valley Pipe Line Research Limitee. On a fait circuler dans le tuyau de l'huile 160 "F (71 "C) de juillet 1971 a janvier 1972, ce qui provoqua la formation d'un bulbe de degel autour du pipe-line. On a dispose des instruments autour du pipe-line afin de mesurer la temperature, le tassement et la pression interstitielle. On a mesure les tempkratures prts de la surface du sol e t en profondeur au n~oyen de thermistors. On a verifie le tassement au moyen de jauges i semelle en spirale ("spiral foot gauge") et en mesurant les niveaux a la surface du sol et sur les barres soudkes au tuyau. On a mesure la pression interstitielle au moyen de piezometres actionnks au gaz et de type Casagrande. On examine la question du choix, de la fabrication et de l'installation de ces instruments.
In March 1971 Mackenzie Valley Pipe Line Research Limited decided to construct their second warm oil pipeline facility for testing under northern conditions. This line was to be buried in permafrost so that the results would complement previous studies of pipelines built on piles and in a gravel berm. The previously used site at Inuvik was suitable for the test because ice-rich permafrost was present and the terrain was flat. In addition, facilities to heat and circulate oil at any desired temperature were already present.
The main purpose of the test was to obtain data on how an ice-rich permafrost foundation would perform when a pipeline operating at 160 OF (71 OC) was buried in it. Following 1Presented at the 25th Canadian Geotechnical Con- ference, Ottawa, Canada. December 7-8, 1972.
discussions between Mackenzie Valley Pipe Line Research Limited and the Division of Building Research a joint project to instru- ment the foundation was undertaken. The parameters to be measured were temperature, settlement, and pore-water pressure. This paper reports on the design, fabrication, testing, and installation of the instrumen- tation.
Test Facility
The test facility is located on relatively flat terrain 2 miles north of Inuvik, Northwest Territories, approxi- mately 1 mile east of the east channel of the Mackenzie River. A typical soil profile at the site is as follows: moss and brown to black peat underlain by approximate- ly 6-10 ft (1.8-3.1 m) of brown clayey silt, then approxi- mately a 5-9 ft (1.5-2.7 m) layer of grey gravel and sand with 15-30% fines, and finally a layer of mainly grey fine-grained soil which extends to depths exceeding 30
228 C;\N. GEOTECH. J. VOL. 10. 1973
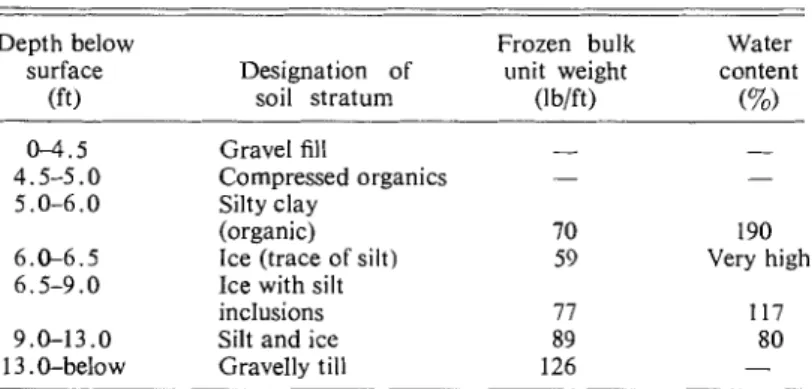
ft (9.2 m). A generalized soil profile with description of soil strata, frozen bulk unit weight, and water content is given in Table 1.
A gravel pad approximately 4 ft (1.2 m) in thickness and 50 ft (15.2 m) in width was on the permafrost at the location selected to bury the pipe. A backhoe was used t o dig a trench through the gravel pad and into the virgin soil to a depth of approximately 2 ft (0.6 m). The un- insulated pipe, 90 ft (27.4 m) in length and 2 ft (0.61 m) in diameter, was bedded on, and backfilled with, sand. The organic material and gravel fill were then replaced and levelled.
Risers welded to each end of the pipe were joined to a 6-in. (0.15 m) diameter line which was connected to the main tank of warm oil. This line was supported on temporary cribbing so that it could be lowered as the buried pipe settled when the permafrost thawed.
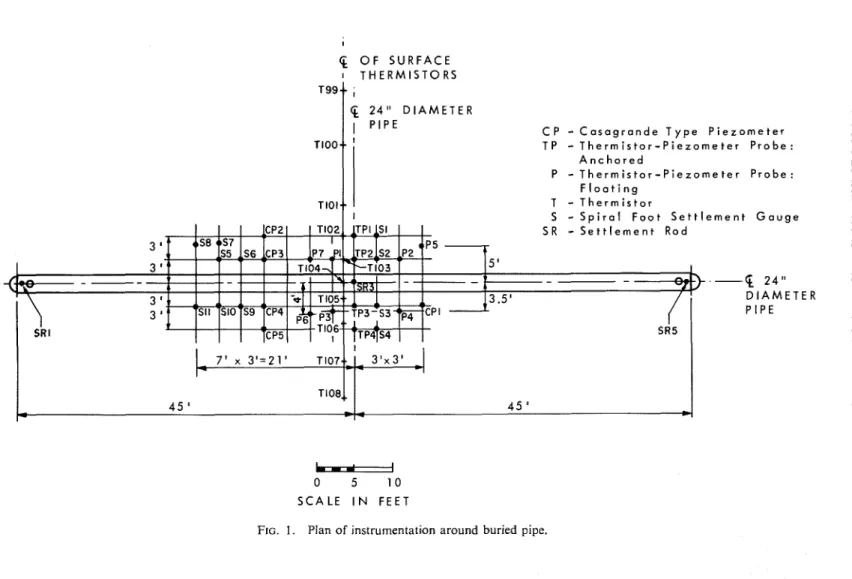
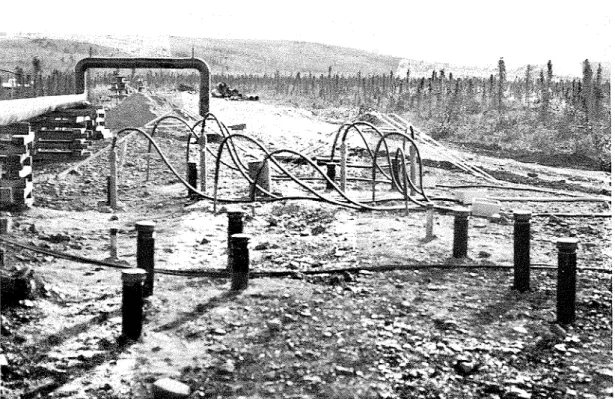
The central portion along the pipe was instrumented as shown in Fig. 1. Selection of the position of the ins- truments was made with reference to results of a computer program developed to predict the progression of the thaw front. In total 46 thermistors, 11 settlement gauges, 19 gas-operated piezometers, and six Casagrande-type piezometers were used in the intensively instrumented area. Figure 2 shows the test section after the instruments were installed but before the hot oil began to circulate through the pipe.
Oil at approximately 160 OF (71 OC) began circulating through the pipe on July 22, 1971. Baffle plates placed at both ends of the buried pipe induced turbulent flow and kept the temperature of the pipe uniform. Operation of the heat exchanger was interrupted on October 1, 1971 and the oil temperature dropped to approximately 38 "F (3.3 "C) by November 3, 1971 at which time oil at 160 " F (71 "C) was again circulated. Oil flow was terminated in January 1972 and freezeback occurred. The mean annual air temperature a t Inuvik is approximately 15 "F (-9.4 "C) and the amplitude of the annual variation in mean monthly air temperature is about 3 40 " F (f 22 "C). The initial temperature conditions (July 21, 1971) at the test site are given in Table 2.
Temperature
Although thermocouples and resistance-temperature devices (R.T.D.) were considered, thermistors were used to measure temperature because they could be integrated
easily into the existing system at the site. Atkins precision interchangeable thermistors (P99-3) were used and the data acquisition equipment was matched to the resis- tance characteristics of these thermistors s o that tempera- tures, in degrees Fahrenheit, were given directly on a digital readout. Temperatures were recorded twice a day with an accuracy of
+
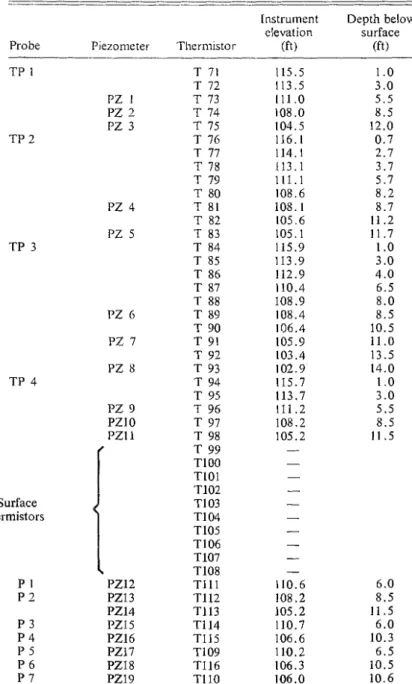
0 . 5 " F (i 0.28 "C).The thermistors were soldered to a two-wire shielded cable. Silicone rubber was applied t o the thermistor and ends of the leads, and shrinkable tubing approximately 3 in. (0.1 m) in length was placed over top for protection. As shown on Fig. 1 and in Table 3, 10 thermistors (T99-T108) were located a t the s u r f ~ e of the test section. They were anchored to the ground by a small metal wire placed over the lead about 2 in. (0.05 m) away from the thermistor. The thermistor and lead were covered with sand to a depth of approximately 1/16 in. (0.002m). The other thermistors were placed in the thermistor - piezometer probes (described later), with a thermistor adjacent to the tip of each gas-operated piezometer. Additional thermistors were placed along the probes; their depths below surface are given in Table 1.
Settlement
Spiral foot gauges were installed in the foundation to monitor settlement at several depths. A schematic drawing showing typical details of the gauges is given in Fig. 3. The gauges were similar to those used success- fully in the dykes a t the Kelsey Generating Station in Manitoba (Johnston 1965).
One-inch-diameter steel reinforcing bars were welded to the top of the buried pipe at both ends and the middle,
i.e. SRI, SR3, and SR5 as shown in Fig. 1. These bars were used as settlement rods t o determine the vertical movement of the pipe. Elevations were taken on top of the settlement gauges and rods every 2-4 days. Ground surface elevations were taken periodically and an exten- sive series of elevations was taken July 21, 1971, Sep- tember 1, 1971, and July 11, 1972.
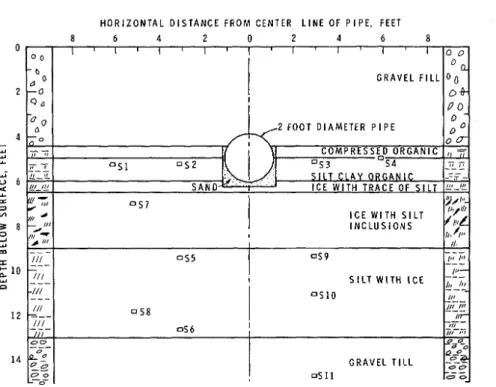
Figure 4 shows a cross-sectional view of the initial location of the gauges in relation t o the position of the pipe and layers of soil in a typical profile. Gauges S l , S2, S3, and S4 were installed just below the organic cover to monitor the settlement near the original ground surface. Three vertical arrays of gauges were used to obtain the settlement of the various soil layers. Array 1 (S7, S8) TABLE 1. Generalized soil profile at site
Depth below Frozen bulk Water
surface Designation of unit weight content
( ft ) soil stratum (lb/ft) (%)
0-4.5 Gravel fill
-
-4.5-5.0 Compressed organics - -
5.0-6.0 Silty clay
(organic) 70 190
6.CL6.5 Ice (trace of silt) 59 Very high
6.5-9.0 Ice with silt
inclusions 77 117
9.0-13.0 Silt and ice 89 80
$ O F S U R F A C E I T H E R M I S T O R S $ 2 4 " D I A M F T E R C P
-
C a s a g r a n d e T y p e P i e z o m e t e r T P-
T h e r m i s t o r - P i e z o m e t e r P r o b e : A n c h o r e d P-
T h e r m i s t o r - P i e z o m e t e r P r o b e : F l o a t i n g T-
T h e r m i s t o r S-
S p i r a l F o o t S e t t l e m e n t G a u g e SR-
S e t t l e m e n t R o d.-q
2 4 " D I A M E T E R P I P E-
0 5 1 0 S C A L E I N F E E TCAN. GEOTECH. J. VOL. 10. 1973
FIG. 2. Test section after installation of instruments.
TABLE 2. Initial temperature dis- tribution at site July 21, 1971
Depth below surface Temperature (ft) (OF) 0.04 (surface) I . o 3.0 5.5 8.5 11.5 13.5 14.0
was placed approximately 5.5 ft (1 .7 1n) from the center line of the pipe. Array 2 (S2, S5, S6) was placed 3 ft (0.9 m) from the center line of the pipe on the same side as array 1. Array 3 (S3, S9, S10, S11) was placed approxi- mately 3 ft (0.9 m) from the center line of the pipe on the side opposite array No. 2.
Pore-water Pressure
Piezometers were installed to determine whether excess pore pressures were generated when the ice-rich permafrost melted. Thaw- ing around the pipe was expected t o occur rapidly with subsequent settlement of the
foundation. The experiment was scheduled to stop after the thaw front had penetrated into the gravelly material, which was a t a depth of 13 ft (4 m). It was known, therefore, that large pore pressures would not be present during thawing. Literature on methods of monitoring pore pressures under these conditions was not available so a program was initiated to select, develop, and test instrumentation for this application, subject to five general guidelines.
1 . Pore-water pressures were to be mea- sured at the thaw front (i.e. as the 32 "F (0 " C ) isotherm passed by the piezometer tip) as well as within the thaw bulb. This meant that the piezometers had to be installed in holes in the permafrost and that they must not be damaged during subsequent freezeback. It was desirable to be able to measure these pressures with an accuracy of f 0 . 5 ft ( h 0 . 1 5 m) of water or better because of the small pressures involved.
2. The elevation of the piezometer tips was to be known at all times because the foundation was expected to settle more than
SLUSARCHUK ET .\L.: INSTRUMENT:\TION AROUND \VARM OIL PIPELINE 23 1
3. The level of the water table across equipment had to mesh with laboratory
and along the thaw bulb was to be measured testing and installation deadlines. The test
so that the amount of excess pore pressure, loop was scheduled to be in operation by
if any, could be determined. the middle of July 1971.
4. The piezometer was to be durable selection oj-piezon,etel.s
under Arctic conditions. It was difficult to select the piezometer
5. The availability and delivery date because of the limited information on mea-
of the piezometers and the associated readout surement of pore pressures in thawing perma-
TABLE 3. Elevation of piezometers and thermistors
Instrument Depth below elevation surface
Probe Piezomete~. Thermistor (ft) (ft)
Surface thermistors T 71 T 72 T 73 T 74 T 75 T 76 T 77 T 78 T 79 T 80 T 81 T 82 T 83 T 84 T 85 T 86 T 87 T 88 T 89 T 90 T 91 T 92 T 93 T 94 T 95 T 96 T 97 T 98 T 99 TI00 TlOl T102 TI03 TI04 T105 TI06 TI07 TI08 T l l l T112 T113 T114 TI15 T109 TI16 TI 10
232 CAN. GEOTECI-I. J. VOI,. 10, 1973
frost. With regard to the guidelines the fol- lowing types of piezometers were considered.
Standpipe Type
This consists of a buried porous tip con- nected to the surface by a small diameter pipe, (Casagrande 1949). This type has
the following advantages : simple design,
gauge house not required, and proven use for more than 25 years. Its disadvantages are: a slow response time, possible errors due to the introduction of air, inability to record negative pressures, and need for an antifreeze fluid in Arctic conditions.
Closed Hydraulic Systetv
This system was developed to overcome accuracy problems associated with air in- trusion and to shorten the response time com- pared with the open tube piezometer (Daehn
1962; Bishop et al. 1964). Its advantages
are: rapid response if air-free, ability to record negative pressures, and allows de-airing of the piezometer tip. The following are the disadvantages: requires a heated gauge house, sensitive to the elevation of the gauge house (particularly for low or negative pore pressures), fragile and thus sensitive
T O P O F P L A S T I C E L E V A T I S A N D B A C K F I L L A N N U L A R SPACE BETWEE R O D A N D P L A S T I C C A S I F I L L E D W I T H SAE # 9 0 S P I R A L F O O T E L E V A T I O N INSTALLATION N O . TOP OF ROD ROD LENGTH S 1 52 53 54 55 56 57 S8 59 510 S l l SPIRAL FOOT EL. 111.79 112.24 112.32 112.54 107.74 104.92 110.06 1 05.58 107.78 106.11 102.53 TOP O F PLASTIC EL. O F R O D E L E V A T I O N G R O U N D E L E V A T I O N I A . x 4 ' STEEL PROTECT C/W C A P . I A . D R I L L H O L E ' O M O F P L A S T I C N G E L E V . LENGTH 0 F PLASTIC 6 0 TTO M O F PLASTIC ELEV. 112.55 112.75 112.87 113.01 108.37 105.40 110.58 106.14 108.57 106.73 1 03.09 GROUND E LEV. 116.37 116.62 116.79 116.82 116.71 116.63 116.67 116.44 116.79 116.59 116.51
SLUSARCHUK ET AL.: ISSTRUMENTATION AROUND WARM OIL PIPELINE H O R I Z O N T A L D I S T A N C E F R O M CENTER L I N E OF P I P E , FEET 8 6 4 2 0 2 4 6 8 0 0
l
l ~ l ' l ' ~ ' l ~ l ' l ~ ~ o ~ o G R A V E L F I L L 0 0153
FIG. 4. Cross-sectional view of original position of settlement gauges.
to Arctic conditions, and requires an anti- of the diaphragm. Its advantages are: a
freeze liquid for circulation in the hydraulic rapid response time, the recorder level
system. independent of the tip level, generally less
expensive than the electrical type, and elabora-
Electrical Diaphragm Instruments
In the majority of these instruments, te instrument house not required.
the pore pressure against a thin metal dia- None of the piezometers considered could
phragm is measured electrically by means meet the criterion of immediate response
of strain gauges, vibratory wire gauges, upon thawing and still be able to withstand
o r piezoelectric crystals (Terzaghi 1943; Plan- the freezeback of the backfill in the bore
tema 1953; Muhs 1954). hole around it. T o overcome this problem
These gauges have the advantage of almost the tip of the piezometer was housed in a
instantaneous response and do not require compartment that was filled with a solution
fluid in the system and, therefore, are (ethylene glycol) that would not freeze
not as susceptible to Arctic conditions. In at the lowest temperatures of the local per-
general, their main disadvantage is caused mafrost. Continuity of the fluid phase between
by errors that may arise due to calibration the compartment and the soil had to be
drift. maintained.
The piezometer selected for the basic
Pneumatic and Hydraulic Instruments system was the P1020 pneumatic piezometer
This type of piezometer has been developed manufactured by Terra Tec. It functions
within the past few years in America (Warlam by the application of gas (nitrogen) pressure
and Thomas 1965) and in Europe (Lauffer through a closed loop system to balance
and Schober 1964). This instrument operates the pore pressure acting on the sensing
by balancing the pore pressure on the so11 element. This element consists of a single
side of the diaphragm with a known fluid bellows assembly which is sensitive to small
pressure which may be supplied by gas or displacements so that response time is mini-
234 CAN. GEOTECN. J. VOL. 10, 1973
It was decided to use this type of piezometer for the following reasons:
1. It had been used successfully in frozen dyke foundations in northern Manitoba (Gup- ta and Marshall 1972);
2. Manufacturers' specifications indicated that it was possible to measure small pressure heads with this type of piezometer;
3. The tip or sensing unit was small and therefore convenient for use in a multiple assembly;
4. A tip which had a preload was avail- able, thus allowing the monitoring of negative pore pressures; and
5. This type of instrument, complete
with readout equipment, was available on short notice. This allowed time to run a laboratory testing program prior to in- stallation.
Casagrande-type piezometers were selected for monitoring the level of the water table. A few gas-operated piezometers and three wells were also used to determine the position of the water table across and along the buried pipe.
Elevation Control of Piezometers
As mentioned previously, elevation control of piezometers at all times was essential. The methods that were considered to accomplish this were :
1. The use of a 'network' of settlement gauges to give contoured settlement;
2. The use of rigid rods attached to
instrument assemblies extending to the
surface and thereby allowing direct elevation
measurements ; and
3. The use of long rigid instrument probes founded in the permafrost below the depth of the thaw bulb.
Each of these .methods had limitations which were recognized but their full im- plications were unknown. The 'interpolation' method using settlement gauges was not considered to be sufficiently accurate as a basic system to monitor the settlement of the other instruments. It would also lead to considerable expense for drilling and installation. Thermal disturbance was also a possibility.
The use of rigid rods attached to each instrument assembly appeared attractive ex- cept that again there would be a large number
of holes with the associated higher cost and possible thermal disturbance. In addition, the analysis would be complicated by having the piezometer tips settling throughout the experiment.
The third method of using rigid instrument probes founded beneath the thaw bulb in the frozen gravel had the advantage of main- taining a fixed-grid at known elevations and, in addition, several instrument units could be mounted within the one assembly at varying depths thus reducing the number of holes required. This system had the dis- advantage of having an unknown amount of frictional down drag on the probes as the foundation thawed and settled.
In view of the problems associated with all of these methods, it was decided that the rigid instrument probes would be used with a limited number of instruments utilizing the other systems as back-up.
T o meet the requirements of sturdiness and constant known elevation, it was ne- cessary to develop a probe that would have not only a high degree of reliability and precision, but also be sufficiently durable to withstand large ground settlements around it. The design developed for the thermistor- piezometer probes allowed a number of pressure and temperature sensors to be housed in a tough, protective cover. This cover was sufficiently rigid to maintain instruments at constant elevations with the probe base fixed in the frozen strata below. Materials with a low thermal conductivity were used for these probes to minimize disturbance of the temperature regime around the pipe.
Basic Piezonieter Unit
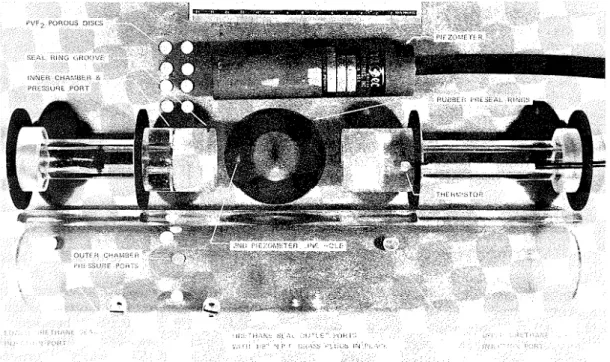
The basic piezometer unit consisted of a gas-operated sensing element, a com- partment in which to house the element, and a port through the wall of the compartment.
A thermistor was positioned adjacent to
the sensing element to measure its tem-
perature. Figures 5 and show 6 the basic
unit unassembled, and partially assembled. The design of the ports was given con- siderable attention because it was necessary that the compartment be kept saturated prior to, during, and after installation of the assembly in a bore hole to ensure a <hard' pres-
SLUSARCI-IUK E T .\L.: INSTRUMENT:\TION .\ROUND \\'ARM 011, P I P E L I N E 235
sure system so that a rapid response would be was investigated. It was quickly abandoned,
obtained as the permafrost thawed. however, because any tilting or jarring al-
A series of small holes, 0 . 0 1 in. (0.003m) lowed the fluid to drain out of the com-
in diameter drilled at one level around the partment even though no drainage occurred
compartment was a possible solution that if the unit was maintained in a fixed up-
FIG. 5. Basic piezometer unit unassembled.
236 CAN. GEOTECH.
right position. Next a series of 114 in. (0.006m) diameter holes was drilled in the wall and 1/16 in. (0.002m) thick porous discs were inserted into these holes. When the hydrostatic head was small (several inches) no drainage occurred. The porous plastic material had an average pore size of 25 p m with a porosity of approximately 80%. In the final design the ports were located at the top of the compartment so that the average head on the discs was only 118 in. (0.003m). The center of these discs was located at the same level as the bottom of the bellows assembly of the sensing element.
The geometrical configuration of the com- Dartment was greatly influenced by the proposed fabrication techniques and strength requirements of the multiple unit probes. The outside of the compartment (outer casing) consisted of a 2.5 in. (0.06m) diameter, schedule 40, P.V.C. pipe (poly- vinylchloride). An inner core consisting of a 1 in. (0.025 m) diameter, schedule 80, P.V.C. pipe formed a compartment within the compartment. The walls of this inner compartment had small diameter holes in them so that the inner and outer spaces were joined together. This inner core was required because it acted as a central mandrel to which the various components of the unit could be secured and then slipped into the outer casing during fabrication. The top and bottom of the compartment were formed by casting urethane rubber in place between rubber sealers. The compartment was filled with a water and glycol mixture by first evacuating it with a vacuum pump and then sucking in the mixture by releasing the vacuum.
A full-scale model (Fig. 6) was built to test techniques for assembly, evacuation, and saturation as well as to evaluate the performance of the instrument. All sections that were t o be constructed of P.V.C. were made from clear acrylic plastic t o allow visual inspection. This model led t o many improvements in design and fabrication details of the field units.
Thermistor-Piesometer Probes
The multiple thermistor-piezometer probes formed the main pore pressure monitoring system and were anchored at depth in the
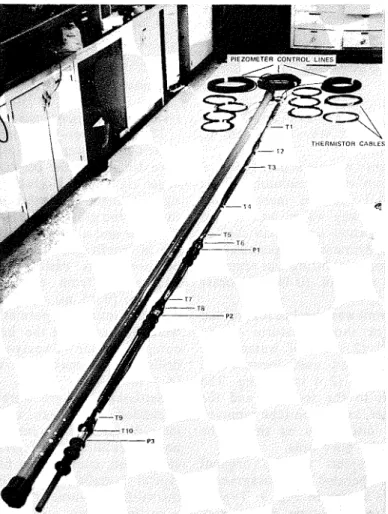
gravelly permafrost. They consisted of two or three basic piezometer units housed together with the piezometer tips approx- imately 3 ft (0.9m) apart. The compartments housing each tip were sealed off from each other by urethane rubber plugs which were cast in place. A three-piezometer probe
is shown in Fig. 7.
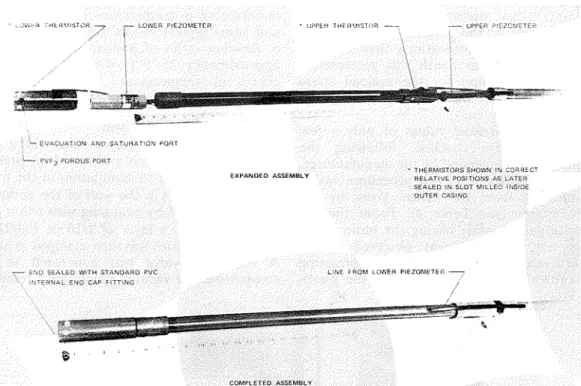
A few thermistor-piezometer probes were not anchored at depth but 'floated' with the settling ground. This back-up system consisted of a piezometer at the base of a rigid plastic tube which extended above the surface of the ground. This tube was used for elevation measurements but it also protected the pi- ezometer and thermistor leads. Figure 8 shows the components of the probe.
Laboratory Testing Program
The basic piezometer unit model was tested in the laboratory t o check its response to known applied pressures. In order to simulate bore hole conditions the model
unit was mounted in a chamber designed u
for testing fluid displacement properties of oil and gas reservoir rock. A space slightly in excess of 112 in. (0.01m) between the model and a sleeve was filled with a mixture of water and glycol. Sand was then dropped into this mixture and tamped. Each end was sealed off with a bentonite ~ l u e I U and end caps. The system was connected to an accurate variable pressure source and tested at pressures from 0 to 30 ft (0 to 9 . 2 m) of water. Pressures were applied in increments of 5 ft ( 1 . 5 m) of water increasing t o the maximum pressure and then decreasing t o atmos~heric. This ~ r o c e d u r e was carried out &ice and then'some random pressure increments were applied. In all cases the unit responded immediately to the changes in pressure; the pressures given by the pie- zometer gauge readout equipment agreed well with the changes in the applied stress. This indicated that the general design, fa- brication, evacuation, and saturation tech- niques were adequate to provide a 'hard' system in the basic piezometer unit.
Because of the manufacturer's mode of fabrication, there was an initial preload stress on the bellows of the model P1020 piezometers. This value had t o be subtracted from the number shown on the piezometer
SLUSARCHUK ET AL.: I N S T R U M E N T A T I O N AROUND WARM O I L PIPELINE 2 37 gauge readout to obtain the actual pore-water
pressure. It was necessary therefore to have reliable values of the preload stress for each piezometer. The specifications that the ma- nufacturer forwarded with the piezometers gave constant values for the preload stress and indicated that the accuracy was +O. 15 p.s.i. (&0.01 kg/cm2).
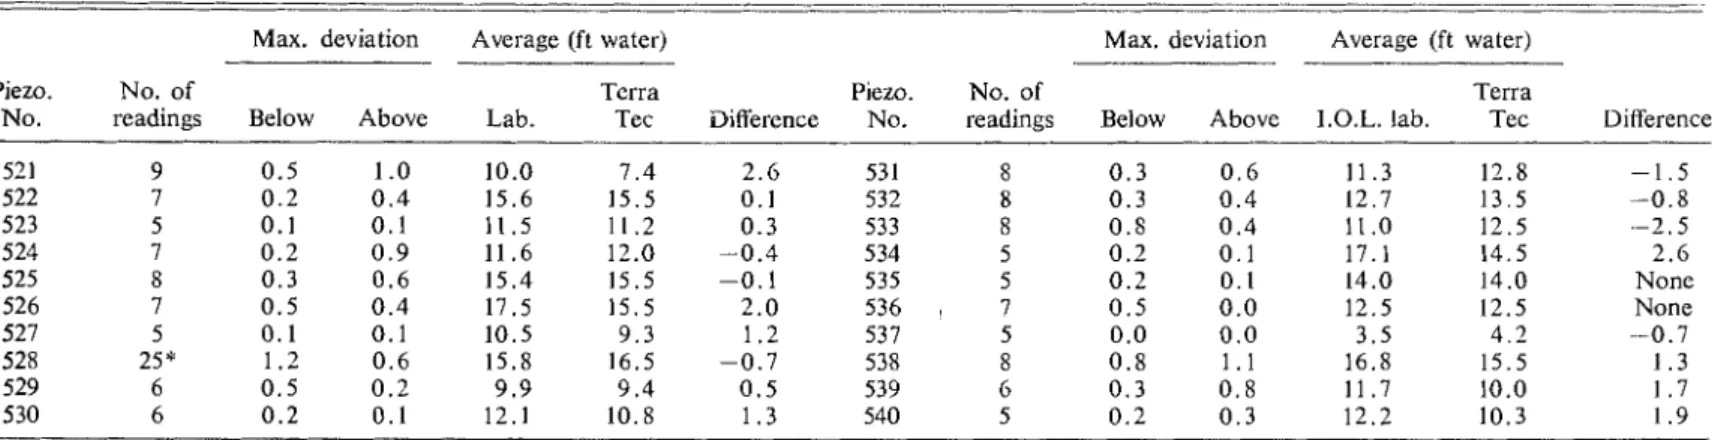
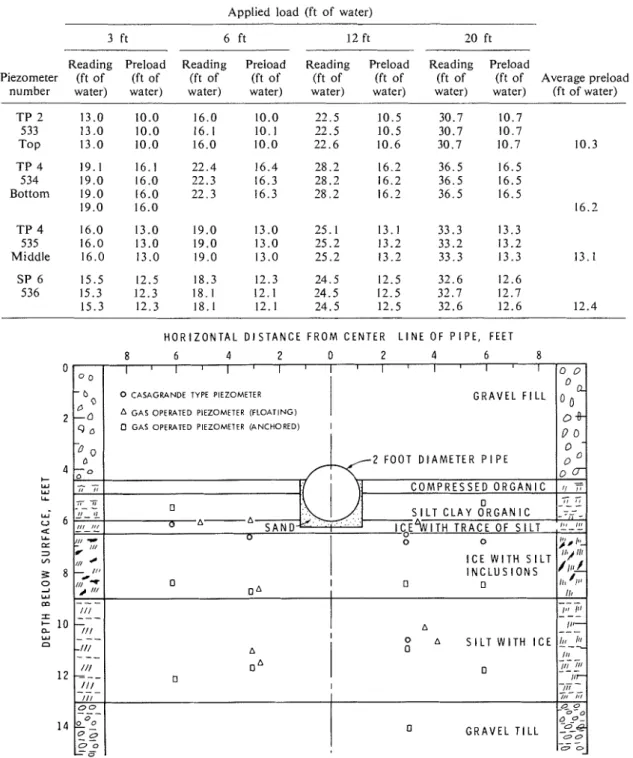
At first the preload values of only a few piezometers were checked, following the procedure recommended by the manufacturer. The values obtained by this procedure varied considerably from the values given by the manufacturer (see Table 4). From the ex- perience gained while testing the basic piezo- meter unit model it was observed that a preload value could be obtained by subtracting the known applied pressure from the piezo-
meter reading. This procedure was followed maintaining a temperature of 75 OF (24 "C) and some typical results are shown in Table 5. Another series of preload tests was run at approximately 25 O F (-4 "C) to observe the
effects of temperature. Some temperature dependence was present in all piezometers.
Field Preparation of Probes
Each piezometer unit was filled with a mix- ture of water and glycol and tested for preload pressure just prior to installation in the foun- dation. The ports in the wall of the compart- ment were sealed by wrapping with teflon pipe thread tape and a layer of 1/16 in. (0.002 m) butyl rubber, which was then clamped in place. A three-way valve was connected to the compartment, a vacuum pump and a reservoir
238 CAN. GEOTECH. J. VOL. 10, 1973
FIG. 8. Modified single piezorneter probe. filled with a mixture of water and glycol.
A vacuum manometer was connected to the vacuum system.
The compartment was evacuated for a minimum of 15 min and a vacuum of less than 0.004 in. (0.1 mm) of mercury was obtained. The three-way valve was turned and the mixture of water and glycol rapidly saturated the compartment and porous disc ports. The saturation port fitting was removed and replaced with a 118 in. (0.003 m) brass plug.
The piezometer unit was checked for preload pressure at two or three pressures up to
approximately 7 ft (2.1 m) of water. This
was the maximum head used because the workshop had an 8 ft (2.4 m) ceiling. The probes were taken to the test site and the clamps, butyl rubber, and teflon tape removed from the porous disc ports as the probe was inserted into the bore hole.
A cross-sectional view of the original position of the gas-operated and Casagrande- type piezometers is shown in Fig. 9. Typical details of the Casagrande-type piezometers are shown in Fig. 10.
Installation of Instrun~ents
The thermistor-piezometer probes and sett- lement gauges were installed in bore holes that were drilled into the permafrost by a Texoma auger rig and a Nodwell Mounted Mayhew rig. An auger was used to drill a pilot hole through the gravel pad and compressed orga- nic layer and a 10 in. (0.25 m) casing 5 ft (1.5 m) in length was installed and rotated into position. This casing was to stop water and gravel from entering the boring. A 5.75 in. (0.15 m) diameter bit was utilized to drill into the permafrost. The cuttings were flushed from the hole by injections of compressed air. Twenty-seven borings were drilled to a maximum depth of 15.5 ft (4.7 m).
Settlement gauges were set in place and backfilled with clean sand (Fig.3). Therm- istor-piezometer probes were set in place and backfilled in layers with bentonite, clean sand, and random fill. Figure 11 shows typical installation details of two of the thermistor-piezometer probes.
In backfilling around the thermistor-pi- zeometer probes a precooled mixture of
4 3 0
-
c 7;TABLE 4. Results of preload pressure. Tests at atmospheric pressure
5
Max. deviation Average (ft water) Max. deviation Average (ft water)
5
-
Z
Piezo. No. of Terra Piezo. No. of Terra in
ci
No. readings Below Above Lab. Tec Difference No. readings Below Above 1.O.L. lab. Tec Difference
$
z
521 9 0.5 1 .O 10.0 7 . 4 2.6 53 1 8 0 . 3 0 . 6 11.3 12.8 -1.5"
522 7 0 . 2 0 . 4 15.6 15.5 0.1 532 8 0.3 0 . 4 12.7 13.5 -0.8 $ 523 5 0.1 0 . 1 11.5 11.2 0.3 533 8 0.8 0 . 4 11 .O 12.5 --2.5 -+ 4 524 7 0.2 0 . 9 11.6 12.0 -0.4 534 5 0 . 2 0 . 1 17.1 14.5 2.6 525 8 0.3 0 . 6 15.4 15.5 -0.1 535 5 0 . 2 0.1 14.0 14.0 None 526 7 0.5 0 . 4 17.5 15.5 2.0 536 , 7 0 . 5 0 . 0 12.5 12.5 None $ 527 5 0 . 1 0.1 10.5 9.3 1.2 537 5 0 . 0 0 . 0 3.5 4.2 -0.72
528 25' 1.2 0 . 6 15.8 16.5 -0.7 538 8 0.8 1.1 16.8 15.5 1.3z
529 6 0 . 5 0 . 2 9 . 9 9 . 4 0.5 539 6 0.3 0 . 8 11.7 10.0 1.7 530 6 0.2 0 . 1 12.1 10.8 1.3 540 5 0 . 2 0.3 12.2 10.3 1.95
F *Readings taken a t differelit hours ovcr a period of 3 days. gP
h2
-
0
240 CAN. GEOTECI-I. J. VOL. 10, 1973
glycol and water (freezing temperature of the hole around the probe and tamped
10 "F ( -12 "C)) was first poured into the in layers approximately 6 in. (0.15 m) thick
bottom of the hole. Sand was poured down with a 1
x
2 in. (0.025 x 0.051 m) woodenTABLE 5. Typical laboratory preload pressure test results
Applied load (ft o f water)
Reading Preload Reading Preload Reading Preload Reading Preload
Piezometer (ft of (ft of (ft of (ft o f (ft of (ft of (ft of (ft of Average preload
number water) water) water) water) water) water) water) water) (ft of water)
TP 4 534 Bottom TP 4 535 Middle
HORIZONTAL DISTANCE FROM C E N T E R LINE O F PIPE, F E E T
FIG. 9. Cross-sectional view of original position o f piezometers.
0 0 0 o o a
o+-
0 0 0 - 0 0 0 G- 11 F-
,,-
I , - - - - 7 , ~ - ?-I! .TI;
;;T ' / l t L 11, ' 1 1 1 l b ---
I , , ((1 - - - I!'- --- Ill - - - - - - III Ill l I C -- - 111 - - - I,, ,!, 0 0 0 0 0 9 -2-z
---
0 0 - 8 6 4 2 0 2 4 6 8 I , I I I I I I G R A V E L FILL I 2 F O O T DIAMETER PIPE 0 + 6 4 Y 3 tJ7 zz 8 0 2 w 1 0 w a 1 2 1 4 0 0 - b QbO
-
0 0 a I 1 1 ' I ' I '0 CASAGRANDE TYPE PIEZOMETER A GAS OPERATED PIEZOMETER (FLOATING)
0 GAS OPERATED PIEZOMETER (ANCHORED)
470 7 ; ; - - ,, ,, - - - ,:,-,: - - - Ill
-
-
I IN , / I 4--
I" / / I T,
/I/ - - - / I /z--
I / / - - - -IN - -- /N---
111 - - - / I / 0 0 --- %*2-
0 - 0 - - 0 7 0 ... COMPRESSED ORGANIC 0<Ti
. . SILT C L A Y ORGANIC 0 A-A S A N D , ' . .c...' ISE%ITH T R A C E O F S I L T 0 0 0 A 0 0 ICE WITH SlLT INCLUSIONS I 0 0 A Ai
O A SILTWITHICE'.-!!- 0 0 A 0 0 0 GRAVEL TILLSLUSARCHUK ET AL.: INSTRUMENTATION AROUND \V..\RM 011, PIPELINE 241 staff. The sand pack was placed so that
9 in. (0.23 m) of sand was on each side of the tip of the piezometer. Bentonite had been previously wetted with water and rolled into balls about 1 in. (0.025 m) in diameter. These balls were dropped down the hole one by one and continuously tamped to form a seal approximately 1-1.5 ft (0.30- 0.46 m) thick above the sand pack. As shown in Fig. 11 this sequence was repeated so that each piezometer in the probe had a sand pack around it and a bentonite seal above it.
The thermistor and piezometer leads coming out of the top of the probes were placed in flexible metal tubes for protection. These tubes were secured t o the top of the probes and ran to a small heated instrument shack located adjacent to the test section. The pi- ezometer leads were attached to a board inside the shack for convenience during testing. The thermistor leads entered a junction box that was connected to the data acquisition equipment located in the main instrument trailer. G R O U N D C L E A N SA G L Y C O L T O P O F TUBE E L E V A T I O N S U R F A C E E L E V A T I O N 0 . 0 ' 2 " D I A . x 4 ' P R O T E C T I V E STEEL PIPE R A N D O M B A C K F I L L B E N T O N I T E S E A L N D S A T U R A T E D W I T H 8 " C A S A G R A N D E P I E Z O M E T I P ( D O U B L E T U B E ) T I P E L E V A T I O N I N S T A L L A T I O N N U M B E R D A T E 15 JULY 1971 1200 13 JULY 1971 1630 13 JULY 1971 1700 14 JULY 1971 1500 14 JULY 1971 1600 FIG. 10. E L E V A T I O N S T O P O F G R O U N D TUBE S U R F A C E Casagrande-type piezometers. T I P B E N T 0 N ITE S E A L
242 CAN. GEOTECH. J. VOL. 10, 1973
Discussion to determine when the thaw front passed
Temperature
The performance of the thermistors was excellent. They were sturdy and reliable as evidenced by the fact that all of them worked throughout the testing period., The ac- curacy of the temperature measurements was considered to be adequate for this type of study.
Additional thermistors in the instrumen- tation area would have proved helpful in establishing more accurately the position of the thaw bulb, particularly the sides. Thermistors could also have been positioned adjacent to the foot of the settlement gauges
by, instead of having to interpolate- from temperature points located several feet away.
Sett/e/??en t
The experience gained in the use of spiral foot settlement gauges in other projects in permafrost proved very helpful in ensuring that the performance of the gauges was satisfactory. One problem which arose that had not been previously mentioned in the literature was that of bowing of the rods and the plastic tubes around them. This was due to the two-dimensional aspect of the thaw bulb in that movement did not occur only in the vertical direction, but
-TOP O F COUPLING
-
TOP O F COUPLING ELEVATION 119.06 ELEVATION 119.02GROUND SURFACE GROUND S1 ELEVATION 116.88 E LEVAT I0 N RANDOM BACKFILL BENTONITE SEAL CLEAN SAND BENTONITE SEAL PIEZOMETER CLEAN SAND CLEAN SAND BENTONITE SEAL CLEAN SAND BENTONITE SEAL JRFACE 116.74 T P - 3 T P - 4
SLUSARCHUK ET AL.: INSTRUMENTATION AROUND \\'ARM OIL PIPELINE 243
the material tended to slough in towards rapid increase in pore pressure at each piezo-
the buried pipe as well. The bowing caused meter was associated with the presence of the some difficulties because it had to be con- thaw front (Fig. 12). Because of the different
sidered in the analysis of the settlement rates of advance of the thaw front relative
data (Watson et 01. 1973). The settlement to the piezometers the pore pressures generally
rods welded to the top of the buried pipe reached their maximum value during a
did not bow during settlement. period of 1-7 days (Watson et 01. 1973).
Pore Pressure
Nineteen units were placed in the foun- dation and only one unit did not function properly. This unit was at the top of a multiple thermistor-piezometer probe and was located in an area where excessive settlement took place. The piezometer recorded large negative pressures for approximately the first 2 months even though the water table was above it during this time. The unit started to give more reasonable data in October and con- tinued to d o so for the remainder of the test. The thawing front moved by the various piezometers at different rates. It moved quickly past the piezometers located near the pipe and relatively quickly past those at depth close to the center line of the pipe. The piezometers at the edges of the thaw bulb thawed out slowly. I n all cases, however, the
- It is estimated that the accuracy of the pore-water pressure measurements was ap- proximately
3
1 . 0 ft ( 0 . 3 m) of watereven though it was planned to be measured to an accuracy of 0 . 3 ft ( 1 0 . 0 9 m) of water. The main reason for this was the difficulty associated with determining the preload pressure o n each tip for this type of piezometer.
Three methods were used in an attempt to achieve elevation control of the piezom-
eters: (1) contoured settlements determined
by the spiral foot gauges; (2) 'floating' piezometers that settled with the thawing foundation; and (3) piezometer probes an- chored at depth in the permafrost. The contoured settlement method was not suc- cessful because the variability of the ice content of the permafrost was such that
HOT OIL FLOW M a i n Pump
4
HY;oYihDFLOW4
STARTED Our o f Ordery 15 ; 1 0 - LL 2 5 - C 1 0 Y -5
-
5 u-
-
-
+ -10JULY A U G U S T SEPTEMBER OCTOBER NOVEMBER DECEMBER
244 C.-IN. GEOTECII. J . VOL. 10. 1973
interpolation from the settlement gauges of the water table in the wells was measured to the piezometers could not be done easily by taking an elevation to top of the water. or with reasonable accuracy. The floating
piezometer method suffered because the Conclusion
datum tubes coming t o the surface bowed
during the test. I n addition it was difficult The number, position, and performance
to analyze the data because consideration of the temperature and settlement instruments
always had to be given to the relative positions were generally adequate for the purposes
of the piezometers and the water table, of this experiment. Additional temperature
both of which were moving. The anchored points located at the edges of the thaw
piezometers appeared to give the most bulb and at the foot of the settlement gauges,
reliable information. however, would have been helpful. Some
The use of multiple thermistor-piezometer problem in interpretation of the settlement
probes had an advantage over a number data arose because of the bowing of lhe
of single unit probes as the distance between rods. This problem be
piezometers in a probe was accurately known. Overconle if at be
This permitted the calculation of a hydraulic obtained without the use of rods leading to the
between any two pielometers with surface. This is not easily done without
an accuracy of the same order as that of introducing other
the pressure measurements. This calculation The general design philosophy of the
could be done very simply and without basic piezometer unit proved to be adequate
knowledge of the amount of settlement for the conditions encountered. The pie-
at any point or the level of the water table. 'Orneters quickly when the thaw
When the probes were installed, the sand front passed and continued to perform
pack around each piezometer was saturated for the duration of the test. Loss of data
with a mixture of water and glycol. This d u e malfunctioning O r breakage was
was done to prevent large pressures from very limited. The basic piezometer unit
developing around the pielometer during the sing1e O r
freezeback. This was satisfactorily accom- thermistor-piezometer probes. It is recognized
~ l i s h e d for all installations except the first. that additional research is required to improve the accuracy of preload values for these I n this case '''Page '"0 the bore '0" from
piezometers if more precise pore pressures
the unfrozen surface organic layer was not are needed.
control1ed "le and Elevation control of the piezometers in
the bottom of the hole was filled with water.
t h e thawing was critical because
freezeback the pressure around the o f the large settlements. The contoured
piezometer increased Over a period of I settlement profiles proved to be inadequate.
from ft m, of The 'floating' probe system was better but
water 5 6 a 8 ft (17.3 m) of water- On the not as satisfactory as the 'anchored' probes.
the Pressure was greater than The anchored probe design is compatible
the upper limit the gauge. On with the use of more than one piezometer
the third day after installation the pressure per probe.
was back t o ft (I . 2 nl) The multiple probe concept has some advan-
of water (Fig. 12). tages over the single unit design. The l~ydraulic
The level of the water table was measured gradient between any two units on a probe
with Casagrande-t~pe piezometers and water can be obtained without knowledge of sett-
wells. Six Casagrande-type piezometers were lement or location of the water table. The
placed in the foundation and only one did relative position between units is fixed and
not operate satisfactorily. This one was accurately known. In addition, fewer holes
placed much lower into the permafrost need to be drilled during installation to
than the others. For these piezometers to obtain equivalent instrument density, and
work the tip and the standpipe had to be therefore thermal disturbance and installation
'ION :\ROUND \VARM OIL PIPELINE 245 Acknowledgments
The authors are grateful for the interest and assistance of their colleagues throughout this project, in particular Mr.R.K. Rowley, Mackenzie Valley Pipe Line Research Li- mited, and Dr. L.W. Gold, Division of Building Research, National Research Council OF Canada.
The instrumentation was fabr~cated at the Production Research and Technical Ser- vices Laboratory, Imperial Oil Limited, Cal- gary. The special assistance provided by
Dr. R.C. Auld and Mr. M.P. Cullen is
gratefully acknowledged.
This paper is a joint c o n ~ i l b ~ ~ t i c n of the Division of Building Research, National Research Council of Canada, and Mackenzie Valley Pipe Line Research Limited and is published with the approval of the Director of the Division and the Research Coordinator of Mackenzie Valley Pipe Line Research Limited.
BISHOP, A. W., KENNARD, M. F., and VAUGHAN, P. R. 1964. Developments in tlic nieasurement and inter- pretation of pore pressures in eartli dams. Trans. 8th Int. Congr. Large Dams, 2, pp. 47-72.
CASAGIIANDE, A. 1949. Non-metallic piezometcr Tor mea- suring pore pressures in clay. Appenn'i.~ to Soil mech-
anics in design and construction of Logan Airport. J . Boston Soc. Civ. Eng. 36(2), pp. 214-221. DAEHN, W. W. 1962. Development and installation of
piezomete1.s for the measurement of pore-fluid pres- sures in earth darns. Field testing of soils. Am. Soc. Test. Mater., S.T.P. 322, pp. 8-17.
GUPTA, R. C., and MARSHALL, R . G . 1972. Kettle Generating Station - earthwork instrumentation. Presented at the 25th Can. Geotech. Conf., Ottawa, Canada. Dec. 7-8, 1972.
.IoI-INSTON, G. H. 1965. Permafrost studies at Kelsey IHydro-Electric Generating Station; Research and instrumentation. Natl. Res. Counc. Can. Publ. No. 7943.
LIUFFER, H., and SCHOBER, W. 1964. The Gepatsch Rockfill Dam in the Kauner Valley. Trans. 8th Int. Congr. Largc Dams, 3. 635-659.
MUI-IS, H. 1954. Meas~~rement of pore-water pressure in open ground particularly in carth dams. B~LI-Masch. Balltech. 7, pp. 65-70.
P L A X ~ E M A , Ci. 1953. Electrical pore water pressure cells:
some designs and experiences. Third Int. Conf. Soil Mech. Found. Eng. I, pp. 279-282.
TERZAGHI, I<. 1943. Measurement of pore-water pressure in silt and clay. Civ. Eng. 13, pp. 33-36.
WARLAM, A. A,, and THOMAS, E. W. 1965. Measurement of hydrostatic uplift pressure on spillway weir with air piezonicters. Instruments and apparatus for soil and rock mechanics. Am. Soc. Test. Mater., S.T.P. 392, pp. 143-151.
WATSON, C . H., ROWLEY, R. K., and SLUSARCHUK, W. A. 1973. Performance of a warm oil pipeline buried in perniafrost. T o be presented at the 2nd Int. Conf. I'ermafrost, Yak~rtsk, U.S.S.R.