The Auroral Ionosphere:
Comparison
of a Time-Dependent
Model With Composition Measurements
J.-C. GERARD x AND D. W. RUSCH 9'
Space Physics Research Laboratory, Department of Atmospheric and Oceanic Science
University of Michigan, Ann Arbor, Michigan 48109
A time-dependent model of the auroral ionosphere including the odd nitrogen species, NO, N(2D), and NOS), is used for comparison with data from a coordinated rocket-satellite measurement of an auroral
event. The chemical scheme and the adopted rate coefficients have been shown to be compatible with daytime mid-latitude ionospheric chemistry. The electron flux and neutral atmospheric parameters
measured on the satellite are used to compute the appropriate ionization and dissociation rates. The
calculated NO +, 02 +, O +, Ne, and NO densities agree well with the rocket measurements. The calculated N2 + densities are larger than the measured densities by a factor of 3 at most altitudes. The calculations
show that the nitric oxide content of the aurora (•1.2 X l0 • NO molecules/cm 3 at 105 km) is below the
saturation value.
INTRODUCTION
During the last decade, several measurements of the compo- sition of the auroral ionosphere have been made using rocket- borne mass spectrometers. They have been recently reviewed by Swider and Narcisi [1977] and generally show that the amount of NO + ions in the E region is enhanced by a variable factor with respect to the daytime mid-latitude conditions. The high NO +/O• + ratio measurement by Donahue et al. [ 1970] led them to sepeculate that charge exchange of Oa + ions with enhanced amounts of nitric oxide or atomic nitrogen may be responsible for the increase of the NO + density. Subsequently, measurements of this ratio during steady state auroral condi- tions have been used to infer the amount of nitric oxide present in the auroral E region [Swider and Narcisi, 1974; Narcisi and Swider, 1976; Swider and Narcisi, 1977]. Satellite measure-
ature, and neutral composition by experiments on board the Atmosphere Explorer C satellite and simultaneous rocket measurements of ion composition and airglow reported by Rees et al. [1977] and Sharp et al. [1979]. Our aim is to determine whether the observed ionosphere and the nitric oxide may be modeled adequately by a time-dependent calcu- lation using the daytime chemistry and being constrained by a large number of observed quantities. The nitric oxide density
was inferred from a measurement of the NOa continuum on
the same flight [Sharp, 1978]. MODEL
The launch conditions of the rocket whose data will be analyzed here have been described in detail by R ees et al. [1977] and will not be repeated here. Suffice it to say that the
ments
of the intensity
of the nitric
oxide
3• band
resonance
rocket
launch
was
coordinated
with
a pass
of the
AE-C satel-
scattering
in twilight
have
also
indicated
that the amount
of lite over
Fort Churchill
at an altitude
of 490 km. During
the
NO is higher
and
more
variable
at high
latitudes
than
at mid- period
the
intensity
of the
Na
+ first
negative
band
at 3914/•
latitude [Rusch and Barth, 1975] and that the NO density responds to the auroral activity during severe magnetic storms [Gerard and Barth, 1977].
Various models have been developed to examine how the odd nitrogen densities are affected by particle precipitation in
the E region [Jones and Rees, 1973; Vallance-Jones, 1975;
Hyman et al., 1976; Gerard and Barth, 1977; Robie and Rees, 1977]. They show that significant buildup of nitric oxide may be obtained provided the atomic nitrogen atoms resulting from 'the increased ionization and dissociation of N• are mainly produced in the metastable N(aD) state. However, the results of these calculations could not be tested quantitatively
against actual observations, since simultaneous determination
of the precipitated electron spectrum as well as the neutral and ionic composition was missing. Such a requirement on the fraction of N(aD) produced is in agreement with the analysis of the daytime N(aD) and No densities [Frederick and Rusch,
1977; Cravens et al., 1979].
In this study we take advantage of a successfully coordi- nated measurement of the electron spectrum, electron temper-
• Also with Institut D'Astrophysique, Universit6 de Liege, Cointe- Ougr6e, Belgium.
"- Now at Laboratory for Atmospheric and Space Physics, Univer- sity of Colorado, Boulder, Colorado 80309.
Copyright ¸ 1979 by the American Geophysical Union.
was 4 kR, but a brighter display had been observed prior to the launch. The aurora remained relatively time invariant during the flight as could be judged from the ground-based and rocket
measurements
of the 3914-/•
intensity.
The energy
spectrum
of
the precipitated electrons was measured by the low-energy electron detector (LEE) [Hoffman et al., 1973] on the AE-C satellite. The neutral atmospheric composition was measured by the open source mass spectrometer [Nier et al., 1973] on the
satellite between 470 and 200 km and showed only small
latitudinal gradients as determined by comparisons of downleg to upleg data.
At lower altitudes the densities are obtained by extrapolat- ing downward assuming diffusive equilibrium. The density profiles obtained agree well with those inferred from the photometric rocket data down to near the base of the aurora [Sharp et al., 1979] and are listed in Table 1. This atmospheric composition is remarkable in that it shows an unusually large Oa/O ratio at all altitudes. For example, it is 3 times richer in Oa and 3 times poorer in O at 200 km than the MSIS model [Hedin et al., 1977] corresponding to the observed Na profile. There is no indication from either the rocket or the satellite data of any unusual structure in the neutral density profiles. Surely, the unusually large Oa/O ratio indicates that the atmo- sphere is adjusting to auroral heating and induced vertical winds. It is not the purpose of this paper to quantitatively examine the neutral density profiles. Suffice it to say that vertical winds would tend to produce an Oa/O ratio larger
Paper number 9A0416. 0148-0227/79/009A-0416501.00
4336 GERARD AND RUSCH: AURORAL ION COMPOSITION
TABLE 1. Neutral Atmosphere, 4278 Emission, and Ion Production Rates
Z, km T,•, øK
•4278,
photons IN,, Io,
N:, cm -8 O, cm -8 O:, cm -• cm -• s -• cm -• s -• cm -• s -• 90 187 100 195 102.5 204 105 213 110 250 130 529 150 716 170 826 190 890 210 927 230 949 4.9(13) 7.9(10) 1.3(13) 23.0 8.8(3) 9.2(1) 8.7(12) 1.4(11) 1.9(12) 914 3.5(4) 4.0(3) 5.6(12) 1.2(11) 1.1(12) 952 3.6(4) 4.2(3) 3.6(12) 1.1(11) 7.0(11) 881 3.3(4) 3.9(3) 1.6(12) 7.4(10) 2.7(11) 58.1 2.2(3) 2.7(3) 1.3(11) 1.5(10) 1.8(10) 95.2 3.6(3) 5.4(2) 3.6(10) 5.5(9) 4.3(9) 31.1 1.2(3) 2.0(2) 1.4(10) 2.5(9) 1.5(9) 13.3 5.0(2) 9.4(1) 6.3(9) 1.4(9) 6.0(8) 6.4 2.4(2) 5.1(1) 3.0(9) 8.3(8) 2.6(8) 3.3 1.3(2) 3.1(1) 1.5(9) 6.6(8) 1.2(8) 1.9 7.1(1) 2.1(1) Read 4.9(13) as 4.9 X 10 xS. Io•, cm-a s-X •.8(2) 7.3(3) 7.3(3) 6.4(3) 3.8(3) 4.9(2) 1.4(2) 5.3(1) 2.3(1 ) 1.1(•) 5.5(0)
than normal and that the measurements are consistent with
this expectation.
The ionization rate profile is calculated by using a method
developed by Lazarev [1967] for the case of a monodirected-
monoenergetic beam. This formula gives an analytical ex- pression for the total ionization rate as a function of the penetration depth and depends on the energy of the primary electrons and the local mass density [Gerard, 1970]. To illus- trate its validity, Figure 1 shows the altitude distribution of the total ionization rate for a unit flux of incident electrons of three different energies. It is compared with the profile calcu- lated by Berger et al. [1970] using a Monte-Carlo calculation for the degradation of the electrons. In this comparison, the same neutral composition is used, the Jacchia [1971] model for an exospheric temperature of 1050øK. The agreement between the two methods is very good, both in shape and in magnitude for 20-keV electrons; it is within 30% for a 2-keV precipitation. Consequently, we feel confident that this method yields re- liable auroral ionization profiles. To model the particular event we are analyzing, the electron spectrum measured by
•o 250 i- 200 150 ioo E o - 20 2
ISOTROPIC ANGULAR DISTRIBUTION (O-S&)
THIS WORK .... BERGER ET AL (1970)
eV/cm INCIDENT ELECTRON
Fig. 1. Comparison oœ the total ionization ratc vcrsus altitudc œor a unit flux oœ incidcnt clcctrons œor 2, 5, and 20 kcV bctwccn this work and Berger ½t al. [1970].
LEE at universal time 15368 s is used as input, together with the neutral atmospheric composition listed in Table 1. The ionization rate is integrated over the energy spectrum, and an isotropic pitch angle distribution from 0 ø to 80 ø is assumed, in agreement with the pitch angle distribution measured by the detectors. Because of the shape of the measured electron en- ergy spectrum, there is reason to believe that high-energy electrons are present beyond the instrument threshold of 25 keV. We have therefore performed two calculations: one ex- trapolating the LEE energy spectrum to higher energies than was done by Rees et al. [1977], and the other assuming no flux
above 25 keV. The volume emission rate of the X3914-• band
of the N2 + first negative system, r•(3914), is calculated from the
total ionization rate q by using
0.88[N2] 1
7(3914)--
q
0.88[N2]
+ 0.5[0]
+ [02]
14.7
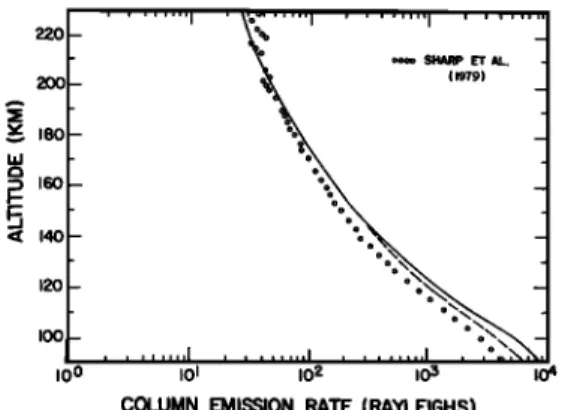
[Variance-Jones, 1975]. The resulting distribution of the verti- cal column emission rate is shown in Figure 2 and compared with the rocket photometer measurement. The two curves agree very well at high altitude, but the calculated intensity progressively exceeds the measurements as altitude decreases.
At 90 km the ratio of the calculated to the measured intensity
is approximately 2 for the extrapolated flux and 1.4 for the case when no extrapolation was made. A similar problem was
opcountered
by Rees et al. [1977],
whose
calculated
3914-/[
intensity is approximately twice the observed intensity at all altitudes. No satisfactory interpretation can be given to the discrepancy except that the correlation between the satellite and the rocket was only realized when the latter was at 217 km. The electron spectrum or pitch angle distribution may have been different when the rocket entered the auroral ionization
peak. Since
a better agreement
with the measured
3914-.4
profile was obtained from the actual electron measurement, it will be used in the following calculation. The calculated ioniza-
tion rates for N•., O•., and O are shown in Table 1.
The production rates of individual ions are obtained from the total ion production rate q following the method described by Variance-Jones [1975]. The relative production of O + ions
in the three lower levels •S, •'D, and •'P is 0.48, 0.32, and 0.20 of
the total O + production, respectively.
The ion and odd nitrogen densities are calculated by using a time-dependent model described by Rusch et al. [1977a] and Cravens et al. [ 1979]. The program uses a general second-order differential equation solver developed at the National Center for Atmospheric Research by Hastings and Robie [1977]. The continuity equations are solved for N2*, NO +, 02 +, N +, O +
• oooo SHARP ET AL. • _ (1979) z• •eo - :::) 16o- øo• 17.0; o o•,,,: o I00 o • , , i i IO O IO I IO 2 IO $ IO 4
COLUMN EMISSION RATE {F•YLœ1GH$}
Fig. 2, The vertical column emission rate of 3914-•4 emission
versus altitude for this work compared to the measurement of Sharp et al. [ 1979].
0S), O+(:D), O+(:P), N(:D), N(:P), NOS), and NO with the chemical reactions listed in Table 2. The NO and NOS) calcu- lations include molecular and eddy diffusion and appropriate flux conditions at the lower (:50 km) and upper (2:50 km) boundaries. Most of the reaction rates and their temperature dependence used in the calculations have been measured in the laboratory, and their values have been confirmed by the analy- sis of the AE measurements of the thermospheric ion composi- tion [Torr and Torr, 1978]. However, a few branching ratios and quenching rates have not been experimentally determined, and a choice must be made guided by our knowledge of the
odd nitrogen daytime chemistry. The reaction of No_ + with O (reaction (R7)) is assumed to produce only N(2D) atoms, and the dissociation of N2 by fast electron impact yields 75% of N(:D) and 25% of NOS) in the model. The values are in
agreement
with the IN I] 5200-,4
airglow
analysis
by Frederick
and Rusch [1977] and give satisfactory agreement with the nitric oxide densities observed in the mid-latitude lower ther- mosphere [Craoens et al., 1979].
RESULTS
As was mentioned earlier, the enhanced dissociation and
ionization of N: due to the particle precipitation produced an increase of the nitric oxide sources in the E region. Con- sequently, in an atmosphere subject to constant particle flux,
the nitric oxide density increases with time until a saturation is
reached.
In Figure 3 the results of three time-dependent calculations are shown. Case I (solid lines) shows the NO buildup and development of the NO+/O: + ratio using the ionization rate profile described in the text at all times. Case 2 (dashed lines) uses a two-step ionization rate such that the initial ionization rate is 10 times the measured one for the first 2 X 10³ s of
computation. The ionization rate is then decreased to the
measured value with a 10-s exponential decay and then held
constant. Case 3 (dotted lines) represents a calculation similar to case 2 except that the time is for the larger flux in 3 X 10: s.
Starting from 2 X 107 cm -3, the NO density in case I varies little during the first 10 • seconds but increases to 2 X 10 • cm -3
TABLE 2. Reactions and Reaction Rates
No. Reaction Reaction Rate* So urce
(R1) O + e•O+(4S, aD, aP)+ 2e see text, (R2) 02 + e --, 02 + + 2e see text
(R3) O2 + e --, O + O+0S, 2D, 2p) + 2e see text:l:
(R4) N2 + e--, N2 + + 2e see text (R5) N2 + e--, NOS)+ N(2D, 2P)+ e see text (R6) N2+e•NOS, 2D, 2P)+N ++2e see text (R7) N2 + +O4NO ++N(2D) (R8) N2 ++O2-,O2 ++N2 (R9) N2 + +e-,NOS )+N(2D) (RI0) O + + N2--, NO + + NOS) (Rll) O ++O2-•O2 ++O (R12) 02 + + NO--, NO + + O2 (R13) 02 + + N(2D) --, NO + + O (RI4) 02 + +e--,O+O (R15) N + + O2'-, NO + + O (R16) NO + + e--, NOS, 2D) + O (R17) NOS) + O2 • NO + O (R18) N(2D) + O2--, NO + O (R19) N(2D)+ e--, NOS)+ e (R20) N(2D) + O -, NOS) + O (R21) NOS).+ NO--, N2 + O (R22) N(2D) --, NOS)+ hv•2oo (R23) O+(2D)+ N2--, N2 + + O (R24) N(2P)+ O • N(2D)+ O (R25) N(2P) + e --, N(2D) + e (R26) N(2P)• N(2D)+ hv (R27) N(2P)• NOS)+ hv (R28) O+(2P) + O--, O+(2D) + O (R29) O+(2P) + e • O+(2D) + e (R30) O+(2P)• O+(2D) + hv (R31) O+(2P) --, O+('S) + hv (R32) O+(2P)+ N2--, N2 + + O (R33) N(2D) + NO • N2 + O (R34) N(2P)+ O2--, NO + O 1.4 X 10-•ø(T/300) -ø." 5 X 10-n(T/300) -ø.' 1.8 X 10-•(T/300) -ø'• 5X 10 -'• 2 x 10-n(r,,/300) -ø'4 4.4 x 10 -•ø 1.8 X 10 -•ø 1 X 10-*T, -ø'* 2.75 X 10 -'ø 4.2 X 10-'(T,/300) -ø'•* 2.4 X 10-" exp (-3975/T,,) 6X 10 -•2 6 X 10-•ø(T,/300) ø-* 5 X 10 -'• 2.1 X 10-" `4•_• = 1.07 X 10 -* s-' IX 10 -ø I X 10 -n 6 X 10-•ø(T,/300) ø'• ,4 = 0.079 s -• ,4 = 0.005 s -• 5.2 X 10 -n 1.89 x 10-'(T,/300) -ø-* ,4 = 0.17 s-' ,4 = 0.048 s -• 4.8 X 10 -•ø 7X 10-" 2.6 X 10 -'•-
f's from Torr and Torr [1978]
McFarland et al. [1974] Lindinger et al. [ 1974] Mehr and Biondi [ 1969] Lindinger et al. [ 1974] McFarland et al. [1974] Lindinger et al. [ 1974] Goldan et al. [ 1966] Torr et al. [1976a] McFarland et al. [1973]
Walls and Dunn [1974] Wilson [ 1967] Lin and Kaufman [ 1971 ] Frederick and Rusch [ 1977] Frederick and Rusch [1977] Phillips and Schiff[1962] Garstang [ 1956]
Rutherford and Vroom [1971] Young and Dunn [1975]
Assumed
Garstang [ 1956] Garstang [ 1956] Rusch et al. [1977]
Henry et al. [1970]
Seaton and Osterbrook [1957] Seaton and Osterbrook [1957] Rusch et al. [1977]
Black et al. [1969] Husain et al. [ 1974]
*Rates are in units of cm a s -• unless otherwise noted. *fOS) = 0.484, f(2D)= 0.323, f(2p)= 0.194. :!:/0S), f(2D), f(2p), same as for (R1).
4338 GERARD AND RUSCH: AURORAL ION COMPOSITION I00.0 o •: I0.0 o + 1.0 o z
O.J f I I i•]lll I I I lfllll I • f fifiil
I0 I0 z 10 3 I0 4
TIME (Sec)
Fig. 3. Nitric oxide density and NO +/O: + ratio versus time. The solid lines correspond to the ionizing flux measured by LEE. The dashed lines correspond to a flux of 10 times the measured one for 2 x
10 a s and then a decay to the measured flux. The dotted lines corre-
spond to a flux of 10 times the measured one for 3 X 10³ s and then a
decay to the measured flux.
10 2 10:3 10 4 IO õ 10 6
ION DENSITY (cm '3)
Fig. 4. Comparison between the calculated and observed iono- spheric densities at t = 5 X l0 • s using the NO + dissociative recombi- nation rate of Walls and Dunn [1974].
after 5 X 10 • s. As a consequence, O: + ions are progressively converted into NO + through reaction (RI2), and the NO+/
O: + ratio increases from 0.7 to 12. The ratio of NO+/O: +
observed at 105 km by the rocket mass spectrometer is ob- served in the model after about 3 X 10 • s.
We recognize that the assumption of a constant precipi- tation during a time period of several times 10 • seconds is
unrealistic. However, a more intense electron flux could pro-
duce the same result in a shorter time, since the density of NO depends only on the total integrated energy flux and the frac- tion of N(:D) and N(4S) atoms produced by reactions (R5), (R6), (R7), and (R16). In fact, a strong breakup period pre- ceded this aurora and was probably able to generate in a few minutes most of the NO present in this aurora. Cases 2 and 3 are attempts to simulate this situation. The energy deposition in the atmosphere above Fort Churchhill was nearly constant for about 1000 s before the rocket launch and remained con- stant during the upleg portion of the flight. Previous to this, the large breakup deposited an average energy of nearly 10 times the energy at launch for several thousand seconds (W. E.
Sharp, private communication, 1978).
In case 2 the measured NO+/O: + ratio is achieved after
1.6 X 10' s and in case 3 after 3.1 X 10 • s. In case 3 most of the
nitric oxide owes its existence to the larger flux. In each case,
however, the electron density is present in response to the low flux. The time constant for the ionosphere to come into equi- librium with the incident flux is about 500 s at 190 km and about 60 s at 110 kin. Thus all three cases produce essentially the same ion density profiles at the time when the NO +/O: + ratio is equal to the measurement, and the observed electron density is consistent with the measured ionization rate. In case 3 the observations produce the NO +/O: + ratio in less than 1
hour. We realize that minor constituents are subject to trans-
port by vertical and horizontal winds and will be transported out of the vicinity of their creation, possibly with very short
time constants. A horizontal wind of 30 m/s would remove the
nitric oxide generated in a 1ø wide auroral arc in I hour. While we do not claim to have exactly represented the time history of this particular aurora, we do, however, feel that the results are consistent with the scenario adopted and that (1) nitric oxide densities of several times 10•/cm 3 can be generated in auroral arcs and the agreement between the calculated NO density at 110 km (see Figure 6) indicates that the time constant for this buildup was less than the time constant for its horizontal or
vertical dispersion and (2) the agreement between the mea- sured and calculated ion densities (see Figure 5) shows that the electron density resulted from the measured ionization rate.
We illustrate the calculated ion composition at that time in
Figures 4 and 5. It may be seen that a good agreement with the observations is obtained for most ions. The detailed com- parison will be discussed in the next section.
The altitude distributions of N(:D), N(4S), and NO are shown in Figure 6 for the time when the NO +/O: + ratio was in agreement with the measurement. In this case the N(:D) and N(•S) densities are nearly equal, in contrast to the daytime situation, where [N(•S)] '-• 20[N(:D)] at 180 kin. The NO densities are enhanced with respect to mid-latitude conditions
by more than an order of magnitude. The NO density at 110
km derived by Sharp [1978] from the intensity of the NO: continuum measured on the same flight is also indicated in Figure 6. The agreement between the two methods strongly supports the validity of the deduced NO density.
DISCUSSION AND CONCLUSIONS
We have used a time-dependent model of the auroral iono- sphere which includes a detailed calculation of the odd nitro- gen chemistry to compare it with a comprehensive set of coordinated rocket and satellite measurements. The absolute densities of NO +, O: +, O +, and N: + are compared at the time
ß
• - -•
DATA
THEORY
[ .o.
-:
...
:-";
•ao •160 140 120 I00 . ... I , ... I , , .•, , . ,. ,O 2 IO 3 IO4 iO 5 iO ION DENSI• (c• 3)Fi•. 5. Same as Figure 4 except that the •• •t M. [1975] rate adopted for the NO + recombination rate.
210
-
•
N(zD)xlO0
N(4S)i
/
/
/
,,o',
i:
,
-,,)
...
, ... ,
. ..
•o 5 •o 6 •o 7 •o • •o • 5x•o •
DENSITY (cm -5)
Fig. 6. The calculated altitude distributions of NO, N(:D), and N(4S). The measurement of Sharp [ 1978] is included for comparison.
when the model predicts the NO +/O? ratio. The comparison between the calculated and measured NO +, Oo` +, and O + den- sities is excellent, especially at low altitudes, and the calculated
NO density agrees well with that determined from the mea- sured NOv. continuum emission [Sharp, 1978]. Note that the NO density at the time of the measurement is well below its saturation value.
The calculated and measured O + densities agree well below
190 km. The major source of O + at low altitudes (Z < 150 km)
is dissociative ionization of Oo`, and we have assumed that the
O + ions produced by this reaction are found in metastable
states in the same proportion as direct impact ionization of O. Thus less than 50% of the O + ions are formed in the ground
state. M etastable O + ions are lost far more rapidly than ground state O + (see Table 2), and this accounts in part for the excellent agreement.
Two difficulties remain: The measured ion densities diverge
from the theory at high altitudes, and the calculated No. + densities are nearly a factor of 3 higher at most altitudes.
The detailed comparison between the calculated and mea-
sured 3914-,4 emission is instructive in the first case. In the
work of Rees et al. [1977] the measured
3914-,4 emission
changes slope above 180 km and indicates an increased ioniza-
tion rate. This would account for the increased ion density at
high altitudes.
The No` + problem is more difficult to understand. In each of the models the calculated No` + is a factor of 3 higher than the measurements at most altitudes and approaches the measured
No` + at low altitudes.
The chemistry of No` + is straightforward, the loss processes being charge exchange with Oo` at low altitude and the ion atom interchange reaction with O at high altitude. Also it appears that the higher recombination rate for NO + of Huang et al. [ 1975] better describes the NO + density distribution. This recombination rate is not consistent with the mid-latitude studies of Torr et al. [1976b] and may be deceiving inasmuch as the NO + is produced mainly by No` + + O at high altitudes.
The NO + density may be too large in Figure 4 as a direct result
of the high No` +. The Huang et al. [1975] rate is probably correct for vibrationally excited NO + and if applicable to the aurora would imply that NO + is vibrationally excited. But the sources of NO + ions in the aurora are the same as those in the dayglow, and so we should not expect NO + to be found in an
enhanced vibrational state. Also, in recent calculations, Swider
and Narcisi [ 1977], Narcisi and Swider [ 1976], and Swider and
Narcisi [1974] appear to have the same problem with the calculated No` + densities when the neutral atmosphere adopted is one of relatively low atomic oxygen concentration.
We stress further need for broad-based measurements of auroral conditions which can serve as constraints on model calculations.
Acknowledgments. The authors thank W. E. Sharp for making his
data available and for his helpful discussions. This work was sup- ported by the National Aeronautics and Space Administration under grants NSG 5171, NAS5-23006, and NGR23-005-360. One of the authors (J.-C.G.) is supported by the Belgian Foundation for Scien- tific Research (FNRS). We thank the National Center for Atmo- spheric Research for computer time. The National Center for Atmo- spheric Research is sponsored by the National Science Foundation.
The Editor thanks R. G. Robie and M. H. Rees for their assistance
in evaluating this paper.
REFERENCES
Berger, M. J., S. M. Saltzer, and K. Maeda, Energy deposition by
auroral electrons in the atmosphere, J. Atmos. Terr. Phys., 32, 1015,
1970.
Black, G., T. G. Stanger, G. A. St. John, and R. A. Young, Vacuum
ultraviolet photolysis of N:O, 4, Deactivation, J. Chem. Phys., 51,
116, 1969.
Cravens, T. E., J.-C. Gerard, A. I. Stewart, and D. W. Rusch, The
latitudinal gradient of nitric oxide in the lower thermosphere, sub-
mitted to J. Geophys. Res., 1979.
Donahue, T. M., E. C. Zipf, and T. D. Parkinson, Ion composition and ion chemistry in an aurora, Planet. Space Sci., 18, 171, 1970. Frederick, J. E., and D. W. R usch, On the chemistry of metastable
atomic nitrogen in the F region deduced from simultaneous satellite
measurements of the 5200-,4 airglow and atmospheric composition,
J. Geophys. Res., 82, 3509, 1977.
Garstang, R. A., Transition probabilities of auroral lines, in The Airglow and Aurorae, edited by E. B. Armstrong, p. 324, Pergamon, New York, 1956.
Gerard, J.-C., Metastable oxygen ions distribution in aurora, Ann. Geophys., 26, 777, 1970.
Gerard, J.-C., and C. A. Barth, High-latitude nitric oxide in the lower thermosphere, J. Geophys. Res., 82, 674, 1977.
Goldan, P. D., A. L. Schmeltekopf, F. C. Fehsenfeld, H. I. Schiff, and E. E. Ferguson, Thermal energy ion-neutral reaction rates, 2, Some
reactions of ionospheric interest, J. Chem. Phys., 44, 4095, 1966. Hastings, J. T., and R. G. Robie, An automatic technique for solving
coupled vector systems of nonlinear parabolic partial differential
equations in one space dimension, Planet. Space Sci., 25, 209-215, 1977.
Hedin, A. E., C. A. Reber, G. P. Newton, N. W. Spencer, H. C.
Brinton, H. G. Mayr, and W. E. Potter, A global thermospheric model based on mass spectrometer and incoherent scatter data MSIS, 2, Composition, J. Geophys. Res., 82, 2148, 1977.
Henry, R. J. W., Photo-ionization cross sections for atoms and ions of
carbon, nitrogen, oxygen, and neon, Astrophys. J., 161, 1153, 1970.
Hoffman, P. A., J. L. Burch, R. W. Janetzke, J. F. McChesner, S. H. Way, and D. S. Evans, Low-energy electron experiment for Atmo- sphere Explorer C and D, Radio Sci., 8, 393, 1973.
Huang, C. M., M. A. Biondi, and R. Johnson, Variation of electron-
NO + ion recombination coefficient with electron temperature, Phys.
Rev. A, 11, 901, 1975.
Husain, D., S. K. Mitra, and A. N. Young, Kinetic study of electroni- cally excited atoms N(2:Dj, 2:Pj) by attenuation of atomic reso-
nance radiation in the vacuum ultraviolet, J. Chem. Soc. Faraday
Trans. 2, 70, 1721, 1974.
Hyman, E., D. J. Strickland, P.S. Julienne, and D. F. Strobel, Auroral NO concentrations, J. Geophys. Res., 81, 4765, 1976.
Jacchia, L. G., Revised static models of thermosphere and exosphere
with empirical temperature profiles, Spec. Rep. 332, Smithson. As-
trophys. Observ., Cambridge, Mass., May 1971.
Jones, R. A., and M. H. Rees, Time-dependent studies of the aurora, 1, Ion density and composition, Planet. Space Sci., 21, 537, 1973. Lazarev, V. I., Absorption of the energy of an electron beam in the
upper atmosphere, Geomagn. Aeron., 7, 219, 1967.
Lin, C.-L., and F. Kaufman, Reactions of metastable nitrogen atoms,
4340 GERARD AND RUSCH: AURORAL ION COMPOSITION
Linclinger, W., F. C. Fehsenfeld, A. L. Schmeltekopf, and E. E.
Ferguson, Temperature dependence of some ionospheric ion-neu- tral reactions from 300 ø to 900øK, J. Geophys. Res., 79, 4753, 1974.
M cFarland, M., D. L. Albritton, F. C. F ehsenfeld, E. E. Ferguson, and A. L. Schmeltekopf, A flow-drift technique for ion mobility and ion-molecule rate constant measurements, J. Chem. Phys., 59, 6620, 1973.
McFarland, M., D. L. Albritton, F. C. Fehsenfeld, E. E. Ferguson, and A. L. Schmeltekopf, Energy dependence and branching ratio of
the N: + + O reaction, J. Geophys. Res., 79, 2925, 1974.
M ehr, F. J., and M. A. Biondi, Electron temperature dependence of recombination of O: + and N: + ions with electrons, Phys. Rev., 181,
264, 1969.
Narcisi, R. S., and W. Swider, Ionic structure near an auroral arc, J. Geophys. Res., 81, 4770, 1976.
Nier, A. O., W. E. Potter, D. R. Hickman, and K. Mauersberger, The open source neutral mass spectrometer on Atmosphere Explorer C,
D, and E, Radio Sci., 8, 271, 1973.
Phillips, L. F., and H. I. Schiff, Mass spectrometer studies of atom reactions, 1, Reactions in the atomic nitrogen-ozone system, J.
Chem. Phys., 36, 1509, 1962.
Rees, M. H., A. I. Stewart, W. E. Sharp, P. B. Hays, R. A. Hoffman,
L. H. Brace, J.P. Doering, and W. K. Peterson, Coordinated rocket and satellite measurements of an auroral event, 1, Satellite observa- tions and analysis, J. Geophys. Res., 82, 2250, 1977.
Robie, R. G., and M. H. Rees, Time-dependent studies of the aurora:
Effects of particle precipitation on the dynamic morphology of ionospheric and atmospheric properties, Planet. Space Sci., 25, 991,
1977.
Rusch, D. W., and C. A. Barth, Satellite measurements of nitric oxide
in the polar region, J. Geophys. Res., 80, 3719, 1975.
Rusch, D. W., T. E. Cravens, G. R. Carignan, A. I. Stewart, and J.-C. Gerard, A theoretical model of odd nitrogen in the earth's thermo-
sphere and mesosphere (abstract), Eos Trans. ,4GU, 58, 1198, 1977a. Rusch, D. W., D. G. Torr, P. B. Hays, and J. C. G. Walker, The O II
(7319-30,4) dayglow, J. Geophys. Res., 82, 719, 1977b.
Rutherford, J. A., and D. G. Vroom, Effect of metastable O +(:D) on reactions of O + with nitrogen molecules, J. Chem. Phys., 55, 5622,
1971.
Seaton, M. J., and D. E. Osterbrock, Relative (O II) intensities in
gaseous nebulae, ,4strophys. J., 125, 66, 1957.
Sharp, W. E., NO: continuum in aurora, J. Geophys. Res., 83, 4373, 1978.
Sharp, W. E., M. H. Rees, and A. I. Stewart, Coordinated rocket and satellite measurements of an auroral event, 2, The rocket observa- tions and analysis, J. Geophys. Res., 84, 1977, 1979.
Swider, W., ancl R. S. Narcisi, Ion composition in an IBC class II aurora, 2, Model, J. Geophys. Res., 79, 2849, 1974.
Swider, W., and R. S. Narcisi, Auroral E region ion composition and
nitric oxide, Planet. Space Sci., 25, 103, 1977.
Torr, D. G., and M. R. Torr, Review of rate coefficients of ionic
reactions determined from measurements made by the atmosphere
explorer satellites, Rev. Geophys. Space Phys., 16, 327, 1978. Torr, D. G., M. R. Torr, J. C. G. Walker, A. O. Nier, L. H. Brace, and
H. C. Brinton, Recombination of O: + in the ionosphere, J. Geophys.
Res., 81, 5578, 1976a.
Torr, D. G., J. C. G. Walker, L. H. Brace, J. H. Hoffman, A. O. Nier,
and M. Oppenheimer, Recombination of NO + in the ionosphere,
Geophys. Res. Lett., 3, 209, 1976b.
Vallance-Jones, A., A model for the excitation of electron aurora and some application, Can. J. Phys., 53, 2267, 1975.
Walls, F. L., and G. H. Dunn, Measurements of total cross sections
for electron recombination with NO + and O: + using storage tech-
niques, J. Geophys. Res., 79, 1911, 1974.
Wilson, W. E., Rate constant for the reaction N + O: • NO + O, J. Chem. Phys., 46, 2017, 1967.
Young, R. A., and O. J. Dunn, The excitation and quenching of
N(:P), J. Chem. Phys., 63, l150, 1975. (Received October 24, 1978;
revised February 12, 1979; accepted March 5, 1979.)

![Fig. 4. Comparison between the calculated and observed iono- spheric densities at t = 5 X l0 • s using the NO + dissociative recombi- nation rate of Walls and Dunn [1974]](https://thumb-eu.123doks.com/thumbv2/123doknet/5893350.144131/4.864.446.798.97.353/comparison-calculated-observed-spheric-densities-dissociative-recombi-walls.webp)
![Fig. 6. The calculated altitude distributions of NO, N(:D), and N(4S). The measurement of Sharp [ 1978] is included for comparison](https://thumb-eu.123doks.com/thumbv2/123doknet/5893350.144131/5.864.69.416.94.356/fig-calculated-altitude-distributions-measurement-sharp-included-comparison.webp)
