Evaluation of the quality of Alexa’s metrics
Research paper fulfilled in the prospect of obtaining the Masters of Information Science degree
by:
Megan FUSS Sophie JOHNER
Under the supervision of:
Professor Arnaud GAUDINAT
Geneva, 17 January 2018
HES-SO University of Applied Sciences of Western Switzerland Information Science department
Declaration
This Research Project is submitted as part of the examination requirements of the HES-SO University of Applied Sciences of Western Switzerland for obtaining the title of Master of Science in Information Sciences.
The students attest that their work was verified by a plagiarism detection software. The students accept the terms of the confidentiality agreement, if one has been signed. The use of any conclusions or recommendations made in the Research Project, without prejudice to their value, engages neither the responsibility of the authors, nor the Research Project’s Director, nor the University of Applied Sciences of Western Switzerland.
« We attest that we have personally completed this work without using any sources other than those quoted in the references. »
Geneva, 17 January 2018 Megan FUSS
Acknowledgements
We would like to thank our project Director Professor Arnaud Gaudinat, for all the support and advice that was given throughout the project.
Likewise, we wish to thank all the websites that participated in this study, without their willingness to contribute the project could not have returned any results. Notably Philippe Scheller from Service Ecole Média (SEM).
We would also like to thank everyone in our entourage for the support than was given to the both of us and for giving us the ability to push through to the end.
Abstract
Alexa is a tool that can easily be confused by name with the voice device that Amazon proposes, but in reality, it is a web traffic tool. Very little is known about how it functions and where it gets data from. With so little information available, how is it possible to know whether the tool is of good value or not. The ability to compare Alexa with other tools such as Google Analytics gives insight into the quality of metrics and makes it possible to judge its transparency, reliability, trustworthiness and flexibility.
To achieve this a state of the art on the subject was held, portraying elements relative to the metrics, the tools and the methods, this gave a direction in which to take the study. This lead the way to a much more practical side of the project, actually dealing with and assessing data. With a call being sent out to multiple networks, a sample of 10 websites was created, they all varied greatly but they also held important information that would help answer the research questions.
A strict work methodology was undertaken to ensure the data would not be tainted and that it remained usable in order to facilitate the analysis of the data, it also ensured no backtracking would be necessary.
The findings were not as striking as expected, as some results were more similar than originally predicted, although the correlation between the numbers was very low. Hardly any websites from the sample presented results that were constantly similar, albeit one, there was also one metric that would have data that bore no resemblance between the different tools.
In addition to the results emitted by the data and charts numerous limitations attached to the tools were identified and it was obvious that they added challenges into giving conclusive results.
Even though Alexa presents itself to be a useful tool to the everyday individual it does have quite a few limitations that a more consequent tool does not possess. There are evidently also improvements to be made when it comes to the standardization of such tools in order to make their use easier for all.
Not all the results found in this study were conclusive but the door is open for a more in-depth project that would answer the additional questions that came up.
Table of contents
Declaration... i
Acknowledgements ... ii
Abstract ... iii
Table of contents ... iv
List of tables ... vi
List of figures ... vi
1.
Research framework ... 1
2.
Literary review of the current state of the analytical webometrics ... 2
2.1 Theoretical literary review ... 2
2.1.1 Webometrics ... 2
2.1.2 Related studies ... 3
2.1.3 Metrics ... 3
2.1.4 Pearson correlation coefficient ... 5
2.2 Analytical tools literary review ... 7
2.2.1 Tools ... 8
2.2.2 Methods ...13
3.
Research questions and hypotheses ... 16
3.1 Transparency ...16
3.2 Reliability ...16
3.3 Trustworthiness ...17
3.4 Flexibility ...17
4.
Research methodology ... 18
4.1 Tools and methods ...18
4.2 Metrics ...19
4.3 Participants and website sample ...21
4.4 Sample limitations ...24 4.5 Data preparation ...24 4.6 Data collection...26 4.7 Data analysis ...28 4.8 Results ...29
5.
Research findings ... 30
5.1 Bounce % ...31 5.2 Time on site ...335.3 Pageviews per visitor...35
5.4 Sites linking in ...37
5.6 Conclusion ...39
6.
Research limitations... 40
6.1 Method ...40 6.2 Scope of data ...40 6.3 Domain names...41 6.4 Website size ...41 6.5 Timeframe ...41 6.6 Accessibility ...42 6.7 Complexity ...42 6.8 User sessions ...426.9 Amazon and Google...43
7.
Reflection on Alexa ... 44
7.1 Transparency ...44
7.2 Reliability ...44
7.3 Trustworthiness ...45
7.4 Flexibility ...45
8.
Standardization of metrics and analytical tools ... 46
9.
Discussion and future work ... 47
10.
Conclusion ... 48
References ... 50
Annex 1: Call for webmasters – Swiss-lib... 55
Annex 2: Appel aux responsables – Swiss-lib ... 56
Annex 3: Call for webmasters – LinkedIn ... 57
Annex 4: Appel aux responsables – LinkedIn ... 58
Annex 5: Correlation – Bounce % ... 59
Annex 6: Correlation – Time on site ... 60
List of tables
Table 1: common metrics ... 5
Table 2: list of general Alexa metrics ...21
Table 3: time frames used for each website ...27
Table 4: number of sites linking in ...37
Table 5: ranking of geographic audience ...38
List of figures
Figure 1: the coefficient strength of association of Pearson ... 6Figure 2: correlation cloud chart example ... 6
Figure 3: Alexa freemium interface ... 9
Figure 4: Alexa competitive analysis tool availability ... 9
Figure 5: Alexa paid sevices menu ...10
Figure 6: Google Analytics interface ...11
Figure 7: MajesticSEO interface ...12
Figure 8: cycle of toolbar ...13
Figure 9: adding Alexa browser extension ...14
Figure 10: accepting and enabling Alexa browser extension ...14
Figure 11: Google Analytics code ...14
Figure 12: cycle of Google Analytics ...15
Figure 13: sample sectors ...22
Figure 14: sample scope ...23
Figure 15: sample size ...23
Figure 16: Alexa > Data Collection hierarchy ...25
Figure 17: example Site A ...25
Figure 18: Alexa folder content ...26
Figure 19: Google Analytics folder content ...26
Figure 20: comparison example bar chart ...29
Figure 21: correlation example graph ...29
Figure 22: bounce % ...31
Figure 23: correlation bounce % ...32
Figure 24: time on site in seconds ...33
Figure 25: correlation time on site in seconds ...34
Figure 26: pageviews per visitor ...35
1.
Research framework
As part of the Master in Information Sciences, a research project that would span over two semesters had to be conducted. The subject of the study that is going to be discussed is entitled "Evaluation of the quality of Alexa’s metrics". The project consists of two team members, Megan Fuss and Sophie Johner, and is under the supervision of Professor Arnaud Gaudinat.
Although this study is not part of a broader project, its main findings could, however, be reused in further studies surrounding the evaluation of metrics and webometric standards.
This venture emerged from a hypothesis noted by Professor Arnaud Gaudinat; the metrics measured by Alexa1 did not possess a good level of quality. Essentially, that they are not necessarily identical to the results given by the same kind of tools measuring web traffic.
In order to either confirm or deny this hypothesis, a thorough study needed to be conducted allowing the comparison of Alexa with other tools using similar web indicators.
Evidently these tools would have ulterior ways of functioning, which made it all the more important to be able to understand just how they worked and what exactly could be used to render them comparable.
The basis of this project would be to elaborate a state of the art on the topic not only in a theoretical sense but also a practical one, then to carry out tests on multiple tools using a sample of websites. This sample would then allow any research questions to be answered and to ultimately aid in the reflection on the final outcome.
2.
Literary review of the current state of the analytical
webometrics
This section portrays the literature review, where different points will be approached. Firstly, a theoretical literary review will be proposed. The goal of the literary review is to consider all the facts that are needed in order to understand the environment of this study. Thus, articles relating to other studies on the subject would be helpful in order to reorient the project if needed, but also any information on how the metrics that would compared actually functioned. In the more specific sense, material on elements such as the Pearson correlation coefficient would also be needed to ensure that the data would be correctly analyzed.
Secondly, an analytical review will be depicted to distinguish the tools that were used during the research paper. These tools were Alexa, Google Analytics2 and Majestic
SEO3. For this aspect, two points will be approached, those being the methods and the tools.
The methods will be focused on how the tools collect webometric data through websites and the tools will be emphasized by what is available on the market for website analytics evaluation.
2.1 Theoretical literary review
The first section in the state of the art exemplifies related studies, information on metrics and correlations aiding the analysis of data.
This theoretical part is useful in understanding certain points of this project, some of the elements below tend to explain the direction taken in this study as well as an overall perspective.
2.1.1 Webometrics
The core of this project can be allotted to a subject relating to webometrics, which according to Björneborn, Thelwall and Vaughan, is the study of phenomenon that are directly Web-related (2005).
Although this study focuses on an aspect of webometrics, with the analysis of web analytic data, webometrics in itself would not be a central part and as such, not approached as a whole.
2https://www.google.com/analytics 3https://majestic.com/
2.1.2 Related studies
When it came to related studies, only one that compared Alexa with other analytical tools was retained. It was based on the comparison of tools referred to as “competitive intelligence tools”: Alexa, Compete4 and Quantcast5, with Google Analytics. Whilst using these tools and on the basis of 18 websites, 5 different metrics are compared over the course of 3-month periods, with the correlation of data varying greatly when it came to Alexa.
The main conclusion of this study is that there is not a lot of information about how analytical tools collect their data. Evidently, analytical tools need to be used with caution because the data is not necessarily always accurate, and there are numerous things to consider, such as time frame and how data is collected (Kamerer 2013).
Unfortunately, no limitations were put forward in the context of David Kamerer’s research article, so it was impossible to judge how to improve the methodology used in this study based on his article.
2.1.3 Metrics
Before setting out into a comparison of analytical tool, there was a need to improve the knowledge on the metrics that are proposed by each tool. This information would be used to understand which metrics should be selected for each tool.
A metric is something that measures user information, it helps deduce the behavior as well as the activity of the individual visiting the website. Some common metrics are page views, page transitions, and session times (IGI Global 2017).
A difference can be made between the type of metric; they be can be on-site or off-site (metrics). On-site metrics are those which are about the website and its activity. On the contrary, off-site metrics are based on internet data (Clifton 2015). Google Analytics uses on-site metrics, whereas Alexa uses on-site and off-site metrics, and MajesticSEO solely uses off-site metrics.
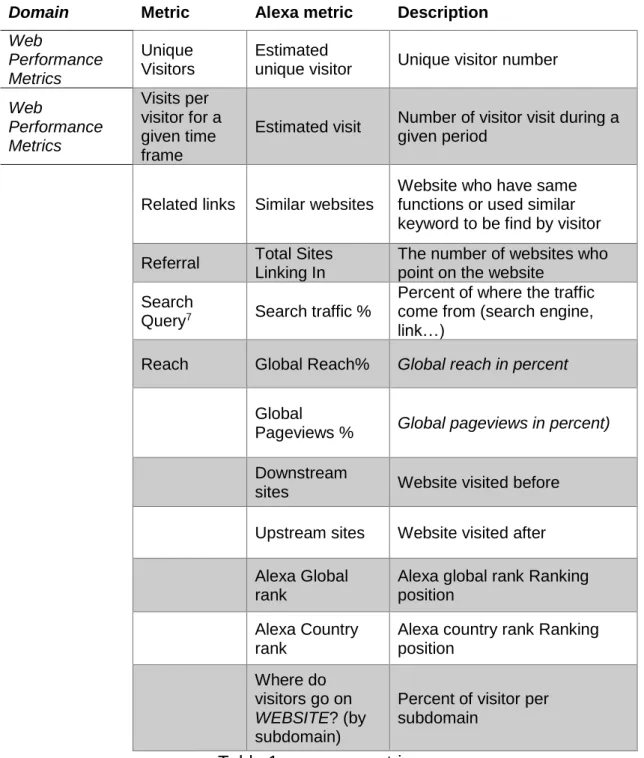
The table below illustrates some commonly used metrics by domain (Digitalgov 2017b, Google Analytics 2017) with the specific name used by Alexa (2017).
Domain Metric Alexa metric Description
Demographics Visits by
country
Visitor by country %
The percentage of users having visited the website in specific locations Demographics Gender Gender based on internet average Visitor gender Demographics Education Education based on internet average
Level of visitor education
Demographics Location
Browsing location based on internet average
Location visitor (school, work, home)
Demographics Age Age based on
internet average Visitor age
Demographics Income Income based on
internet average Visitor income
Demographics Ethnicity Ethnicity based on internet average Visitor ethnicity Demographics Children Children based on internet average
Visitor has children or not
Search Metrics Top referring
search terms
Top Keywords from Search Engines
Most useful keywords used by visitor from search engine
Search Metrics
Channel6 Traffic sources The way used by the visitor to come
Social media Google +1's Google +1's
Google +1's is a toolbar, it permits to "like"/recommend a website
Speed Page load
time
How fast does WEBSITE load? (on seconds) Website speed Web Performance Metrics Page Views per Visit Pageviews per Visitor
The number of pages that are visited per session. It’s division between the total pageviews and the number of visitors on the same period
Web
Performance Metrics
Bounce Rate Bounce %
The percentage of people that left the site without any
interaction
Web
Performance Metrics
Average Visit
Duration Time on site
The average time of the duration of a session
6 Google Analytics name
Domain Metric Alexa metric Description Web Performance Metrics Unique Visitors Estimated
unique visitor Unique visitor number
Web Performance Metrics Visits per visitor for a given time frame
Estimated visit Number of visitor visit during a given period
Related links Similar websites
Website who have same functions or used similar keyword to be find by visitor Referral Total Sites
Linking In
The number of websites who point on the website
Search
Query7 Search traffic %
Percent of where the traffic come from (search engine, link…)
Reach Global Reach% Global reach in percent
Global Pageviews % Global pageviews in percent)
Downstream sites Website visited before
Upstream sites Website visited after
Alexa Global rank Alexa global rank Ranking position
Alexa Country rank Alexa country rank Ranking position
Where do visitors go on
WEBSITE? (by
subdomain)
Percent of visitor per subdomain
Table 1: common metrics
2.1.4 Pearson correlation coefficient
The Pearson correlation is a formula that is used to find the correlation between two variables, in this study it will be used to determine the degree of correlation between data collected from the different tools.
To identify the correlation using the Pearson method, the coefficient is indicated by using the letter “r”. In order to measure the linear association between two quantitative and
each data point is arranged according to the available numbers. Once all the variables have been determined, a line between the data of the two variables can be inserted that will then indicate the distance between all the points (Laerd statistics 2013a).
The PCC displays a result which is in between “1” and “-1”. With a result of “1” or “-1” a perfect correlation is achieved, as opposed to “0” which represent no correlation at all. When the result is closest to “0”, the correlation is at its lowest possible point (Rumsey 2016).
Figure 1: the coefficient strength of association of Pearson
The correlation can be represented in the form of cloud charts, they can either show a positive, negative or even no correlation at all (Rumsey 2016).
Figure 2: correlation cloud chart example
Admittedly, there are some limitations when it comes to the use of the Pearson correlation coefficient. The Pearson method can be sensitive with data that does not follow a specific trend, hence it is possible to remove data with a great justification or whilst using other tools (Laerd statistics 2013a). It remains crucial to not influence the research results by meddling with the available data in order to obtain a preferred correlation.
2.2 Analytical tools literary review
The second section of the state of the art focuses on the tools and the methods. The main tool used in this study is of course Alexa, as it is the core of the project. As to compare the metrics obtained with Alexa, other tools had to be chosen, most notably Google Analytics because of its standing in the analytical world and MajesticSEO for its coverage when it came to site links.
This meant that there would be a focus on two methods, the Toolbar and JavaScript code, but also some reference to the web crawl.
The toolbar is Alexa’s main method, whereas the use of JavaScript code is Google Analytics primary method. Albeit, recently Alexa has started proposing a certification that uses JavaScript (Kristen 2014b).
2.2.1 Tools
To align this study, based on Alexa and its counterparts, more information was needed concerning the different web traffic tools available on the market today, it was also imperative to discover tools based on-site and off-site metrics.
The main tools that would be used to assess Alexa’s metrics would be Google Analytics for on-site metrics and MajesticSEO for off-site metrics.
Obviously, numerous tools exist that have the same purpose as the ones chosen, but the choice was made to consolidate and keep only two alternatives. For instance, Compete and Quantcast were two other options but Compete was shut down in December 2016 (Compete 2016) and Quantcast did not appear as useful as Google Analytics when it came to data reliability. Piwik was also considered as it held an important part of the CMS market (Builthwith 2017), ultimately it was not used as the sample did not contain websites with this tool installed.
In fact, one of the purposes of this study was to compare Alexa to other tools to discern more about its reliability. Thus, the most advantageous tool to do so was the perceived leader of analytics, which is Google Analytics.
Furthermore, for the off-site metrics, an additional tool was needed for the comparison. Hence, MajesticSEO was also selected for this study because it would be more accurate than Google Analytics to measure off-site metrics as it specializes in those types of metrics. 2.2.1.1 Alexa
Alexa Internet is a web information company owned by Amazon, it was founded by Brewster Kahle and Bruce Gilliat in 1996, it was then purchased by Amazon in 1999 (Successstory 2017).
It offers many services, such as web traffic measurement for on-site and off-site metrics and Search Engine Optimization tools.
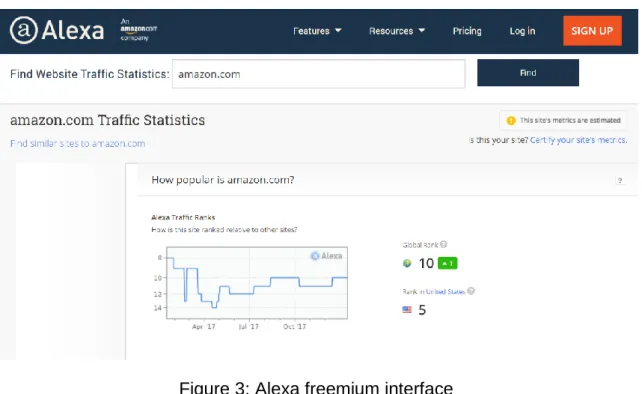
There are multiple ways to use it, as a free tool and as a premium service. When it comes to the free tool, anyone can see the results for any given website, more content becomes available with the premium service (Alexa 2017b).
The interfaces vary amongst themselves, with a more simplistic approach to the freemium one.
Figure 3: Alexa freemium interface
Although the level of services depends on the price of the Alexa plan, an interesting set of website analysis tools can be identified with most of packages.
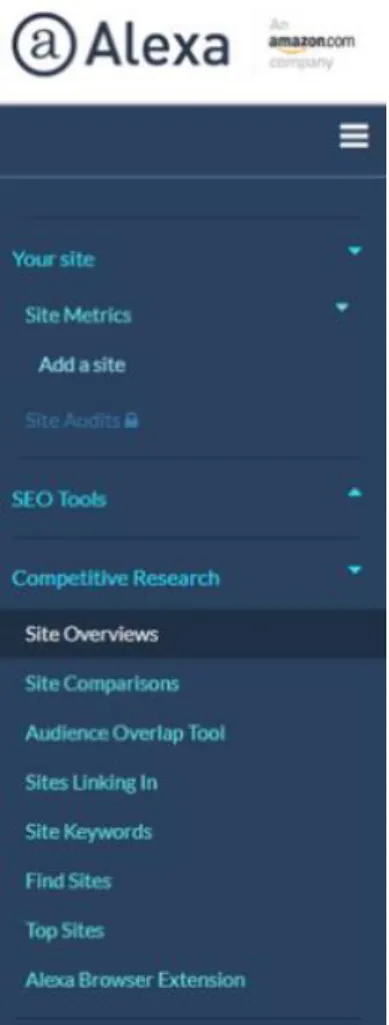
The purchase of a plan opens up a new interface with a menu that mimics the proposed services.
Figure 5: Alexa paid sevices menu
One of its main purposes appears to be for the comparison of multiple websites and to analyze one’s competition.
The current Alexa website does not share an abundance of information concerning the toolbar and how it collects data (Alexa 2017b). Slightly more information about the company can be identified whilst visiting previous versions of the Alexa website (from 2003 to 2011) with the use of the Wayback Machine to find the older websites (Wayback machine 2003-2011).
There are multiple ways in which Alexa collects its data (Orelind 2016):
• Toolbar (add-on, browser extension, plug-in) that collects data with user’s consent
• Alexa certified code: collect data with website consent • Data banks
Most recent data on toolbar users:
• 7 million toolbar downloads in 2000 (Waybackmachine 2004) • 10 million users in 2005 (Sitesell 2005)
• 546’279 users with the Chrome toolbar extension (Chrome store 2017)
A compelling fact about Alexa is that since the 2000s they have a partnership with the Wayback Machine in which they share all their web crawls (Wayback machine 2004).
2.2.1.2 Google Analytics
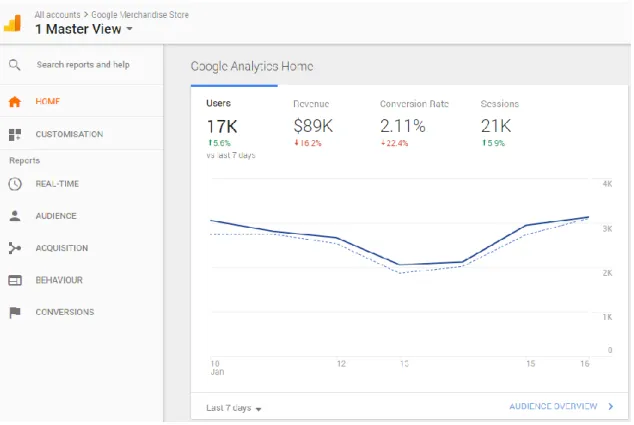
Google Analytics was started in 2005. Like Alexa it is a freemium based tool. There are free services as well as paid services, which can be chosen depending on how the webmaster wishes to use the tool (Google Analytics 2017).
Figure 6: Google Analytics interface
All that data relating to a website is solely for the owner of said website, or for anyone that decide to share their analytics with.
Google Analytics is a leader when it comes to analytical tools as it is used by more than 80% of websites that have an analytical tool installed (W3techs 2017).
It uses JavaScript to collect data so it can provide on-site metrics, it is a portion of code that is added to each page of a website that then permits Google Analytics to retrieve data.
The JavaScript method is quite transparent as it’s not difficult to know how it works, which in turn makes the manner of collecting data similarly transparent.
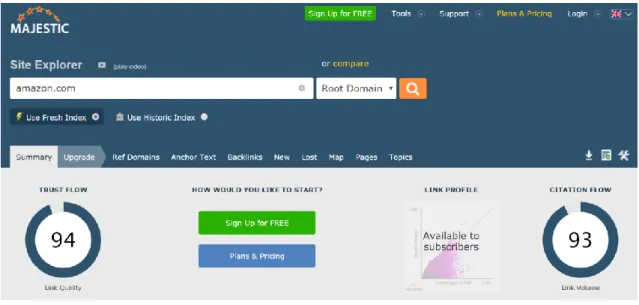
2.2.1.3 MajesticSEO
MajesticSEO8 is a web-based application (Stanczak 2017) that offers freemium SEO tools, it was founded in 2004 as a branch of Majestic-12 Ltd.
In order to collect data, the tool uses the methods of web crawling and indexing of large amounts of web data. It does so with the means of The Majestic-12: Distributed Search Engine, it also included data from third-parties such as MaxMind, Alexa, and dmoz.org but doesn’t necessarily exploit it (Majestic 2017).
Majestic proposes multiple services like backlink indexing, citation flow and trust flow. Majestic doesn’t include habitual information about keywords like monthly searches, keyword suggestions, and SEO audits or rank tracking (Stanczak 2017).
Figure 7: MajesticSEO interface
When it comes to the type of metrics, MajesticSEO uses off-site ones (Clinfton 2015).
8 Search Engine Optimization
2.2.2 Methods
As Alexa and Google Analytics have two main methods of functioning, more information was needed to ensure they were understood.
This section will focus on the methods they use to collect data, the toolbar and JavaScript code.
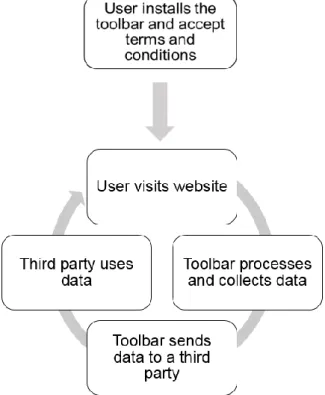
2.2.2.1 Toolbar
The toolbar is a web browser extension that is installed by the user. Each time a person that uses the add-on and visits a website they transfer the related data to Alexa. Then, based off of these installations, Alexa can form a sample that they describe as representative of all web users (Waybackmachine 2004).
Figure 8: cycle of toolbar
There is little to no incentive for the user to install this toolbar, as all they get out of it is a snapshot for the website they are currently visiting. There is also limited publicity surrounding the Alexa service, meaning that user doesn’t necessarily know of its existence.
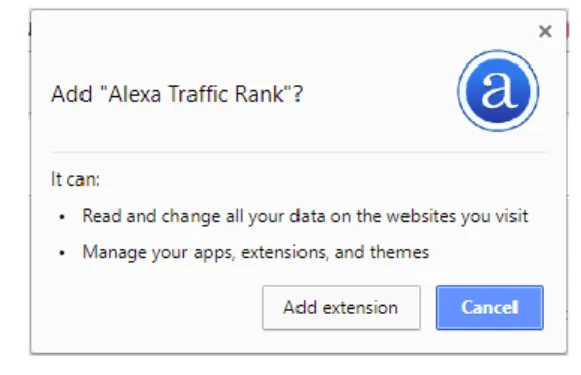
When installing the toolbar through a web browser not much information is given on the page itself, but once you go through with adding it a notification will be shown saying that you accept to let the extension read and change data of visited website (Chrome Web Store 2017).
Figure 9: adding Alexa browser extension
Before the toolbar is completely installed you have to accept the terms and conditions.
Figure 10: accepting and enabling Alexa browser extension
Due to these facts, it is difficult to know who has the toolbar activated and installed.
2.2.2.2 JavaScript
The process used to integrate Google Analytics in one’s website is relatively straightforward, the code is made available and requires a simple copy and paste into each web page code, and this is done by the webmaster or owner (Google Analytics 2017).
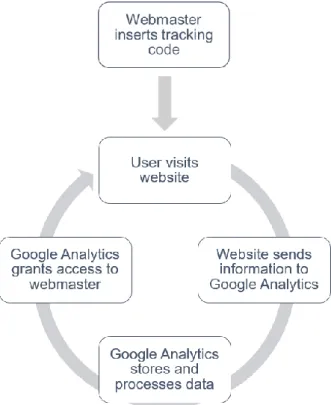
Once it is set to work, the users will then visit the website which gives the browser the ability to send information back to Google Analytics. The data will then be stored and processed by Google Analytics making it available to the webmaster or owner (Gawron 2016).
Figure 12: cycle of Google Analytics
This series of actions is continuously at work, albeit the integration of the tracking code, which is done once per page (Gawron 2016).
When a user visits a page, the script executes and calls an API to the server which tracks user interactions (Gawron 2016).
The browser executes the scripts and collects basic information which is permitted by the user or browser, the script then creates cookies to know if it’s a new or returning visitor. The tracking code sends information by requesting a file, Google Analytics has a record of all these requests as well as visitor information (Analytics Market 2016b). The use of JavaScript code to collect data can be limited as it could be blocked by ad-blockers (Gawron 2016) and it could also be blocked by a browser firewall or proxy filter (Analytics market 2017b).
3.
Research questions and hypotheses
Before the research project commenced, various hypotheses were laid out. Throughout the course of the study they would need to be considered and eventually answered. These hypotheses were thought out by Professor Arnaud Gaudinat in order to be contemplated by the research team, they are as follows:
1. Alexa’s data is collected through a toolbar that any user can install on their web browser, can this manner of collecting data skew the results? Furthermore, what is the commercial reach of such a tool?
2. What is the quality and reliability of the data emitted by Alexa through measurements such as web traffic, bounce rate, geographical origin etc.? 3. Is metric data collection the same regardless of analytical tool? Do metrics have
similarities or are there major differences depending to the tools tested?
4. What are the avenues that should be contemplated to ensure standardized and transparent data of the Web?
Once these questions were outlined, the hypotheses were arranged into four categories: transparency; reliability; trustworthiness and flexibility.
3.1 Transparency
Since Alexa mostly collects web traffic data through the means of its toolbar, with very little information surrounding the actual method, this was a primary facet to analyze. Consequently, the toolbar method appeared to be a major issue that would need much reflection in order to determine whether the use of said toolbar would lead to metrics as well as data procurement less transparent than other similar tools.
3.2 Reliability
Accordingly, it calls to question if the data that is put forward is truly reliable, most notably due to the use of the toolbar. Alexa states they use a representative sample, this means that not every website visitor contributes to the web traffic data.
3.3 Trustworthiness
Similar to reliability, the aspect of trustworthiness also needed to be considered. How much information does Alexa share as a company with the general public that would give more insight into how they work.
3.4 Flexibility
Additionally, with the use of such a “freemium” tool, Alexa, how flexible would it be when it came to its usage. Would it permit an adaptable use, would various elements be changeable to relate to the project?
This was obviously important as it would generally render the project much smoother to carry out considering the flexibility of Google Analytics.
4.
Research methodology
This part of the study illustrates the general methodology that was used for the most important aspects of the project.
Notably, the tools and the methods, the metrics, the participants, the sample, the data and the results.
Most of the project was conducted with the help of two work tools Google Drive9 and SWITCHdrive10. Google Drive allowed a collaborative work environment to be created, general documentation and work reports were safely stored on the platform making them available to the entire team at all times. SWITCHdrive was used with everything surrounding actual data and any information tied to the participants.
Additionally, to help organize the project a Gantt tool was used by the name of teamgantt11 with which a calendar with all the tasks was made.
4.1 Tools and methods
There were two main aspects to the project, the tools that would allow the study to proceed and the methods that were to be used.
When it came to the tools, the topic evidently put forward Alexa, it would be primary one as it is the heart of the study. Then Google Analytics was selected as it represented a leader in the analytical field.
Since Alexa used on-site and off-site metrics, a comparative tool would be needed for each type of metric. Google Analytics represented the on-site metrics but not the off-site aspect. MajesticSEO was chosen to portray the off-site metrics and search engine optimization (sites linking in) as it was recommended by Professor Arnaud Gaudinat. Even though multiple tools are available on the market, it was decided to not embark on more choices. At one point, Piwik was considered as it was tied to a large CMS12 market but also because a website using it could have been a part of the sample. Due to a short period of time to carry out the project and a small sample size there were not enough benefits to add an extra amount of work.
Obviously for the methods, they were decided based on the frame of the study. Firstly, the toolbar as it is the primary method used by Alexa, this made up the first method that
9https://www.google.com/intl/fr_ALL/drive/ 10https://www.switch.ch/drive/
11https://www.teamgantt.com/ 12 Content Management System
would be treated. Secondly, JavaScript came into the picture as Google Analytics had been chosen. Thirdly, a search engine optimization tool for link aspects, MajesticSEO. Thus, in order to not influence any results attached to the sample of websites, it was crucial to not inflate results by visiting them or any of their pages, more specifically with the Alexa toolbar active. Nonetheless, outside the scope of the toolbar it was also important to restrain the amount of times the websites were consulted by the team as to make sure the Google Analytics and results were not influenced. Considering no content was created or any type of links, MajesticSEO was not affected either.
In the beginning the sites in the sample needed to be visited in order to make sure that the correct URL13 would be used when collecting data with Alexa and MajesticSEO. They were also inspected with BuiltWith14 to discover additional technical information.
To test how the toolbar functioned, it was installed on a browser that would not be used on a regular basis for the project, this was to ensure that toolbar results were not affected. The visual aspects could then be tested through the use of the toolbar on a random website (one that was not a part of the sample) and through the Alexa website15 search. The use of the in-site Alexa search did not influence the results as it was an interface presenting the available metric data. This interface presented multiple sections for the website involved in the search, it could be more or less enriched depending on the amount of data Alexa had. Considering there was no impact on the data, the website that would be contained in the sample could be looked up, and this meant that all the data that would be available could be pre-analyzed.
Through the use of the Google Analytics platform and Google account, the user has access to all websites that they either own or that have been share with them, hence it was unnecessary to be mindful of correct URLs for this tool.
4.2 Metrics
An important part of the study was dedicated to web traffic metrics. As multiple tools would be used, a system needed to be elaborated to make sure that all metrics would be covered by each tool.
To do so a table was created based first hand on the metrics proposed by Alexa as it was the main tool, each metric available was listed. Once this step was complete, the
other tools were analyzed and an indication was set on whether the other tool had or did not have the metric, the listing in blue are the ones that were selected.
Alexa Google Analytics MajesticSEO
Visitor by country % Location n/a
Gender based on internet
average Gender n/a
Education based on
internet average n/a n/a
Browsing location based
on internet average n/a n/a
Age based on internet
average Age n/a
Income based on internet
average n/a n/a
Ethnicity based on internet
average n/a n/a
Children based on internet
average n/a n/a
Top Keywords from
Search Engines Search traffic n/a
Traffic sources Channel n/a
Google +1's n/a n/a
How fast does WEBSITE load? (on seconds)
Average Page Load Time
(on seconds) n/a
Pageviews per Visitor Pages /session n/a
Bounce % Bounce rate n/a
Time on site Session duration n/a
Estimated unique visitor New visitor n/a
Estimated visit Sessions n/a
Similar websites n/a n/a
Alexa Google Analytics MajesticSEO
Search traffic % Search Query n/a
Global Reach% n/a n/a
Global Pageviews % n/a n/a
Downstream sites n/a n/a
Upstream sites n/a n/a
Alexa Global rank n/a n/a
Alexa Country rank n/a n/a
Where do visitors go on
WEBSITE? (by
subdomain)
What pages do your users
visit? n/a
Table 2: list of general Alexa metrics
After some research into the feasible metrics, a few main ones were identified that would allow for a proper comparison and data analysis (DigitalGov 2017b):
Bounce %: the percentage of people that left the site without any interaction Time on site: the average time of the duration of a session
Pageviews per visitor: the number of pages that are visited per session. It represents
the division between the total pageviews and the number of visitors on the same period
Sites linking in: the number of websites that point to the website
Geographic audience: the percentage of users having visited the website in specific
locations
These metrics are all available with Alexa but also with Google Analytics, which was crucial in order to be able to compare both tools.
4.3 Participants and website sample
In order to obtain a viable sample of websites to compare, a request was sent out over two platforms, LinkedIn, a professional social media network and Swiss-lib16, an information specialist mailing list (Swiss-lib 2017), a call to personal connections was
also used. A model letter was created in English and in French (Annex 1-2), it was used on multiple occasions to form a contact point with the professional world and served as a call to webmasters.
The LinkedIn post was shared by professor Gaudinat within his network as well as within the team’s network (Annex 3-4). The Swiss-lib post was sent mid-project, with another reminder post after a month. Each post was sent out in English and in French to guarantee as much participation as possible. Furthermore, within the research team some websites from personal networks were integrated into the sample.
Altogether twelve websites that would have sufficiently analyzable data were retained. Before reaching this sample size, some websites were not included from the get-go as they had little to no data even when it came to Google Analytics. The sample size decreased to ten websites once it was discovered that two of them would not yield comparable results.
Out of the ten, two were of great size with over a million user sessions, whereas two were extremely small with only an average of about a hundred, these users sessions were based on the 3-month collection period.
The sample was made up of three different sectors: four Academic, three Business and three Health.
Figure 13: sample sectors
3
4 3
Sample sectors
The websites were from two different regions, almost two thirds of them were Swiss and the rest were international.
Figure 14: sample scope
The size of each site in the sample varied from hundreds to the millions of users, with two of them possessing over a million. On the other hand, almost half of them were on the smaller side with less than 20,000 users.
Figure 15: sample size
3 7
Sample scope
International Switzerland 2 3 4Sample size
More than 1,000,00 users in Google Analytics
Between 20,000 and 999,999 users in Google Analytics Under 20,000 users in Google Analytics
4.4 Sample limitations
When the research actually began, it became noticeable that some of the sample would be easier to handle than the rest. This was simply due to the data that was available. Considering there were only ten usable websites, the sample could be considered relatively small, this would make the recovered data all the more important.
Nonetheless, having a larger sample size would have proposed more data, as such it would not have been as unfavorable to the study if some sites did not put forward any data.
Furthermore, data was collected from the sample in one go, which meant that each website only had one data set of a three-month period. Thus, no evolution could be discerned from the data, also a correlation amongst the same website data would not be able to be identified.
Obviously aside from the websites that the sample was comprised of, alternatives were sought out to try bolster the number of participants. It was discovered that the United States (Digitalgov 2017a) and the United Kingdom governments (GOV.UK 2017) share their analytics freely, this would have added a great number of participants, and alas they were all under the same domain name. Alternative data sources also included SeeTheStats17, a Google Analytics partner, which publishes analytics of websites that have agreed to it, but the time frames would not necessarily align with the data that would be collected via Alexa.
4.5 Data preparation
When it came to the more practical side of the project, the data was a central point. The first aspect would be to set up all the areas surrounding a good preparation. It has been decided that the main collaborative platform would be SWITCHdrive, a cloud storage service dedicated to university members (Switch 2017).
Once each tool interface had been analyzed and all relative data locations had been found, a semblance of a classification could be created.
17https://www.seethestats.com/
A project location was created and named “Alexa” that enabled the team to work on the project in general. A folder by the name of “Data collection” set up in which all the data that would be collected would eventually figure. There was also a “Test site”, so a first attempt at data collection could be done.
Figure 16: Alexa > Data Collection hierarchy
Within “Data Collection” it was decided that the data from each website would be separated and they then contained a folder dedicated to each tool.
The folders attached to each tool had multiple locations inside them and they represented the categories laid out by the tools themselves.
Figure 18: Alexa folder content
Figure 19: Google Analytics folder content
Effectively, this was to ensure that if any data needed to be retrieved it would be easy to find as it was a mirror image of reality. With all the categories created, the next step could commence.
4.6 Data collection
Once all the preparations had been done, the data collection needed to be conducted. As data from multiple tools had to be collected, it was decided that the compilation would be held by website. This was to ensure that the time lapse between tools for one website would be as slim as possible.
The websites would not be compared amongst themselves, meaning that each website did not need to be handled on the same day.
For Alexa, all the available data is on a default 3-month period, unless under specific circumstances, thus the periods would be set to 3 months. This meant if retrieval was done on October 1st, the period would be set from July 1st to October 1st. Even though Alexa was set to a default period, Google Analytics had to be adapted to reflect the same dates.
Whether it be for Alexa, Google Analytics or MajesticSEO, as much data as possible was collected.
Site Collection date Start time frame End time frame
Site A 8 October 2017 8 July 2017 8 October 2017
Site B 9 October 2017 9 July 2017 9 October 2017
Site C 9 October 2017 9 July 2017 9 October 2017
Site D 9 October 2017 9 July 2017 9 October 2017
Site E 12 October 2017 12 July 2017 12 October 2017
Site F 11 October 2017 11 July 2017 11 October 2017
Site G 11 October 2017 11 July 2017 11 October 2017
Site H 11 October 2017 11 July 2017 11 October 2017
Site I 11 October 2017 11 July 2017 11 October 2017
Site J 12 October 2017 12 July 2017 12 October 2017
Table 3: time frames used for each website
As it was difficult to set date periods with Alexa, it was crucial to guarantee that all the data that was needed had been retrieved. When available, Alexa data was collected in numerous formats (.xlsx, .tsv and .csv). Although these types of exports were not always accessible, it was decided that full web page screen captures would be taken to make sure all the data was saved.
Data collection for Google Analytics was a bit more flexible, nonetheless all possibilities were exported, .xlsx, .csv and .pdf. If something was missing, it would be less complicated to retrieve data for the same period.
MajesticSEO data was collected through screen captures as it was the free version and limited possibilities were available.
After that, they were immediately stored in the correct folders to avoid data loss. Once all the information had been capture each folder was individually scanned to check nothing was missing.
4.7 Data analysis
With the data collection for each website concluded, the data could now be assembled and analyzed.
The main software that was used was Microsoft Excel, which would essentially be a master file containing the coalescence of important data.
Each website had a spreadsheet that was dedicated to its data, this enabled an overview of each participant to be established. With the use of the metric compilation table, all the comparable metrics were selected and presented in each sheet. If it was available, the necessary data was extracted from the original files and added to the master file. Some spreadsheets contained more data, as the size of the website influenced the amount of data that could be obtained. Once all the data had been consolidated, the work on the graphics could begin, this meant the relevant data had to be centralized by metric.
With the data forming concise tables, graphs were easily generated using the Excel software.
When it came to the Pearson correlations, the same spreadsheets could be used. Excel proposes a correlation formula that automatically calculates the equivalence, this data could then be represented with charts.
4.8 Results
Aside from being presented in written form there would also be visual aspects to the results.
With the use of the Excel master file, graphs could be elaborated to represent the data. To depict the overall data, cluster bar charts were used, this would allow for Alexa’s and Google Analytics’ data to be shown side by side for each site.
Figure 20: comparison example bar chart
This would give a firsthand visual to understand the deviations if any existed.
To further evaluate the similarities between the datasets, Pearson correlation cloud charts would be used.
Figure 21: correlation example graph
0 1 2 3 4 5 6 7 8 9 10 Site X Site X Site X Site X Site X
Site X Site X Site X Site X Site X
Alexa 9 8 7 1 3
Google Analytics 4 5 5 5 6
Example metric X
Alexa Google Analytics
0 2 4 6 8 10 0 1 2 3 4 5 6 7 8 9 10
Example metrix X
5.
Research findings
At the center of the study was evidently the data to which the analysis could be applied to then produce general findings.
Considering that one of the main hypotheses was that the quality of the data would not be good, it was interesting to note that at first glance the data comparatives were not as different as expected.
It had been assumed that the results would vary greatly due to the use of the toolbar, and in some cases this assumption is corroborated by considerable variations in the values of data but in other cases they were also slight. Even though the results were not as divergent as expected, the correlations still appeared to be low.
Furthermore, it appeared that it did not matter whether the websites were small or big, the data did not necessarily return better results.
MajesticSEO yielded the most impressive results when it came to sites linking in, with astronomical numbers compared to Alexa and Google Analytics, thus rendering the comparison challenging.
Seeing as the sample was not of an extremely consequent size, the ten websites were never split or categorized into size groups as to avoid limiting the sample.
Each graph portrays all the participants in the study even if there was no data to be collected. Site A is the biggest in the sample whereas Site J is the smallest. Furthermore, Site J only yielded exploitable results for sites linking in through Alexa, hence there is very little data that was comparable. Data from both Alexa and Google Analytics is represented with the numbers shown below the charts.
For the correlation cloud chart, only the websites disposing of data were integrated or there would be an obvious void in the graph.
5.1 Bounce %
The graph below represents the bounce rate percentage on the websites in the sample. Out of the ten, six yield results that can be compared, the remaining four are in the smaller category of sites and did not return any results through Alexa.
Figure 22: bounce %
Some values appear to be quite similar and do not show signs of diverging completely. In the cases of Site B and Site E the results seem to be quite similar with only about a 2% and 1% difference respectively.
On the other hand, Site A has a variation of almost 50% which is extremely striking considering it is the largest participant in the sample. Site C also has a big variation with about 20% gap. 0% 10% 20% 30% 40% 50% 60% 70% 80% 90% 100% Site A Site B Site C Site D Site E Site F Site G Site H Site I Site J
Site A Site B Site C Site D Site E Site F Site G Site H Site I Site J Alexa 70.20% 55.60% 70.30% 72.00% 88.60% 85.70%
Google Analytics 21.44% 53.47% 49.11% 82.21% 87.73% 80.49%
Bounce %
When it comes to the correlation, it was calculated on sites A to F, and it is the highest correlation obtained throughout these results with a value of r=0.5913 (Annex 5), although it is also the correlation with the least amount of values. Site A appears to be the strongest outlier amongst the others with which is substantiated by the variation of 50% in the values.
Figure 23: correlation bounce %
10% 20% 30% 40% 50% 60% 70% 80% 90% 100% 10% 20% 30% 40% 50% 60% 70% 80% 90% 100% Alexa Google AnalyticsCorrelation: Bounce %
Site A Site B Site C Site D Site E Site F5.2 Time on site
The next graph shows the time spent on the site per session for the website sample. In this case seven of the ten sites returned results that could be used, the last three did not obtain any data with Alexa.
Figure 24: time on site in seconds
For this metric, the results are slightly more variable, with Site B yielding the best comparison and a difference of only 8 seconds, and Site F also has a decent variation with 22 seconds.
There then appears to be somewhat of a jump in numbers, with Sites A, C and D having around the double number of seconds.
The variations increase with Site E having a Google Analytics time seven times longer than Alexa. On the contrary the last Site, H, with an immense fluctuation Alexa shows a time of about seventeen times more than Google Analytics.
0 50 100 150 200 250 300 350 400 450 500 550 600 650 Site A Site B Site C Site D Site E Site F Site G Site H Site I Site J
Site A Site B Site C Site D Site E Site F Site G Site H Site I Site J
Alexa 127 204 115 161 9 78 607
Google Analytics 57 196 61 79 63 56 36
Time on site in seconds
For the correlation, the sites A to H could be used for the calculation. The correlation is not good with a value of r=0.1292 (Annex 6). It is evident visually that the points do not amount to anything similar, and as stated about Site B and Site H, they are noticeably the biggest outliers of the group.
Figure 25: correlation time on site in seconds
0 50 100 150 200 250 300 350 400 450 500 550 600 650 0 50 100 150 200 250 300 350 400 450 500 550 600 650 Alexa Google AnalyticsCorrelation: Time on site in seconds
Site A Site B Site C Site D Site E Site F Site H
5.3 Pageviews per visitor
The graph below illustrates the results obtained with the metric Pageviews per session, it is also one of the metrics with the most data available, with nine out the ten sites returning exploitable data.
Figure 26: pageviews per visitor
The similarities in the data seem to be acceptable with not much variations. But Sites G, H and I, which are some of the smallest in the sample, have severe differences ranging from roughly three to ten pages.
0.00 1.00 2.00 3.00 4.00 5.00 6.00 7.00 8.00 9.00 10.00 11.00 12.00 Site A Site B Site C Site D Site E Site F Site G Site H Site I Site J
Site A Site B Site C Site D Site E Site F Site G Site H Site I Site J Alexa 2.20 3.52 2.00 1.40 1.00 1.20 2.00 7.00 1.00
Google Analytics 2.41 3.65 2.24 1.52 1.17 1.47 11.90 1.45 4.36
Pageviews per visitor
Although there is somewhat of a correlation, the value is once again low with r=-0.1059. It can be noted like above, that the sites G, H and I are outliers with highly deviating numbers.
Figure 27: correlation pageviews per visitor
0.00 2.00 4.00 6.00 8.00 10.00 12.00 0.00 2.00 4.00 6.00 8.00 10.00 12.00 Alexa Google AnalyticsCorrelation: Pageviews per visitor
Site A Site B Site C Site D Site E Site F Site G Site H Site I
5.4 Sites linking in
The sites linking in metric is represented in table format as the data is of enormous divergence due to the incorporation of MajesticSEO. It displays the results from all ten websites in the sample. MajesticSEO presents much larger numbers in multiple cases with the most blatant being for Site C and in three cases it does not deliver the highest results. Alexa’s result is inferior to those of Google Analytics, albeit for one participant, Site B.
Alexa Google Analytics MajesticSEO
Site A 154 468 191893 Site B 10545 9627 14504 Site C 2968 4541 13588123 Site D 31 159 39 Site E 11 46 2176 Site F 20 89 1891 Site G 0 31 2 Site H 4 19 1483 Site I 1 79 25 Site J 5 6 718
Table 4: number of sites linking in
A more realistic number is most likely obtained from MajesticSEO as it crawls the web to collect data, meaning it has a wider coverage and a better ability to return results for metrics such as the number of sites linking in.
5.5 Visitors by country
The Geographic Audience percentage illustrates which countries the people visiting the site are from. The table depicts the ranking of the top five countries and the percentage they each represent.
Visitor by country %
Alexa Google Analytics
Site A Egypt 21.0% Saudi Arabia 17.9% Sudan 11.6% Libya 9% Algeria 6.4% Saudi Arabia 22.8% Egypt 14.35% Iraq 10.24% Jordan 7.45% Ireland 7.35% Site B Switzerland 26.9% China 22.0% US 6.9% India 6.6% France 6.2% Switzerland 36.86% France 10.42% US 8.63% India 4.14% Germany 3.22% Site C US 37.1% France 9.2% India 4.4% Pakistan 2.0% Philippines 1.0% US 38.89% France 8.59% Germany 5.25% India 4.08% Brazil 3.34%
Site D Switzerland 64.8% Switzerland 86.34% Site E Switzerland 100.0% Switzerland 54.64% Site F
Site G
Site H
Site I
Site J
Table 5: ranking of geographic audience
Site A: the number one and two are the same countries except for they are not in the
same order
Site B: four out of five countries are the same but only the first one is in the same position
with numbers being off by roughly 10%
Site C: the number one and two positions are the same countries with the same order
and the percentages are relatively similar
Site D and E: there is a big percentage difference between the same country with only
5.6 Conclusion
When looking at the results globally, only one site has similar results in all cases, Site B. At first it could be assumed that this is due it being one of the bigger websites in the sample, but then it is not the case for the largest one, Site A.
Some websites, the smallest, had no data when it came to Alexa, which made it difficult to really compare and judge the quality of its metrics as there was nothing to analyze. With only ten websites in the sample, this obviously created some difficulty as it reduced the sample down even more.
Subsequently, with such a small sample and with websites ranging greatly in size, it was crucial to keep it intact without tarnishing the data or influencing it. Hence the sites were not separated into similar categories but kept as a collective. Although, it does not look as if there is any relation that exists when it comes to size.
Most of the time there appears to be a certain logic in the way the data fluctuates. With Alexa as an example, depending on the metric, it will either tend to have lower or higher numbers, but then there will be a random data point that will not follow the trend.
Interestingly, even though the correlation is very low, it exists, which was not expected at the beginning of this study.
6.
Research limitations
Throughout the course of the research project, multiple limitations rose relating to the tools at the center of the study. Although these limitations were seen as shortcomings, they were ultimately pivotal in the final analysis and critique.
6.1 Method
The most noticeable limitation that was identified right from the start, it was the method of the toolbar used by Alexa Internet.
Whilst carrying out the study the drawbacks of the toolbar became more and more predominant. This method impeded the collection of data on a larger scale, unlike Google Analytics which is integrated into the website’s code, hence allowing a more straightforward and regular data collection.
With Alexa’s use of the toolbar method, there was very little information surrounding how it functioned. Their website indicated that they have a representative sample, which is made up of people who have installed the toolbar but also from data banks. Although, once again there are sparse results in what the sample is made up of.
This fact leads to not being entirely able to know which websites had users that installed the toolbar, which in turned meant that it could not be known how much data could be collected through the toolbar or other means.
6.2 Scope of data
Even though a small sample of a dozen website was utilized, it became obvious that due to the toolbar collection method, that some website simply did not have enough data attached to them.
Once again this illustrates that the method of a using a toolbar to collect user-data hinders the results of depending on the website in question.
6.3 Domain names
Alexa only takes into account the domain name and not the subdomains of the websites, although there is a feature that illustrates the subdomains that are attached to the domain that is being looked up. Unfortunately, this does make all the relative information available.
When it comes to Google Analytics, all the relevant information in available whether it be for a domain or subdomain as long as the website has integrating the JavaScript code. In two cases, this hindered the results that were collected, which in turn decreased the sample size from twelve to ten websites.
6.4 Website size
As Alexa uses a sample itself in order to put forward website data, the size of the websites also constituted a problem. When it came to smaller websites, some metrics had no data due to there not being enough information collected to give statistics. Whereas with the use of Google Analytics the website could have as little as one user for results to be returned.
Therefore, when comparing Alexa’s data and Google Analytics’ data, some website could ultimately not be compared with each other as some of the metrics did not have any information depending on the size.
6.5 Timeframe
The basic data available with Alexa is on a 3-month period, and it cannot be adapted with the free plan. With a premium plan, the user can choose either 1, 3, 6 or 12 months for certain metrics.
The user is virtually unable to choose specific dates unless they have a premium plan and if the website that is being analyzed possesses important traffic on a daily basis. Thus, if the site is not of a consequent size, changing the time frame from 3 to 6 months would not have fruitful results. This was due to the fact that websites receiving little to no traffic do not have enough metric data to be able to return satisfactory results.
On the contrary, Google Analytics allows an extremely precise date range, which can be changed to almost any time frame that the webmaster wishes.
6.6 Accessibility
Alexa is a tool that is available to all, any number of websites can be researched and depending on the information that is available any member of the public can obtain it. This plays into the fact that Alexa is more of a commercial tool than Google Analytics, so information can be retrieved quickly. This data does not necessarily have to be from your own website but the website of your competitor for instance, they can then be compared and the standing between them can be identified.
Google Analytics has a more complicated way of working, which is due to it mostly being a tool dedicated to the webmaster to allow strategic decisions and to determine how the website is doing. In order for a member of the general public to be able to access this information, the rights have to be shared.
Hence, for this study the sample was based on the websites that gave us permission to access their Google Analytics, the Alexa sample was collected as to conform with it.
6.7 Complexity
Alexa’s interface is quite intuitive, it resembles a standard web interface making it easy to get the hang of, and the number of sections is also concise with understandable terms. When using a premium Alexa plan, additional menus become available but always with a set amount of areas.
Google Analytics is a much more complex tool, with multiple sections separated into different categories. Some data can also be found in more than one area, which makes navigating the tool somewhat complicated. This makes it a tool that requires the user to come to terms with how it works seen as some information can be hidden within the interface.
Consequently, both tools had to be examined beforehand as to allow an adequate data collection.
6.8 User sessions
The toolbar is installed on a specific browser as an add-on, Alexa asks if it can gather personal data before the user can proceed. As it is attached to a browser it could possibly mean that information can be collected from the user as long as they are not idle. Google Analytics doesn’t necessarily differentiate a user if they visit the website as they could have multiple IP addresses (unless they are logged in with their Google account, for instance), although it is difficult to judge the real outcome of multiple sessions.
For the duration of the study, it was evident that the websites in the sample were not to be visited on a regular basis in order to not influence the results.
6.9 Amazon and Google
This study mainly dealt with two tools from big companies that are Amazon and Google. It was obviously important to remain neutral when it came to analyzing and dealing with the data. In order to remain as objective as possible concerning the data, every step had to be done without any preconceptions in mind.
Amazon, being a commercial giant and Google, being a leader in analytics, they each have their rightful place when it comes to web traffic tools, but the data has to be the one to do the talking and not the namesakes.
7.
Reflection on Alexa
Even with the small sample of websites, it can be noted that the correlation with Google Analytics was very low, but the data that was used was usually inconsistent as some websites could not always be compared.
As mentioned previously, not much information on how the data is collected exists, there is also the aspects of coverage. A toolbar cannot work with a smartphone, which is a device becoming more and more prominent, so how can the sample they use be representative, could it be due to the data banks they use? Unfortunately, they share so little information that is it challenging to judge.
For the main aspects of transparency, reliability, trustworthiness and flexibility, some conclusions can be reached on the Alexa front.
7.1 Transparency
It was extremely difficult to find data of how Alexa dealt with its web traffic tool. When inspecting the Alexa website and any related information, it was clear that their transparency has decreased over the years instead of getting better.
They have steadily made less and less information available surrounding how many people have the toolbar installed, but also which data banks they use when it comes to creating a representative sample.
7.2 Reliability
It is evidently difficult to judge the reliability of Alexa with precise information as there is no referential tool.
Even though Google Analytics appears to be steady leader mostly due to its coverage, there is no way of knowing that the data made available is a completely realistic representation of the data.
With the data obtained in this study, it can be assumed that even though the numbers are not exactly the same, they are in the same ballpark for the most part.
7.3 Trustworthiness
Alexa is a tool that can be seen as ideal when it comes to getting a general idea of the situation at hand for any given site.
There still appears to be very little communication surrounding the tool itself, how it works, who uses it, where the information comes from. So how can the data be trusted when it is not known what it is actually made up of.
Simple human ignorance can also play a part in the trust that is given to Alexa, people are less inclined to want to know what information they are sharing, they do it without a second thought until they realize they have share all their personal information. This isn’t necessarily the tool’s fault but Alexa doesn’t exactly willingly put forward what they do surrounding the data.
Information about the fact they collect your data is not explicitly given either, until you are just about to install the toolbar, whereas it should be stated in the description of the extension itself.
7.4 Flexibility
When it comes to the usage of the tool, it lacks flexibility that allows the user to make their own choices.
The free version proposes a snapshot of the data that is available which presents a small amount of data that cannot be adapted to ones needs.
The paid service offers slightly more data and also the ability to change the date range. Sadly, unless the site you are researching is big enough to have sufficient data for the past, no results will be returned. This renders the fact you can change the date pointless and it could obviously be improved immensely.
Nonetheless, Alexa is becoming a more complete tool by the means of different data acquisitions such as the use of their certification that integrates JavaScript code.